Free Access
Fig. C.1.
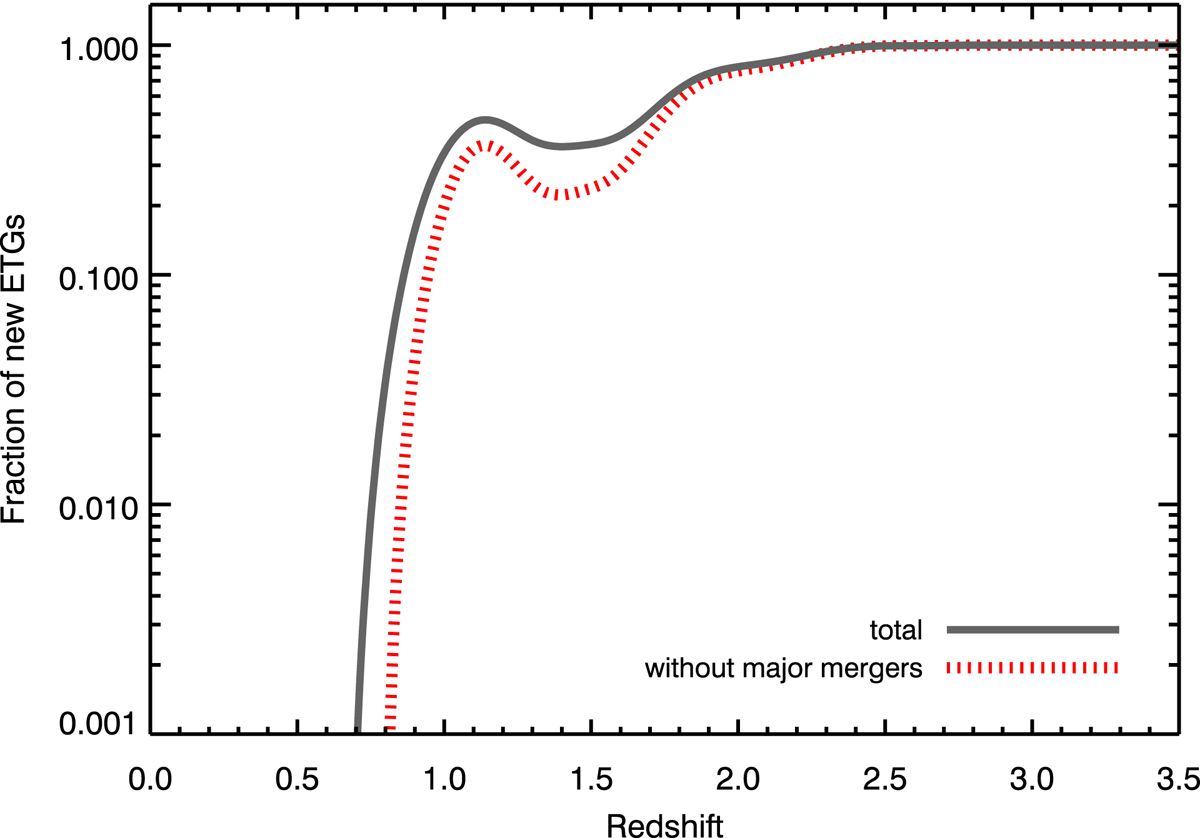
Smoothed evolution of the fraction of ≤500 Myr 2 × 10¹¹ M⊙ QGs as a function of redshift (dark curve). The red dotted curve shows the pSB fraction after subtracting the descendants of major mergers (i.e., with mass ratios μ ≥ 1/3).
Current usage metrics show cumulative count of Article Views (full-text article views including HTML views, PDF and ePub downloads, according to the available data) and Abstracts Views on Vision4Press platform.
Data correspond to usage on the plateform after 2015. The current usage metrics is available 48-96 hours after online publication and is updated daily on week days.
Initial download of the metrics may take a while.