Fig. D.1.
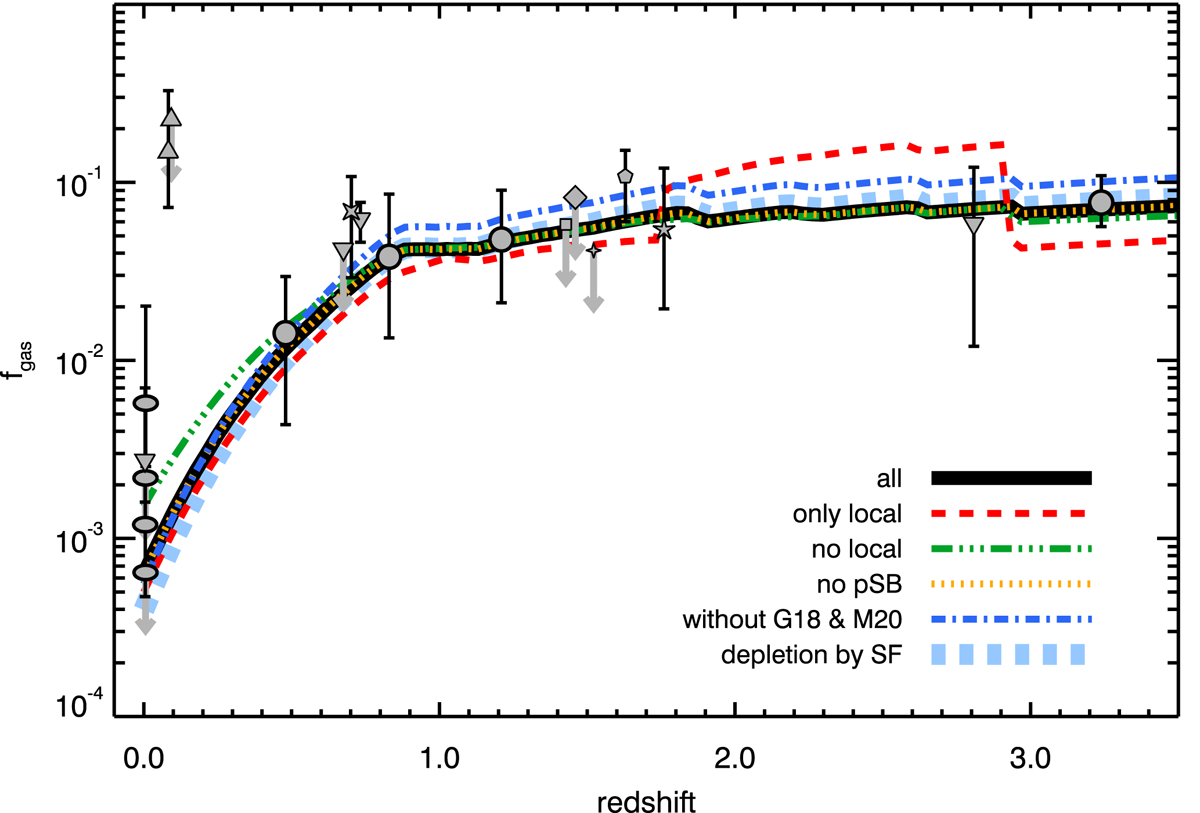
⟨fgas⟩ evolution when fitting all data points, as in Fig. 2 (thick black curve), only local objects (dashed red curve), only intermediate-to-high redshift galaxies (green dash-dot-dotted curve), or ignoring either pSB galaxies (dotted yellow curve) or dust-derived constraints (G18 and M20; dash-dotted blue curve). For comparison, the best-fit model with SF gas depletion is shown as a thick dashed light-blue line. The tracks shown here are for a 1.5 × 10¹¹ M⊙ QG, while the gray points show the various samples used, as in Fig. 2.
Current usage metrics show cumulative count of Article Views (full-text article views including HTML views, PDF and ePub downloads, according to the available data) and Abstracts Views on Vision4Press platform.
Data correspond to usage on the plateform after 2015. The current usage metrics is available 48-96 hours after online publication and is updated daily on week days.
Initial download of the metrics may take a while.