| Issue |
A&A
Volume 644, December 2020
|
|
|---|---|---|
| Article Number | A161 | |
| Number of page(s) | 15 | |
| Section | Extragalactic astronomy | |
| DOI | https://doi.org/10.1051/0004-6361/202039020 | |
| Published online | 15 December 2020 | |
A Virgo Environmental Survey Tracing Ionised Gas Emission (VESTIGE)
VII. Bridging the cluster-ICM-galaxy evolution at small scales
1
Aix Marseille Univ., CNRS, CNES, LAM, Marseille, France
e-mail: This email address is being protected from spambots. You need JavaScript enabled to view it.
2
Dipartimento di Fisica G. Occhialini, Universitá degli Studi di Milano Bicocca, Piazza della Scienza 3, 20126 Milano, Italy
3
INAF – Osservatorio Astrofisico di Arcetri, Largo E. Fermi 5, 50125 Firenze, Italy
4
INAF – Istituto di Radioastronomia, Via P. Gobetti 101, 40129 Bologna, Italy
5
Dipartimento di Matematica e Fisica, Universitá degli studi Roma Tre, Via della Vasca Navale, 84, 00146 Roma, Italy
6
INFN – Sezione di Roma Tre, Via della Vasca Navale 84, 00146 Roma, Italy
7
Observatoire de Paris, Collège de France, PSL University, Sorbonne University, CNRS, LERMA, Paris, France
8
Department for Astrophysics, University of Vienna, Türkenschanzstrasse 17, 1180 Vienna, Austria
9
National Research Council of Canada, Herzberg Astronomy & Astrophysics Research Centre, 5071 W. Saanich Rd, Victoria, BC V9E 2E7, Canada
10
Laboratoire d’Astrophysique de Bordeaux, Univ. Bordeaux, CNRS, B18N, Allée Geoffroy Saint-Hilaire, 33615 Pessac, France
11
INAF – Osservatorio Astronomico di Brera, Via Brera 28, 20159 Milano, Italy
12
Centro de Astronomía (CITEVA), Universidad de Antofagasta, Avenida Angamos 601, Antofagasta 1270300, Chile
13
European Southern Observatory, Karl-Schwarzschild-Strasse 2, 85748 Garching, Germany
14
7 AIM, CEA, CNRS, Université Paris-Saclay, Université Paris Diderot, Sorbonne Paris Cité, Observatoire de Paris, PSL University, 91191 Gif-sur-Yvette Cedex, France
Received:
24
July
2020
Accepted:
4
October
2020
Abstract
Aims. We measure far-infrared (FIR) emission from tails of stripped dust following the ionised and atomic gas components in galaxies undergoing ram pressure stripping. We study the dust-to-gas relative distribution and mass ratio in the stripped interstellar medium and relate them to those of the intra-cluster medium (ICM), thus linking the cluster-ICM-galaxy evolution at small-scales. The galaxy sample consists of three Scd Virgo galaxies with stellar masses in the range of 109 ≲ M* ≲ 1010 M⊙ and within 1 Mpc from the cluster centre, namely NGC 4330, NGC 4522, and NGC 4654.
Methods. Through the analysis of Virgo Environmental Survey Tracing Ionised Gas Emission (VESTIGE) Hα, Herschel SPIRE FIR, and VLA Imaging of Virgo in Atomic gas HI data, we trace the spatial distribution of the tails and infer the dust and gas masses from the measured FIR 250 μm and HI flux densities. Dust-to-gas mass ratios in the tails are analysed as a function of the galaxy mass, metallicity, and dust temperature.
Results. Along the stripped component, the dust distribution closely follows the HI and Hα emitting gas, which extend beyond the optical disc (defined by the B-band 25th magnitude isophote). In these regions, the dust-to-gas mass ratios are 2.0 ± 0.6 × 10⁻³, 0.7 ± 0.1 × 10⁻³, and 0.4 ± 0.03 × 10⁻³ for NGC 4330, NGC 4522, and NGC 4654, respectively. Thus, dust is widespread in the stripped material with a lower dust-to-gas mass ratio (up to a factor of 15) than the one measured in the main body of nearby galaxies. We also find a negative trend in the dust-to-gas mass ratio as a function of the metallicity that can be explained in terms of a dust component more centrally concentrated in more metal-rich systems. Together with the finding that the stripped dust is cold, Td ≲ 25 K, our results can be interpreted as a consequence of an outside-in stripping of the galaxy interstellar medium.
Conclusions. Gas and dust in galaxies are perturbed in a similar fashion by the cluster environment, although their relative contribution differs from the one measured in the main body of the galaxies. When this value is considered, ram pressure stripping is consistent with being one of the key mechanisms in building up the Virgo intra-cluster component, injecting dust grains into the ICM, thus contributing to its metal enrichment.
Key words: galaxies: clusters: general / galaxies: clusters: individual: Virgo cluster / galaxies: clusters: intracluster medium / galaxies: evolution / galaxies: interactions / galaxies: ISM
AL acknowledges support from the French Centre National d’Etudes Spatiales (CNES).
© A. Longobardi et al. 2020
 Open Access article, published by EDP Sciences, under the terms of the Creative Commons Attribution License (https://creativecommons.org/licenses/by/4.0), which permits unrestricted use, distribution, and reproduction in any medium, provided the original work is properly cited.
1. Introduction
In a Λ cold dark matter (ΛCDM) universe, where the hierarchical evolution is the driving mechanism in determining the current epoch characteristics of galaxies, it is expected that an abundance of low surface brightness, intra-cluster tidal debris from disrupted systems, and an ubiquity of diffuse structures permeate the intra-cluster medium (ICM) of galaxy clusters (e.g. Napolitano et al. 2003; Murante et al. 2004; Sommer-Larsen et al. 2005). In fact, as a consequence of environmental processing, when a galaxy enters a high-density region, it can be subjected to gravitational interactions with other galaxies or with the potential well of the over-dense region or, alternatively, it can feel the pressure exerted by the hot and dense ICM (Boselli & Gavazzi 2006). Baryons are stripped from the main body of the galaxies, resulting in the production of tails of stripped material. This history is often hidden, however, being at surface brightness levels much fainter than the sky. It is only thanks to advances in sensitivity as well as in angular and spatial resolution of modern multi-frequency instrumentation that astronomers have been able to collect growing evidence of objects undergoing stripping in the different phases of the interstellar medium (ISM). Long tails of atomic gas have been detected and interpreted to be the result of the stripping of the, more extended, galaxy HI disc (e.g. Chung et al. 2009). In some cases, this gas also appears as ionised (hotter) and is detected through its Hα emission (e.g. Boselli et al. 2016; Poggianti et al. 2017; Fossati et al. 2018; Bellhouse et al. 2019), or it may get heated to the cluster X-ray temperature (Sun et al. 2006). Finally, cold molecular gas, which is usually detected through its CO emission, has been found to follow the stripped HI component (e.g. Vollmer et al. 2008; Verdugo et al. 2015; Jáchym et al. 2017; Moretti et al. 2018, 2020; Cramer et al. 2020; Zabel et al. 2019).
Since the dust is also perturbed by environmental processing (e.g. Cortese et al. 2010a,b; Kenney et al. 2015; Abramson et al. 2016) and in galaxies it is associated with the gaseous component of the ISM, it is generally expected that part of the dust is removed together with the gas during stripping. Several studies in the literature have identified dust in absorption in stripped tails through the analysis of the Balmer decrement. However, since it is associated with extra-planar HII star-forming regions, this is likely formed in situ (e.g Fossati et al. 2016; Poggianti et al. 2017, 2019; Gullieuszik et al. 2017; Bianconi et al. 2020). Thus, to which extent the dust follows the same fate as the stripped hydrogen is still an open question. We do not know whether the dust-to-gas ratios in the stripped tails of systems undergoing environmental processing differ from those measured in the main body of the galaxies. Thus, we do not know whether the properties between the different phases of the ISM change during the different stages of evolution. Additionally, if the stripped tails lie outside the galaxies’ optical discs, they are likely going to be removed from the cluster spirals and to build up the cluster intra-cluster component (ICC).
This work aims at bridging the cluster-ICM-galaxy evolution at small scales by analysing the relative fraction in mass of the different baryonic components in the stripped ISM of galaxies subject to environmental processes. Our study targets galaxies in the Virgo cluster, that is the nearest large concentration of mass; furthermore, it is a dynamically young cluster (e.g. Binggeli et al. 1987; Böhringer et al. 1994) for which an exceptional collection of multi-frequency data at good and optimal resolution and sensitivity is available. In this context, the Virgo Environmental Survey Tracing Ionised Gas Emission (VESTIGE; Boselli et al. 2018) is a new, blind Hα survey providing us with the largest and most in-depth information on the ionised gas emission in Virgo, revealing unknown tails of stripped gas in several cluster members. Additionally, the Virgo cluster has recently been shown to contain a diffuse IC dust (ICD) component that is widespread in the cluster ICM with a dust-to-gas mass ratio of Md/Mg = 3.0 ± 0.3 × 10⁻⁴ and it is likely transported into the IC space by stripping (Longobardi et al. 2020).
Throughout the paper, we consider the cluster centred on M 87, with a virial radius of rvir = 1.55 Mpc (McLaughlin 1999). By assuming a flat ΛCDM universe with ΩM = 0.3, ΩΛ = 0.7, H0 = 70 km s−1 Mpc−1, and a distance for Virgo of 16.5 Mpc (Gavazzi et al. 1999; Mei et al. 2007; Blakeslee et al. 2009), the adopted physical scale is 80 pc arcsec−1. The optical disc extention refers to the B-band 25th magnitude isophote.
2. Photometric data
The data comes from a compilation of multi-wavelength campaigns surveying the Virgo cluster in the ultraviolet (UV), optical, radio, and far-infrared (FIR). In what follows, we give a brief description of these surveys and refer the reader to the references therein for additional details.
2.1. The VESTIGE survey
VESTIGE is a blind survey of the Virgo cluster carried out with MegaCam on the Canada-France-Hawaii Telescope (CFHT) with the Hα narrow band filter1 and the broad-band r′ filter (Boselli et al. 2018). It is designed to cover a total area of 104 deg2 and reach the two main subclusters (Virgo A centred on M 87 and Virgo B centred on M 49) out to their virial radii. Currently the survey covers 40% of the designed area at full depth with the current observations taken in excellent weather conditions (median seeing ∼0.62″ and 0.65″ in the narrow-band and r′-band filter, respectively). VESTIGE data have been reduced using the Elixir-LSB package (Ferrarese et al. 2012), which is optimised for the removal of the instrumental background and scattered light from the science frames. This provides a high signal-to-noise ratio of the extended low surface brightness features, making VESTIGE a deep photometric survey, which for extended sources reaches a depth of Σ(Hα) ∼ 2 × 10⁻¹⁸ erg s−1 cm−2 arcsec−2 at 3″ resolution. The photometric zero points were tied to Pan-STARRS photometry for both filters with a final photometric uncertainty of ∼2−3% (see Boselli et al. 2018). All final images have the same astrometric reference frame, which is tied to the positions of stars in the Sloan Digital Sky Survey (SDSS), with a spatial scale of 0.186″ px−1 (Gwyn 2008). Finally, Hα images with the only nebular line contribution are obtained via the subtraction of stellar continuum. The latter is obtained scaling the r′-band image by a (g′ −r′) colour factor that accounts for the difference in the central wavelength of the narrow and broad band filters (see Boselli et al. 2018, 2019, 2020; Fossati et al. 2018). The optical g′-band information is taken from the Next Generation Virgo Cluster Survey (Ferrarese et al. 2012), which we describe below.
2.2. The NGVS survey
The broad band optical information is taken from the Next Generation Virgo Cluster Survey (NGVS; Ferrarese et al. 2012), a deep CFHT programme in the u*, g′, i′, and z′ bands, which covers a total area of 104 deg2 in Virgo. The data were reduced with the Elixir-LSB pipeline and the photometric zero points were tied to SDSS photometry, as was done for the VESTIGE data. The typical full-width-half-maximum (FWHM) is ∼0.55″ in the i′ band and ∼0.8″ in the other bands. In the g′ band, the NGVS reaches a depth for extend sources of g′ = 27.7 mag arcsec2.
2.3. The HeViCS survey
Far-infrared data come from the Herschel Virgo Cluster Survey (HeViCS; Davies et al. 2010), a programme that covers ∼60 deg2 of the Virgo cluster using the PACS (Poglitsch et al. 2010) instrument at 100 and 160 μm as well as the SPIRE (Griffin et al. 2010) instrument at 250, 350, and 500 μm. Data were integrated into the Herschel Reference Survey (HRS; Boselli et al. 2010), and their reduction was carried out as described in Ciesla et al. (2012) and Cortese et al. (2014). The sensitivity and FWHMs of the PACS observations are ∼6.8 and ∼3.1 MJy sr−1 and 7″ and 12″ at 100 and 160 μm, respectively, while the sensitivity and FWHMs of the SPIRE observations are ∼1.0, 0.8, and 1.0 MJy sr−1 and ∼18″, ∼25″, and ∼36″ at 250, 350, and 500 μm, respectively. Among these, the FIR 250 μm observations are the only ones that allow for a statistically significant measurement of the fluxes in the tail regions due to a compromise between spatial resolution and depth (see Sect. 4.1). As a result of this, the main photometric analysis in Sect. 4 is only based on SPIRE 250 μm data, for which the adopted beam size value is the pipeline beam solid angle equal to 469.35 arcsec2.
2.4. The VIVA survey
The VLA Imaging of Virgo in Atomic gas (VIVA) survey is an imaging survey in HI of 53 Virgo late-type galaxies, covering angular distances of ∼1−12 deg (∼0.3−3.5 Mpc) from the cluster’s centre (Chung et al. 2009). The total HI image, the intensity weighted velocity field, and the velocity dispersion image were produced using the Astronomical Imaging Processing System (AIPS) by taking moments along the frequency axis (the 0th, 1st, and 2nd moment). This resulted in an HI imaging survey with a typical spatial resolution of 15″ and a column density sensitivity of about 3−5 × 1019 cm−2 (3σ) per 10 km s−1 channel. For our sample of objects (see the next section), the beam FWHMs are 26.36″ × 23.98″, 18.88″ × 15.20″, and 16.14″ × 15.52″ for NGC 4330, NGC 4522, and NGC 4654, respectively.
2.5. The GUViCS survey
The GALEX Ultraviolet Virgo Cluster Survey (GUViCS; Boselli et al. 2011) presents GALEX far-UV (FUV) and near-UV (NUV) observations of the Virgo cluster. It combines data from the All-sky Imaging Survey (∼5″ spatial resolution and single-exposure times of typically 100 s) and the Medium Imaging Survey (MIS; same spatial resolution, but with deeper exposure times of at least 1500 s), processed with the GALEX pipeline (Bianchi 2014).
3. The galaxy sample
To study the interplay between gas and dust during a late stage of galaxy evolution and its connection with the building up of the Virgo ICC, our study samples galaxies with tails of ionised Hα, neutral HI, and FIR emission, extending beyond the galaxy’s optical disc, namely NGC 4330, NGC 4522, and NGC 4654. They are all galaxies of Scd morphological type, located within 4 deg (∼1 Mpc) from the cluster centre, and with intermediate stellar masses in the range of 109 ≲ M* ≲ 1010 M⊙. Table 1 lists some of the physical properties of the galaxy sample.
Physical properties of the galaxy sample.
NGC 4330 shows truncated discs in UV and Hα (e.g. Vollmer et al. 2020; Fossati et al. 2018), FIR (Cortese et al. 2010a), HI (Chung et al. 2009; Abramson et al. 2011), and CO (Lee et al. 2017) on the north-east side of the stellar disc, and it shows a low surface-brightness as well as extended tails of ionised and neutral atomic gas on the southern side. It is a clear example of a galaxy undergoing ram pressure stripping that is effectively quenching the star formation activity with an out-in radial gradient (Fossati et al. 2018). NGC 4522 is farther away in projected distance from the centre of the cluster (0.9 Mpc); however, it still experiences ram pressure stripping as indicated by the HI and CO asymmetric morphology (Vollmer et al. 2006, 2008; Chung et al. 2009). Finally, NGC 4654, at the same distance of NGC 4522, shows HI and CO gas distributions compressed in the north-west, but very extended HI gas on the opposite side (CO observation do not extend at such distances; Chung & Kim 2014). The stellar and Hα morphologies are also asymmetric, showing an enhancement of ionised emission in the north-west, which is representative of recent star formation in this region (Chung et al. 2007), as well as tails of stripped stars in the south-east. As a result of these characteristics, NGC 4654 may be the only case in our sample of galaxies undergoing both ram pressure and tidal stripping, as has also been suggested by the theoretical models of Vollmer (2003).
We stress that this sample is not complete. NGC 4330, NGC 4522, and NGC 4654 represent 40% of the Virgo galaxies with Hα, HI, and FIR tails, and only ∼5% of the galaxies that are expected to be subject to ram pressure stripping in Virgo (Boselli & Gavazzi 2014). The following three main factors led to this incompleteness. First, the VESTIGE survey has reached full sensitivity only in the central 5° of the cluster, thus it does not allow for a complete comparison with the VIVA sample; the latter extends out to the edge of the cluster. Second, our sample is biased towards bright and massive galaxies: Only ten VIVA targets are classified as Sd/Sm/Im galaxies and 50% of these lie outside the VESTIGE complete region. Third, for the remaining fraction of low mass galaxies within the sampled area, the current sensitivity and resolution of the FIR observations are likely prohibitive to detect stripped dust tails. However, these objects are expected to be the most affected by environmental processes. Even though it is limited in statistics, our work is to be considered a pilot study for future campaigns.
4. Stripped tails
Truncated discs of gas and dust due to environmental effects have already been investigated in the past (e.g. Chung et al. 2009; Cortese et al. 2016, 2010a; Lee et al. 2017). Here, we focus on the novelty of the present study, that is, the identification of more extended Hα tails, the detection of diffuse FIR emission of dust tails, and their connection with the HI gas component.
In Fig. 1 we compare the g′-band, Hα, FIR 250 μm, and HI maps for our sample of galaxies, where we smoothed the original Hα and FIR images with a Gaussian kernel of 2.5″ and 12″, respectively, to better show the faint structures. In Hα, FIR, and HI, these galaxies are morphologically asymmetric. Furthermore, by comparing the gas and dust distributions with the optical disc extension (white ellipses in Fig. 1), in addition to the well-known truncated discs in Hα, FIR, and HI, a component is visible that extends outside the optical radius. These features are very faint in Hα and FIR, reaching the respective survey sensitivity limits in both bands.
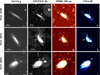 |
Fig. 1. g′-band, Hα, FIR 250 μm, and HI maps for the galaxies in our sample. The Hα and FIR 250 μm images were smoothed by a Gaussian kernel of 2.5″ and 12″, respectively. Tails of stripped material extending beyond the optical disc (dotted ellipse) are visible in the Hα, FIR 250 μm, and HI bands. White arrows indicate the wind direction (Vollmer 2003; Lee et al. 2017). The red cross in the g′-band image of NGC 4330 identifies the background contaminant (see text). North is up; east is to the left. |
NGC 4330. The previously detected Hα and HI tails bending to the south in the downstream region of NGC 4330, together with the Hα low surface brightness filaments that extend further from the tail to the south (e.g. Chung et al. 2009; Fossati et al. 2018), are followed by a tail of dust emitting in the FIR that extends out to 6 kpc from the galaxy disc, which has never been detected before. Superimposed to the Hα emission in the tail are regions of recent star formation, which are better seen in Fig. 2 where the VESTIGE Hα image is compared to GUViCS FUV emission from young stars (magenta contours). These features have been previously identified by several authors in the past (Abramson et al. 2011; Boissier et al. 2012; Fossati et al. 2018), and they can also be explained by a stripped dust component that cools the gas ablated from the disc and leads to episodes of star formation. The correlation between the ionised gas, dust (red contours), and the HI emission (blue contours) shown in Fig. 2 may support this hypothesis. Furthermore, the atomic gas and dust display similar extensions to that of the ionised gas, also covering the region where the low surface brightness Hα filaments appear. On the contrary, the FUV emission is limited to the downstream tail and does not cover the regions extending further south, suggesting that we may expect ionised Hα emission to have another origin than photoionisation. In this scenario, the tail hosts massive star formation, which ionises the cool gas producing Hα emission, while the southern filaments result from the ionisation of stripped atomic gas from thermal conduction or shock-heating due to the interaction with the hot ICM, as has recently been confirmed in the theoretical work of Vollmer et al. (2020) on NGC 4330 and as has been found in other ram pressure tails (Fossati et al. 2016) or simulations (Tonnesen & Bryan 2012). Finally, the morphology of the filaments, their length, width, and clumpiness may result from the presence of magnetic pressure (Fossati et al. 2018), as can also be seen in theoretical studies of multi-phase gas stripping (see for example, Ruszkowski et al. 2014; Tonnesen & Stone 2014).
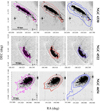 |
Fig. 2. Smoothed Hα VESTIGE images of NGC 4330 (top), NGC 4522 (centre), and NGC 4654 (bottom) compared with the GALEX FUV emission (magenta contours), SPIRE 250 μm emission (red contours), and VIVA HI emission (blue contours). The faintest emissions from the SPIRE 250 μm data are at surface brightness levels of 0.6 MJy sr−1, while the HI contour levels reach column densities values of ΣHI = 2 × 1019 cm−2. Dotted black ellipses trace the extensions of the galaxies’ optical discs. The regions of the tails outside the optical disc are considered for our photometric analysis (red dotted contours). Linear scales and synthesised beam sizes are shown in the bottom-left and bottom-right corners, respectively. |
NGC 4522. Observed for the first time, two low surface brightness filaments of ionised gas extend by ∼10 kpc north from the optically bright galaxy (Fig. 2, central raw). The signal, which is very faint and close to the sensitivity limit of VESTIGE (it has a typical surface-brightness of (1−2)×10−18 erg cm−2 s−1 arcsec−2), defines a very narrow and elongated morphology which likely suggests a dynamically important magnetic field component, as is also the case for NGC 4330. Closer to the optical disc, NGC 4522 is characterised by similar distributions of the ionised and atomic gas, and dust. The Hα, FIR, and HI images show truncated discs (see Fig. 1) above which extraplanar emissions extending towards the north-west and west are clearly visible. FUV emission is present in both extraplanar regions, resembling a front of star-formation triggered by the ram pressure event, and they also extend beyond the truncated discs. As argued by Vollmer et al. (2012), this is consistent with the galaxy having been stripped very recently (several 10 Myr; Crowl & Kenney 2006; Vollmer et al. 2006) and with the timescale of gas stripping due to ram pressure being shorter than the timescale of FUV emission (∼100 Myr).
NGC 4654. The truncation of the ionised and atomic gas and dust discs in the north-west (Fig. 1) are clear signatures of ram pressure, while the long HI tail observed in the south-east is consistent with a concurrent action of ram pressure and tidal stripping. The gravitational interaction with NGC 4639 occurred 500 Myr ago and is also responsible for the disturbed morphology of the stellar component in the south-east (Vollmer 2003). Focusing on the tails, the stripped component is visible in all bands on the eastern side, with a similar spatial distribution in their ionised gas and dust emissions and a more extended atomic gas component. The overlap of the FUV emission in this region supports the idea that dust may act as a cooling agent for the neutral gas, provided that the HI density is sufficiently high or that molecular gas is present, favouring the formation of new stars traced by the Ha and FUV emission. Differences among different components are stretched for the tail extending on the south-east. Here, the HI tail extends out to ∼30 kpc from the optical disc, followed by FUV emission but no ionised gas. This sets the time-scale of the star-formation process. In fact, Hα traces recent events on timescales of ∼10 Myr (Boselli et al. 2009; Boquien et al. 2014), while FUV emission timescales extend to ∼100 Myr. Finally, a tail of dust follows the HI component, although its extension is limited to 9 kpc at the sensitivity of the SPIRE data.
The tails we identify in Hα, FIR 250 μm, and HI are all interpreted as a ram pressure stripped component. This has been vividly illustrated for the ionised and neutral atomic gas, but still needs to be justified for the dust component. Dust in stripped tails may, in fact, have an in situ origin and be produced by recent episodes of star formation (e.g. Poggianti et al. 2019). However, the evidence that (i) NGC 4330, NGC 4522, and NGC 4654 are all characterised by truncated dust discs and that (ii) the resolution of the SPIRE data is not sufficient to identify regions of recent star formation in the FIR (i.e. the dust tails are diffuse at the resolution of the SPIRE data) may support the scenario that the dust we detect in emission is, indeed, stripped. Future follow-up studies, which will analyse the dust distribution at higher resolutions and sensitivities, will be instrumental to confirm our conclusion.
4.1. Photometry
As we are interested in bridging the cluster-ICM-galaxy evolution, the photometric analysis focuses on the portions of the tails extending beyond the optical discs (dotted ellipses in Figs. 1 and 2).
For each galaxy and photometric band, the analysis was performed on the region within a constant FIR surface brightness level of ≥0.6 MJy sr−1 (dark-red dotted lines in Fig. 2), which is the noise confusion limit of the SPIRE survey in the 250 μm band. As in Fossati et al. (2018), we computed fluxes as the sum of the pixel values contained within the chosen regions and subtracted a background level which was measured as the median value of 1000 measurements computed in the same size apertures that are randomly distributed across the image after masking bright stars and the main body of the galaxy. The Hα values were corrected for Galactic attenuation (see Fossati et al. 2018, for details). The uncertainty on the fluxes was obtained by standard propagation, that is quadratically combining the uncertainties of the background (rms-variance of the bootstrap samples) and flux counts. The latter was estimated differently for the different bands: For the Ha images, Poisson statistics was assumed; for the HI images, we used the rms-variance from Chung et al. (2009) scaled by a factor that takes the aperture area into account; and for the FIR images, we used Monte Carlo simulations, generating 100 realisations for each region with fluxes drawn pixel-by-pixel from a Gaussian distribution centred on the observed flux and a standard deviation equal to the Herschel SPIRE RMS map. The statistics of the simulated data set give us the error associated with the flux measurements. We note that the adopted technique for the background removal also subtracts the signal coming from the diffuse Virgo IC dust, which was measured to be constant on a much larger scale (∼1 deg; Longobardi et al. 2020) than the one we used for the background estimation. We also emphasise that because of the relatively large areas we used to define the tail regions, the photometry was not affected by beam smearing even in the HI images characterised by the poorer spatial resolution.
Finally, as already stressed in Sect. 2, FIR data at wavelengths outside the SPIRE 250 μm band are too shallow and too poorly resolved to allow for a statistically meaningful measurement of the fluxes. For instance, the same photometric analysis carried out on the PACS images yields estimates for flux densities with S/N < 1.5. Therefore, in the following analysis, the results are extracted from the information derived from the 250 μm images, and the PACS data is only used to set upper limits on the temperature of the stripped dust.
4.2. FIR Background contamination
Since the targeted FIR surface brightnesses are close to the confusion limit of the Herschel survey, any possible background contamination must be carefully taken into account. The areas we study are indeed large enough to host background galaxies whose emission contributes to the estimated FIR fluxes. The spatial distribution of low luminosity (z-band mag ≥ 20.0) and compact background sources (extracted from SDSS DR12; Alam et al. 2015) located around our galaxies is homogeneous and well-sampled across the field-of-view of interest. If there is some contamination from these objects that are not resolved in the FIR images, then their contribution is folded in the background estimates and their uncertainties. However, the presence of extended and luminous galaxies may imply a larger contribution that must be taken into account. We identified one bright background object in the stripped tail of NGC 4330 with a photometric redshift of zph = 0.14 and a magnitude of z-band mag = 19.6.
Using the plethora of multi-wavelength data surveying the Virgo region, we estimated the expected flux in the Herschel 250 μm band due to background contamination by the broad-band spectral energy distribution (SED) fitting code CIGALE2 (Burgarella et al. 2005; Noll et al. 2009; Boquien et al. 2019). Specifically, we used a Salpeter initial mass function (IMF) and the SEDs of Bruzual & Charlot (2003) convolved with different exponentially decreasing star formation histories (SFHs). The dust emission is given by the Draine et al. (2014) models, with a dust attenuation described by a modified Charlot & Fall (2000) attenuation law (Buat et al. 2018).
The observational data used to constrain the SED fitting were limited to the UV-MIR region where the object fluxes are well above the sensitivities and confusion limits of the surveys. In particular, we used GUViCS near- and far-UV data, deep broad-band u′ g′ r′ i′ z′ data from NGVS and VESTIGE, and deep Spitzer IRAC and MIPS photometry at 3.6, 4.5, 5.8, 8.0, and 24 μm (Fazio et al. 2004; Rieke et al. 2004). The CIGALE method is based on an energy balance between the energy absorbed by dust in the UV-optical and the energy re-emitted as IR radiation by the dust itself. We can, therefore, consistently extrapolate the flux redistributed at FIR wavelengths just sampling to the MIR wavelengths (Dobbels et al. 2020). The fit gives a 250 μm flux density (Bayesian estimate) of FCIGALE = 1.17 ± 0.4 mJy, with an effective reduced chi-square, χ2 = 0.7. Thus, the background galaxy contributes ∼10% to the total flux density in the tail of NGC 4330, which can be subtracted. In Fig. 3, we plotted the observed and modelled UV to IR SED of the background galaxy to qualitatively show the reliability of the fitting result. In Appendix A, the reader can find a summary of the main photometric properties of the identified background galaxy (Table A.1) and the SED fitting results, together with the information on the initial parameters adopted in the fitting (Table A.2).
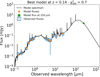 |
Fig. 3. SED of the background galaxy contributing FIR flux in the tail of NGC 4330. Blue squares with errorbars are the observed fluxes with uncertainties. In orange are the modelled fluxes as predicted by the CIGALE fitting model (black line). The green dot identifies the extrapolated flux density at 250 μm. |
To summarise, on the basis of the photometric analysis of NGC 4330, NGC 4522, and NGC 4654, we measured a statistically significant Hα and FIR flux where HI data trace stripped tails of gas (Chung et al. 2009). Each of the stripped tails then comes with a measurement of the Hα, HI, and FIR 250 μm fluxes in the region extending beyond the optical disc (Table 2 lists the Hα, HI, and FIR fluxes as computed in this work). Thus, we can determine the dust and gas masses for the tails of stripped material and compute the corresponding dust-to-gas ratios. These are the goals of the next session.
Physical properties of the stripped gas and dust extending beyond the optical disc.
5. Dust-to-gas ratios
5.1. Dust and gas masses
For each tail region, the dust mass is obtained via the relation
 (1)
(1)
where S250 μm is the measured FIR flux density in Jy, D is the distance of the galaxy (assumed to be 16.5 Mpc for all galaxies), K250 μm = 4.00 cm2 g−1 is the dust grain opacity at λ = 250μm (Draine 2003), and B250 μm(T) is the Planck function for dust at temperature Td. It is clear that the value of the dust masses strongly depends on the dust temperature. While dust grains in nearby galaxies radiate with a typical temperature Td ∼ 20 K, temperature gradients have also been observed for nearby objects, with a radial decrease towards the outer parts of the galaxies (e.g. Galametz et al. 2012). We then decided to leave Td as a free parameter and trace the variation of dust-to-gas ratios for dust temperatures within the range of 10 ≤ Td ≤ 30 K.
Gas masses are computed via the relation
 (2)
(2)
where fH ≈ 0.74 is the standard fraction of neutral hydrogen gas with the rest consisting of He and a minor fraction of heavier elements, MH2 is the mass of molecular hydrogen, and MHI is the HI mass in solar units, derived from the HI flux as:
 (3)
(3)
with SHI the measured HI flux in Jy km s−1 and D is the same as in Eq. (1).
Our estimates of the total gas mass depend on the assumption of the fraction of molecular to neutral atomic gas. Thus, we carried out our analysis under two assumptions: (1) MH2/MHI = 1, that is the mean value observed in the local Universe within the main body of the galaxies (Boselli et al. 2014a; Cortese et al. 2016), and (2) MH2 = 0, that is to say there is no contribution by the neutral molecular gas phase. In particular, the second ansatz is based on the observation that the density of the molecular gas increases towards the galaxy’s centre (e.g. Lee et al. 2017; Casasola et al. 2017) and that only a few examples have been observed in which both the atomic and molecular gas phases are stripped off during the interaction (Vollmer et al. 2001, 2005, 2008; Jáchym et al. 2017; Cramer et al. 2020; Zabel et al. 2019). This topic is still under debate and will be one of the main analysis that will be carried out by the Virgo Environment Traced in CO (VERTICO) survey (Brown et al., in prep.). Finally, we do not consider the case of MH2/MHI > 1. As it would be the result of an in situ origin of the molecular gas in the stripped tails as a consequence of the condensation of neutral atomic gas (e.g. Verdugo et al. 2015; Moretti et al. 2018, 2020), it would yield bright clouds of molecular gas that have not been detected in previous surveys of our galaxy sample (only NGC 4522 shows extra-planar emission of molecular gas, with a molecular-to-neutral atomic gas ratio of ∼0.5 Vollmer et al. 2012; Chung & Kim 2014; Lee et al. 2017). Thus, gas masses estimated assuming MH2 = 0 may represent a lower limit of the real value, the latter likely lying in between the two cases that we consider. From the estimated dust and gas masses (see Table 2 for a list of the measured values), the dust-to-gas ratios in the case of MH2/MHI = 1 is 2.0 ± 0.6 × 10⁻³, 0.7 ± 0.1 × 10⁻³, and 0.4 ± 0.03 × 10⁻³ for NGC 4330, NGC 4522, and NGC 4654, respectively; they increase by a factor of two when no H2 contribution is considered. Their values as a function of the galaxy stellar mass and dust temperature are shown in Fig. 4 (left panel). It is clear that by adopting Td = 20 K the estimates are inconsistent by several standard deviations from the value of 10−2, which is typical of local late-type galaxies (e.g. Cortese et al. 2016). Even with no contribution from H2 molecules, the ratios are well below the value of reference for Td = 20 K, and colder dust temperatures would be required.
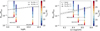 |
Fig. 4. Left: dust-to-gas mass ratios in the stripped tails of NGC 4430, NGC 4522, and NGC 4654 as a function of the galaxy stellar mass for several values of dust temperature (colour bar). Grey dots (grey triangles) represent the dust-to-gas mass ratio if the stripped dust has a temperature of T = 20 K and MH2/MHI = 1 (MH2/MHI = 0, i.e. no H2 contribution in the tails). The error bars are dominated by the uncertainties on the FIR flux estimates. The dash-dotted line shows the measured values of the dust-to-gas ratios as a function of mass as measured in Virgo galaxies (Cortese et al. 2016; we plotted the case with a varying CO-to-H2 conversion factor). Right: same as left panel, however this time the dust-to-gas ratios are a function of the mean galaxy metallicity. The arrow plots the relation as a function of the outer galaxy metallicity (see text for further details). The dash-dotted line traces the expected dust-to-gas ratio metallicity relation for local late type galaxies with the shaded area tracing one standard deviation in a given metallicity bin (Moustakas et al. 2010; Hughes et al. 2013). |
5.2. Dust-to-gas ratios versus metallicity relation
Several studies in the literature have shown that metallicity is the main property of a galaxy driving the observed dust-to-gas ratios. At high metallicities and down to 12 + log[O/H] ∼ 8.2, the relation between the dust-to-gas mass ratio versus metallicity is well represented by a single power law with a slope of −1 (James et al. 2002; Draine et al. 2007; Galliano et al. 2008; Moustakas et al. 2010; Leroy et al. 2011; Rémy-Ruyer et al. 2014; Casasola et al. 2020), with a standard deviation of the ratio, that is to say in a given metallicity bin, of ∼0.15 dex (Moustakas et al. 2010). For our objects, the metallicity values can be compiled from Hughes et al. (2013), who by using drift-scan optical spectroscopy, derived oxygen abundance estimates for a large sample of Virgo late-type galaxies and also compiled a stellar-mass metallicity relation. For NGC 4522 and NGC 4654, they report a mean metallicity of 12 + log[O/H] = 8.51 ± 0.48 and 8.65 ± 0.07, respectively. For NGC 4330, which is not in their sample, we estimated the mean metallicity using their mass metallicity relation and find, for a stellar mass of M* = 109.3 M⊙, a value of 12 + log[O/H] = 8.4 ± 0.1. These values are compatible with the oxygen abundance estimates derived in other studies (e.g. De Vis et al. 2019) and they are consistent with the mean metallicity value typical of Scd galaxies in general (Casasola et al. 2020).
Figure 4 (right panel) shows the dust-to-gas ratio - metallicity relation for the tails of our galaxies3. Vertical bars trace the range of dust-to-gas ratios obtained assuming different dust temperatures, 10 ≤ Td ≤ 30 K, (in the case of MH2/MHI = 1) and they are plotted against the mean galaxy metallicities. Grey dots (triangles) are representative of the ratios in the stripped tails with a dust component at Td = 20 K accounting (not accounting) for H2 molecules. Finally, the arrows point towards the values of the dust-to-gas ratios expected if this relation was plotted as a function of the outer galaxy metallicity. It is now well known that late-type galaxies are characterised by negative metallicity gradients towards their outskirts. Moustakas et al. (2010) and Magrini et al. (2011) analysed the variation with radius of oxygen abundances showing that galaxies with similar optical extensions and mean abundances (8.4 ≤ log[O/H] ≤ 8.7) as our sample of objects are characterised by negative metallicity gradients with a mean slope of −0.36 ± 0.06. Such a gradient means that, at the optical radius, our objects are ∼0.14 dex more metal poor than as implied by the mean metallicity value. Figure 4 may suggest a negative trend of the dust-to-gas ratio with metallicity. However, if confirmed on a statistical basis, it has important consequences on the physics of the ISM and on the formation of the cluster IC component. We develop these in what follows.
There are two considerations we can draw from Fig. 4. First, assuming that the dust-to-gas ratio metallicity relations are to be valid for baryons stripped from the main body of the galaxies, our estimates may follow the theoretical relations (dash-dotted lines) if the stripped dust is cold and emitting at different temperatures in the three galaxy tails, that is Td ≲ 20 K. Second, assuming similar dust temperatures for the different objects, our measurements show a decreasing trend in the dust-to-gas ratio for the stripped material, both with increasing stellar mass and metallicity. We shall comment on these two cases separately.
First, regarding the dust temperature, in Fig. 5, we plotted the fraction of 100 μm and 160 μm to 250 μm flux densities in the tails of our galaxies (downward pointing triangles). As pointed out in Sect. 4.1, we could only measure upper limits at these wavelengths, computed as 3 × σλ, where σλ is the uncertainty associated with the PACS measurements in the tail regions (see Table 2). These values are compared with the theoretical SED of dust grains emitting as a modified black body spectrum for different Td and dust emissivities β = 2.0−1.5 (coloured lines), which are shown to fit the observed flux density ratios of nearby late-type galaxies well (Boselli et al. 2012).
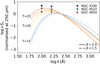 |
Fig. 5. Dust emission simulated using the modified blackbody law for 15 K (blue lines), 20 K (yellow lines), and 25 K (red lines) dust grains. The dust emission assuming a single spectral index of β = 2.0 (continuous lines) and β = 1.5 (dotted-dashed line) are also represented. The curves were normalised at 250 μm. The upper limits of the normalised flux densities at 100 μm and 160 μm measured in the tails of NGC 4330, NGC 4522, and NGC 4654 are shown as blue, green, and red downward pointing triangles, respectively. Dotted vertical lines identify 100 μm, 160 μm, and 250 μm. |
From Fig. 5 we can conclude that the dust in the tails of NGC 4330 and NGC 4522 is at Td ≲ 25 K and Td ≲ 20 K in the stripped component of NGC 4654. This information, once combined with previous studies showing that dust in nearby galaxies never reaches temperatures of Td < 15 K (e.g. Galametz et al. 2012), supports the idea that the dust, which is stripped from the outskirt of galaxies, is cold. However, even colder, nonphysical temperatures would be required to retrieve the dust-to-gas ratio-metallicity relation representative of the main body of the galaxies.
Second, in regards to the measured dust-to-gas-metallicity relation, we focused on how the dust and gas distributions vary within the main body of HI non-deficient galaxies4 as a function of the mean galaxy metallicity. To do so, we restricted our analysis to the galaxies of Sb, Sbc, Sc, and Scd morphological type, sampled by the Herschel and VIVA surveys, which are well resolved in the HI images (i.e. with a major axis larger than ten times the beam width) and characterised by HI-def < 0.35. This includes NGC 4294, NGC 4536, NGC 4651, and NGC 4654 with a mean metallicity of 8.5 ± 0.2, 8.7 ± 0.2, 8.75 ± 0.07, and 8.65 ± 0.07 (Hughes et al. 2013). Their 250 μm FIR disc diameters were computed as in Cortese et al. (2010a) and taken as the isophotal radii determined at the 6.7 × 10⁻⁵ Jy arcsec−2 surface brightness level, that is the average surface brightness observed at the optical radius of non HI-deficient Virgo galaxies. Extensions of HI discs were the HI isophotal diameters taken at a surface density level of 1 M⊙ pc−2 (Chung et al. 2009). In Fig. 6, we show the ratio of the FIR-to-HI disc diameters as a function of the metallicity for the four HI non-deficient galaxies. There is a strong correlation between the two variables, implying that in systems that have not been “disturbed” by the cluster environment yet, the more metal-rich the galaxy, the more centrally concentrated the disc of dust with respect to the disc of HI gas. This finding is supported by the general results that H2 discs are less extended than the neutral atomic component (e.g. Leroy et al. 2008), and it agrees well with previous studies showing that dust discs are more centrally concentrated with respect to the HI component in more early-type systems (Bendo et al. 2003; Thomas et al. 2004). Although the result would benefit from larger statistics, we can understand for physical reasons why the values and the decreasing trend in the dust-to-gas ratio we measure in the stripped tails may be the consequence of a dust component that is more strongly bound to the gravitational potential well of the galaxy with respect to the HI gas, thus not as easily removed in any kind of interaction, leading to a smaller dust-to-gas ratio in the tails of more metal rich systems. In Sect. 6.2.1 we also discuss whether the measured trend in the dust-to-gas ratio may come from different sputtering times characterising the dust during the stripping process.
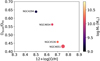 |
Fig. 6. Distribution of the ratios of the dust to HI disc diameters (circles) as a function of the mean galaxy metallicity for non HI-deficient galaxies in Virgo. Objects are colour-coded according to their stellar mass and their sizes are proportional to their HI deficient parameter: the larger the size the smaller the HI-def (Hughes et al. 2013). |
6. Discussions
6.1. Multi-phase gas coexistence in stripped tails
In Sect. 4 we have shown evidence of multi-phase gas stripping showing the coexistence of Hα and HI gas in the stripped tail of NGC 4330, NGC 4522, and NGC 4654, increasing the number of known Virgo galaxies with tails in both gas phases (the already known ones being NGC 4522, NGC 4438, and NGC 4330; Kenney et al. 2004; Oosterloo & van Gorkom 2005; Fossati et al. 2018). Several explanations have been given for the coexistence of both phases, mostly related with the interpretation of how the Hα emission is produced. In fact, filaments of ionised gas can be explained as being (i) gas shock-ionised by the galaxy’s AGN, (ii) gas heated by thermal conduction from the ICM, (iii) gas heated by turbulent shocks, or (iv) gas ionised due to the presence of recent star-formation.
A detailed analysis of NGC 4330, carried out as part of the VESTIGE initiative by Fossati et al. (2018), has shown that the Hα emission in the stripped region is partially due to photoionisation by UV radiation coming from a generation of young stars that formed in compact regions, and partially due to ionisation as a consequence of the interaction with the hot ICM. A similar interpretation can describe the cases of NGC 4522 and NGC 4654. In the areas where there are compact regions of Hα in the tails of NGC 4522, GALEX data shows that there is FUV emission closely following the ionised gas distribution. Alternatively, further north, where VESTIGE data have revealed the presence of filaments of ionised gas, we may speculate that there should be stripped HI gas, whose ionisation yields diffuse Hα emission although at a lower surface brightness levels than the VIVA survey sensitivity. FUV emission, which is well correlated with the HI surface density, overlaps with the less extended tail of ionised gas emission as well in the western region of NGC 4654. As emphasised in Sect. 4, the more extended and diffuse HI tail in the south-east region, which is also visible in the FUV, is not detected in Hα tracing the different timescales, which characterise the Hα and FUV emission (roughly a factor of 10 shorter for the Hα emission). Thus, when there is a lack of new stars that formed in compact regions, the presence of tails extending beyond the galaxy stellar disc (in our case ∼10 kpc away) leads us to speculate that the gas is mainly excited by mechanisms other than photoionisation. These could be shocks in the turbulent gas, magneto-hydrodynamic waves, and heat conduction. In fact, the presence of thin filamentary structures that can be observed along the tails suggests that magnetic fields might play an important role (see Boselli et al. 2016, for a detailed discussion).
We might also wonder whether, together with the ionised and atomic gas phases, additional gas components emitting at a different wavelength are also stripped. Studies of CO in NGC 4330, NGC 4522, and NGC 4654 have not revealed stripped tails of H2 gas, even though the inner molecular gas distributions are affected by the strong ICM pressure (Vollmer et al. 2012; Chung & Kim 2014; Lee et al. 2017). Outside our sample, molecular gas in the tail of stripped material has been detected in the Norma galaxy ESO 137−001 for which the authors suggest that the most likely scenario of H2 formation combines the removal of molecular gas that survived ram pressure stripping and the in situ formation out of stripped atomic gas (Jáchym et al. 2017). The latter scenario is also used to describe the presence of non-negligible molecular gas in the tails of several stripped galaxies at a redshift of z ∼ 0.05 (Moretti et al. 2018, 2020).
Therefore, within a typical environment with characteristics similar to those encountered in the Virgo cluster (ne ∼ 10−3 cm−3, T ∼ 107 K), the gas in the stripped component can either be hot and with a low density, or cold (T ∼ 10−100 K) and with a high density (ne ∼ 100 × 10−3 cm−3) (e.g. Vollmer et al. 2001). When the density of the gas is sufficiently high, new stars can be formed. On the other hand, if there is a dust component in the stripped tails, as we find in this work, it may act as a cooling agent for the gas (e.g. Hollenbach et al. 1971), favouring the formation of giant molecular clouds and star-forming regions within the stripped material. This may foster new episodes of star formation and contribute to the star-forming regions found to inhabit ram pressure stripped tails. To which extent star formation is a common phenomenon in ram-pressure stripped tails is still under debate (Hester et al. 2010; Fumagalli et al. 2011; Kenney et al. 2014; Boissier et al. 2012; Boselli et al. 2016; Fossati et al. 2016; Gullieuszik et al. 2017; Poggianti et al. 2019; Bianconi et al. 2020). One hint may come from the study by Steyrleithner et al. (2020) in which they found via numerical simulations of ram-pressure stripped dwarf galaxies that obviously high relative velocities with respect to the ICM are necessary to sufficiently dissolve massive clouds, which remain gravitationally bound and are capable of cooling, collapsing, and forming star clusters.
6.2. Dust stripping in Virgo
6.2.1. Stripped dust detected in emission
Since the dust in galaxies is associated with the gaseous component of the ISM, it is generally expected that when the gas is stripped, part of the dust is removed as well. Supporting this idea are the studies of the gas and dust content in cluster members, showing that systems approaching regions of high density are found to be redder and gas and dust deficient with respect to the population of galaxies in the field (Boselli et al. 2006, 2014b; Gavazzi et al. 2010; Cortese et al. 2012).
In this work we measure direct emission from cold dust that overlaps with the tails of ionised Hα and HI in NGC 4330, NGC 4522, and NGC 4654. From the analysis of Herschel FIR 250 μm and VIVA HI data, we also estimate in Sect. 5 that the dust is widespread within the stripped tails with a dust-to-gas ratio, Mdust/Mgas ∼ 10−3, that is significantly lower than the value found from the analysis of the main body of nearby galaxies when we assume a dust component emits at Td = 20 K. Temperature upper limits, which are set with the information retrieved from the 100 and 160 μm bands, confirm that the stripped dust must be cold (the strongest limit is for NGC 4654 with Td ≲ 20 K), yet not cold enough to make us retrieve the well known relation between the dust-to-gas mass ratio and metallicity. Using Herschel data at far-infrared and submillimetre wavelengths, Galametz et al. (2012) analysed a sub-sample of the KINGFISH galaxies (Kennicutt et al. 2011) and found the dust temperature varies spatially with a radial decrease towards the outskirts reaching minimum values of Td ∼ 15 K for them. Thus, cold dust in stripped tails fits well within the scenario that galaxies interacting with the cluster environment are stripped of their outermost regions, but it is yet not enough to explain the low dust-to-gas ratios that we measure.
By analysing trends in the dust-to-HI disc extension with metallicity for galaxies that have not been “disturbed” by the cluster environment yet (i.e. non HI defiecient), we find that decreasing with metallicity is the relative extension of dust-to-HI discs. This result implies a lower dust-to-gas ratio in the stripped material of more metal-rich galaxies simply because these systems have more centrally concentrated dust discs, which are more strongly bound, thus not as severely affected by the outside-in stripping of the ISM.
Nevertheless, it is worth noting that the retrieved estimates could be explained in terms of different physical factors. First, if dust emissivities were lower than the values measured for the Milky Way dust this would imply larger dust masses, hence higher dust-to-gas ratios. The studies by Davies et al. (2017) and Bianchi et al. (2019) are in support of this argument. Within the DustPedia project (Davies et al. 2017), these authors analysed the variation of dust emissivity for a sample of 204 spiral galaxies and observed that there is a variation in dust emission properties for spirals of an earlier type and higher metallicity, which is on average lower than the one measured for the Milky Way. Second, Ysard et al. (2019) show that dust masses may vary by a factor of up to 20 by assuming different grain properties (e.g. chemical composition). Finally, dust is expected to survive sputtering by the harsh X-ray emitting gas on a typical timescale of 1.4 Myr (Draine & Salpeter 1979). However, we may wonder whether dust grains can be more efficiently sputtered in the stripping process, leading to the observed low dust-to-gas ratios. Recent cosmological hydrodynamical simulations of cluster evolution that include dust production, growth, supernova-shock-driven destruction, ion-collision-driven thermal sputtering, and high-temperature dust cooling through far-infrared re-radiation of collisionally deposited electron energies have shown that the typical thermal sputtering time-scales can be as short as 10 Myr (Vogelsberger et al. 2019). However, such low time-scales are reached where the simulated ICM gas is hotter (4−7×) and denser (10−30×) than the cluster regions in which our galaxies reside (e.g. Urban et al. 2011). In addition, we also notice that shocks are unlikely to increase the sputtering rate of dust grains as shown by Popescu et al. (2000) who measured that already at 0.3 Mpc from the cluster centre, a sudden interaction of a Virgo-like galaxy with the cluster ICM would generally drive a shock wave with a typical speed well below the minimum value of ∼100 km s−1 needed for sputtering.
6.2.2. ICM metal enrichment by dust stripping
In galaxy clusters, a number of processes can remove metals from the hosting galaxies and transport them into the intra-cluster space. Previous works that studied the enrichment of the ICM have mainly focused on the following three mechanisms whereby metals could be removed from a galaxy: (1) metal-enriched gas can be removed as a consequence of a gravitational interaction and/or ram pressure stripping; (2) gas can escape the galaxy potential well as a result of the energy input from SN explosions; and (3) dust can be ejected in the ICM if the radiation pressure on dust grains due to stellar light may exceed the gravitational force of the matter (e.g. Aguirre et al. 2004). Also, at the cluster central region, AGN wind-driven mass-loss may be responsible for the ICM metal-enrichment (e.g Qiu et al. 2020).
Once the evidence we present in this study of dust that is stripped due to ram pressure is combined with previous results, supporting dust stripping by the tidal interactions (e.g. Cortese et al. 2010b; Gomez et al. 2010), little doubt is left that dust stripping is an additional mechanism for injecting dust grains into the ICM, thus contributing to its metal enrichment. Within the virial radius of Virgo and in the last 125 Myr, we expect that ram pressure stripping has contributed Md ≥ 0.4 × 10⁹ M⊙ to the intra-cluster dust (see next section). De Vis et al. (2019) show that galaxies with a metallicity above 12 + log[O/H] = 8.2 are characterised by a roughly constant dust-to-metal ratio of Md/MZ ∼ 0.2. Thus, within the central region of Virgo, ram pressure may contribute MZ ≥ 0.8 × 10⁸ M⊙ to the metals mass. This is consistent with numerical simulations which predict that ram pressure alone can already contribute ∼10% to the enrichment of the ICM in clusters (Domainko et al. 2006).
6.3. The building up of the Virgo intra-cluster component
In a hierarchical universe, the presence of an IC component (ICC), which is baryons free floating in the cluster potential, is a natural result since young concentrations of mass are actively in the process of forming. The Virgo IC stars, or IC light, have long been studied through their optical photometric and kinematic properties, showing that galaxy interactions, as well as tidal interactions between galaxies and the cluster potential, play an important role in the production of the ICL (e.g. Arnaboldi et al. 2002; Aguerri et al. 2005; Doherty et al. 2009; Longobardi et al. 2013, 2015, 2018a,b; Durrell et al. 2014; Hartke et al. 2017; Mihos et al. 2017). However, if ram-pressure actively strips gas and dust from the galaxies moving through the cluster (e.g Cortese et al. 2010b, 2012; Verdugo et al. 2015; Gullieuszik et al. 2020; Longobardi et al. 2020), it may become an additional key process that contributes to the build-up in the IC component. In a recent work, Longobardi et al. (2020) first detected a diffuse dust component in the ICM of Virgo with a mass of 2.5 ± 0.2 × 10⁹ M⊙ which is consistent with being the result of stripping phenomena happening out to a scale of 0.6 virial radii. We might then wonder whether the results presented in this work support this evidence.
NGC 4330, NGC 4522, and NGC 4654 lie at 0.6, 0.9, and 0.9 Mpc from the centre of the cluster, respectively. Despite their significant distance from the densest and hottest region of the Virgo ICM, ram pressure is actively moving dust and gas outside the main body of the galaxies. Previous works have shown that when no additional processes such as tidal stripping are in place (e.g. for NGC 4654), this is still possibly a consequence of the dynamical youth of the Virgo cluster causing local enhancements of the ram pressure due to bulk motions, clumpy density distributions, and variations in the temperature of the ICM gas (Kenney et al. 2004; Tonnesen et al. 2007). This allows stripping to be effective even in the outskirt of the cluster and supports the finding of a diffuse intra-cluster dust component out to large distances from the centre of the cluster (see Fig. 7).
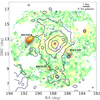 |
Fig. 7. Herschel FIR 250 μm images of NGC 4330, NGC 4522, and NGC 4654 (orange) overlaid on the mean extinction map of the Virgo intra-cluster dust (green and yellow trace mean values ⟨E(B − V)⟩ = 0 and ⟨E(B − V)⟩ = 0.07, respectively) by Longobardi et al. (2020, here the regions in space that are contaminated by background clusters are in grey). The three galaxies are magnified by a factor of ∼13 to show the details of the FIR emission. The extinction map shows that the intra-cluster dust is present within ∼1.2 Mpc (0.7 virial radii) around the dynamical centre of the cluster (sub-cluster A), as identified by the X-ray emission (Rosat contours from Böhringer et al. 1994). |
Furthermore, the stripped tails of NGC 4330, NGC 4522, and NGC 4654 extend beyond the optical discs of the galaxies and are going to be removed from the spirals to fill the intra-cluster space. More specifically, simulations of ram pressure stripping have shown that the ICM-galaxy interaction is marked by different phases (Roediger & Hensler 2005). An initial phase, in which the outer part of the gas disc is displaced, but only partially unbound, is followed by a second phase during which only a small fraction (about 10% of the initial gas mass) of the stripped gas falls back while the remaining fraction is unbound to the galactic potential. For galaxies moving through the Virgo cluster, feeling a ram pressure of pICM ≥ 1000 cm−3 km2 s−2, the second phase is expected to start after 20 Myr, lasting for 200 Myr. If we then assume that ram pressure equally affects all the ISM components, we can expect the stripped dust to be unbound on similar timescales and to become an intra-cluster component before it is destroyed by sputtering phenomena in the harsh X-ray environment after 140 Myr (Draine & Salpeter 1979). We now proceed to estimate the total amount of dust in the core of Virgo due to ram-pressure which is computed by accounting for the total gas mass expected to be lost by galaxies undergoing ram-pressure stripping and by re-scaling this value by the dust-to-gas mass ratio we found to characterise the stripped ram pressure tails.
Within the virial radius, Virgo contains 48 late-type galaxies with stellar masses of M* ≥ 109 M⊙ (Boselli et al. 2014b) and a large fraction of them (∼92%) have measured HI masses and HI deficiency parameters. These values allowed us to estimate the amount of atomic and total gas lost to be MHI = 0.1 × 10¹² M⊙ or Mgas = 0.3 × 10¹² M⊙6. For the remaining fraction of galaxies with no HI data (∼8%), we computed a similar estimate by converting the object stellar masses in HI masses using the scaling relation presented in Boselli et al. (2014a) and assuming an HI deficiency parameter equal to HI-def = 0.92, that is the mean value measured in Virgo A. An additional MHI = 0.02 × 10¹² M⊙ is lost resulting in a total gas component dispersed within the cluster virial radius of 0.05 × 10¹² M⊙. In Sect. 5 we show that the dust is widespread within the stripped tails with a typical dust-to-gas ratio of ∼10−3 (here we consider the mean value of the measured dust-to-gas ratios in the case of MH2/MHI = 1), implying that ∼0.4 × 10⁹ M⊙ of dust is stripped from the main body of the galaxies. If we now consider that the current Virgo accretion rate, for galaxies with M* > 109 M⊙, is ∼400 Gal Gyr−1 (Boselli et al. 2008; Gavazzi et al. 2013), we expect ∼50 galaxies in 125 Myr, which is roughly consistent with the dust survival time before sputtering happens. Thus ram pressure contributes to the diffuse ICD with a dust injection rate of ∼3.2 M⊙ yr−1. The mass estimate we computed above is a lower limit of the amount of dust expected in the IC space by stripping phenomena for the following reasons. First, we considered a mean value of the dust-to-gas ratio to convert gas masses in dust masses, while it is likely that different values must be considered for systems of different mass and metallicities. Second, we have not considered low mass galaxies (M* < 109 M⊙) for which dust stripping is more severe. Third, we have not considered the contribution from dust that formed in situ in ram-pressure stripped tails. Fourth, several processes may contribute to dust injection in the IC space, among which there are winds of red giant and supergiant IC stars that contribute to the ICD production, even though their contribution is small (dust injection rate of 0.17 M⊙ yr−1Popescu et al. 2000). Therefore, our results set the bases for follow-up studies which will benefit from the higher sensitivity of future missions and map the variation of the dust-to-gas ratio over a larger range of stellar masses.
7. Summary and conclusions
In this work we link the cluster-ICM-galaxy evolution at small scales, analysing the relative distribution and fraction in mass of the different baryonic components in the stripped ISM of galaxies that will build up the cluster intra-cluster component. Based on the synergy between VESTIGE Hα, Herschel FIR 250 μm, and VIVA HI data, we have measured the first direct emission from stripped dust that follows the tails of the ionised and atomic gas components. NGC 4330, NGC 4522, and NGC 4654 are the three Virgo galaxies targeted by our study. They are systems with stellar masses in the range of 109 ≲ M* ≲ 1010 M⊙ and all of them lie within the cluster virial radius. As such, their masses are consistent with the mass of the progenitors of the Virgo ICC (e.g. Longobardi et al. 2018b; Pillepich et al. 2018) and their projected distances relate them to the diffuse ICD emission, which was measured to be present within 4° from the cluster centre (Longobardi et al. 2020). More specifically, our results show the following:
-
NGC 4330, NGC 4522, and NGC 4654 are Virgo galaxies with multi-phase components in their tails of stripped material where cool dust and atomic HI gas overlap with an ionised, hotter, Hα emission. For NGC 4330 and NGC 4522, the ionised emission also shows the presence of narrow filaments which are consistent, given their morphology, with being supported by magnetic pressure. Future studies will address the question as to whether the presence of dust in the tails acts as gas cooler and a catalyzer of molecular clouds, giving us insight into the detection of star-formation processes in the stripped component.
-
We find that the stripped component is characterised by dust-to-gas mass ratios of ∼10−3, which is up to a factor of 15 lower than the values measured for the main body of the galaxies. Our analysis also suggests that the metallicity dependent trend is also opposite: The lowest values are associated with the most metal-rich systems.
-
The stripped dust must be cold for NGC 4330 and NGC 4522, Td ≲ 25 K, and even colder for NGC 4654, Td ≲ 20 K. Furthermore, the low values and negative trend we measured for the dust-to-gas ratio metallicity relation can be explained with a dust component that is more centrally concentrated in more metal-rich systems. These results fit well within the general picture that galaxies are mainly stripped of their outermost regions, which are also known to host colder dust with respect to the hotter, Td ∼ 20 K, component in the inner regions. However, further observations at different wavelengths and at higher resolutions are necessary to properly sample the FIR and submillimeter regime of the SEDs in the stripped tails and to better characterise the dust physical properties, such as the dust temperature and emissivity. The latter may also be responsible for a variation in the dust-to-gas ratios.
-
The detection of stripped tails of dust within 3° from the cluster centre is consistent with the recent finding of diffuse dust in the ICM of the Virgo cluster detected out to 1 Mpc. Moreover, under the assumption that ram pressure acts similarly on the dust and gas components, baryons will start being unbound from the galaxy a few tens of millions of years after the start of the stripping process. This time scale makes it possible for the dust to become a diffuse component in the ICM of Virgo before being destroyed as a consequence of sputtering phenomena, supporting results from simulations showing that the outer regions of dynamically young clusters, such as Virgo, have as source of intra-cluster grains from ongoing accretion of freshly infalling spiral galaxies (Popescu et al. 2000).
We thus conclude that ram pressure, together with tidal interactions, is a key ingredient for the build-up of the Virgo intra-cluster component. This work also highlights dust stripping by tidal interactions and ram pressure as one further mechanism for injecting dust grains into the ICM, thus contributing to its metal enrichment with a dust injection rate of ∼3.2 M⊙ yr−1.
Given the characteristics of the CFHT Hα filter (central wavelength λc = 6591 Å and a bandwidth of 106 Å), the VESTIGE data include [NII] line contribution.
Depending on the inclination of the galaxy, thus whether stripping happens mostly edge-on (NGC 4654) or face-on (NGC 4330, NGC 4522), and on the epoch of the stripping process (NGC 4522 is at a later stage with respect to NGC 4330 and NGC 4654), the mixing of the stripped gas component, thus its metallicity, differs from the mean galaxy value. The mean metallicity of NGC 4522, indeed, mostly traces the still existing inner disc only, while the outer discs of both NGC 4330 and NGC 4654 still exist. These, however, are second order effects well within the uncertainties of the metallicity values we consider.
The HI-def parameter, measured as the logarithmic difference between the expected and observed HI masses, can be used to quantify the degree of stripping that a galaxy is suffering from in the hostile cluster environment.
The typical dispersion of the HI-def parameter in isolated galaxies is 0.3, thus HI-def < 0.3 may identify unperturbed systems.
For the estimation of the total gas mass lost, we consider MH2/MHI = 1 and a neutral hydrogen gas fraction of 0.74.
Acknowledgments
We thank L. Cortese for providing us with the 250 μm isophotal radii of a sample of Virgo galaxies. We are grateful to the CFHT team who assisted us in the observations: T. Burdullis, D. Devost, B. Mahoney, N. Manset, A. Petric, S. Prunet, K. Withington. AL and AN have received funding from the French Centre National d’Etudes Spatiales (CNES), MF from the European Research Council (ERC) (grant agreement No 757535). This research has made use of data from HRS project. HRS is a Herschel Key Programme utilising Guaranteed Time from the SPIRE instrument team, ESAC scientists and a mission scientist. The HRS data was accessed through the Herschel Database in Marseille (HeDaM – http://hedam.lam.fr) operated by CeSAM and hosted by the Laboratoire d’Astrophysique de Marseille.
References
- Aguerri, J. A. L., Gerhard, O. E., Arnaboldi, M., et al. 2005, AJ, 129, 2585 [NASA ADS] [CrossRef] [Google Scholar]
- Aguirre, A., Schaye, J., Kim, T.-S., et al. 2004, ApJ, 602, 38 [NASA ADS] [CrossRef] [Google Scholar]
- Alam, S., Albareti, F. D., Allende Prieto, C., et al. 2015, ApJS, 219, 12 [NASA ADS] [CrossRef] [Google Scholar]
- Abramson, A., Kenney, J. D. P., Crowl, H. H., et al. 2011, AJ, 141, 164 [NASA ADS] [CrossRef] [Google Scholar]
- Abramson, A., Kenney, J., Crowl, H., et al. 2016, AJ, 152, 32 [NASA ADS] [CrossRef] [Google Scholar]
- Arnaboldi, M., Aguerri, J. A. L., Napolitano, N. R., et al. 2002, AJ, 123, 760 [NASA ADS] [CrossRef] [Google Scholar]
- Dobbels, W., Baes, M., Viaene, S., et al. 2020, A&A, 634, A57 [CrossRef] [EDP Sciences] [Google Scholar]
- Bendo, G. J., Joseph, R. D., Wells, M., et al. 2003, AJ, 125, 2361 [NASA ADS] [CrossRef] [Google Scholar]
- Bianchi, L. 2014, Ap&SS, 354, 103 [NASA ADS] [CrossRef] [Google Scholar]
- Bianchi, S., Casasola, V., Baes, M., et al. 2019, A&A, 631, A102 [NASA ADS] [CrossRef] [EDP Sciences] [Google Scholar]
- Bianconi, M., Smith, G. P., Haines, C. P., et al. 2020, MNRAS, 492, 4599 [CrossRef] [Google Scholar]
- Bellhouse, C., Jaffé, Y. L., McGee, S. L., et al. 2019, MNRAS, 485, 1157 [CrossRef] [Google Scholar]
- Binggeli, B., Tammann, G. A., & Sandage, A. 1987, AJ, 94, 251 [NASA ADS] [CrossRef] [Google Scholar]
- Blakeslee, J. P., Jordán, A., Mei, S., et al. 2009, ApJ, 694, 556 [NASA ADS] [CrossRef] [Google Scholar]
- Böhringer, H., Briel, U. G., Schwarz, R. A., et al. 1994, Nature, 368, 828 [NASA ADS] [CrossRef] [Google Scholar]
- Boissier, S., Boselli, A., Duc, P.-A., et al. 2012, A&A, 545, A142 [NASA ADS] [CrossRef] [EDP Sciences] [Google Scholar]
- Boquien, M., Buat, V., & Perret, V. 2014, A&A, 571, A72 [NASA ADS] [CrossRef] [EDP Sciences] [Google Scholar]
- Boquien, M., Burgarella, D., Roehlly, Y., et al. 2019, A&A, 622, A103 [NASA ADS] [CrossRef] [EDP Sciences] [Google Scholar]
- Boselli, A., & Gavazzi, G. 2006, PASP, 118, 517 [NASA ADS] [CrossRef] [Google Scholar]
- Boselli, A., & Gavazzi, G. 2014, A&ARv, 22, 7 [NASA ADS] [CrossRef] [Google Scholar]
- Boselli, A., Boissier, S., Cortese, L., et al. 2006, ApJ, 651, 811 [NASA ADS] [CrossRef] [Google Scholar]
- Boselli, A., Boissier, S., Cortese, L., et al. 2008, ApJ, 674, 742 [NASA ADS] [CrossRef] [Google Scholar]
- Boselli, A., Boissier, S., Cortese, L., et al. 2009, Astron. Nachr., 330, 904 [NASA ADS] [CrossRef] [Google Scholar]
- Boselli, A., Eales, S., Cortese, L., et al. 2010, PASP, 122, 261 [NASA ADS] [CrossRef] [Google Scholar]
- Boselli, A., Boissier, S., Heinis, S., et al. 2011, A&A, 528, A107 [NASA ADS] [CrossRef] [EDP Sciences] [Google Scholar]
- Boselli, A., Ciesla, L., Cortese, L., et al. 2012, A&A, 540, A54 [NASA ADS] [CrossRef] [EDP Sciences] [Google Scholar]
- Boselli, A., Cortese, L., Boquien, M., et al. 2014a, A&A, 564, A66 [NASA ADS] [CrossRef] [EDP Sciences] [Google Scholar]
- Boselli, A., Voyer, E., Boissier, S., et al. 2014b, A&A, 570, A69 [NASA ADS] [CrossRef] [EDP Sciences] [Google Scholar]
- Boselli, A., Cuillandre, J. C., Fossati, M., et al. 2016, A&A, 587, A68 [NASA ADS] [CrossRef] [EDP Sciences] [Google Scholar]
- Boselli, A., Fossati, M., Ferrarese, L., et al. 2018, A&A, 614, A56 [NASA ADS] [CrossRef] [EDP Sciences] [Google Scholar]
- Boselli, A., Fossati, M., Longobardi, A., et al. 2019, A&A, 623, A52 [NASA ADS] [CrossRef] [EDP Sciences] [Google Scholar]
- Boselli, A., Fossati, M., Longobardi, A., et al. 2020, A&A, 634, L1 [CrossRef] [EDP Sciences] [Google Scholar]
- Bruzual, G., & Charlot, S. 2003, MNRAS, 344, 1000 [NASA ADS] [CrossRef] [Google Scholar]
- Buat, V., Boquien, M., Małek, K., et al. 2018, A&A, 619, A135 [NASA ADS] [CrossRef] [EDP Sciences] [Google Scholar]
- Burgarella, D., Buat, V., & Iglesias-Páramo, J. 2005, MNRAS, 360, 1413 [NASA ADS] [CrossRef] [Google Scholar]
- Casasola, V., Cassarà, L. P., Bianchi, S., et al. 2017, A&A, 605, A18 [NASA ADS] [CrossRef] [EDP Sciences] [Google Scholar]
- Casasola, V., Bianchi, S., De Vis, P., et al. 2020, A&A, 633, A100 [NASA ADS] [CrossRef] [EDP Sciences] [Google Scholar]
- Charlot, S., & Fall, S. M. 2000, ApJ, 539, 718 [Google Scholar]
- Chung, E. J., & Kim, S. 2014, PASJ, 66, 11 [CrossRef] [Google Scholar]
- Chung, A., van Gorkom, J. H., Kenney, J. D. P., et al. 2007, ApJ, 659, L115 [NASA ADS] [CrossRef] [Google Scholar]
- Chung, A., van Gorkom, J. H., Kenney, J. D. P., et al. 2009, AJ, 138, 1741 [NASA ADS] [CrossRef] [Google Scholar]
- Ciesla, L., Boselli, A., Smith, M. W. L., et al. 2012, A&A, 543, A161 [NASA ADS] [CrossRef] [EDP Sciences] [Google Scholar]
- Cortese, L., Davies, J. I., Pohlen, M., et al. 2010a, A&A, 518, L49 [NASA ADS] [CrossRef] [EDP Sciences] [Google Scholar]
- Cortese, L., Bendo, G. J., Boselli, A., et al. 2010b, A&A, 518, L63 [NASA ADS] [CrossRef] [EDP Sciences] [Google Scholar]
- Cortese, L., Ciesla, L., Boselli, A., et al. 2012, A&A, 540, A52 [NASA ADS] [CrossRef] [EDP Sciences] [Google Scholar]
- Cortese, L., Fritz, J., Bianchi, S., et al. 2014, MNRAS, 440, 942 [NASA ADS] [CrossRef] [Google Scholar]
- Cortese, L., Bekki, K., Boselli, A., et al. 2016, MNRAS, 459, 3574 [NASA ADS] [CrossRef] [Google Scholar]
- Cramer, W. J., Kenney, J. D. P., Cortes, J. R., et al. 2020, ApJ, 901, 95 [CrossRef] [Google Scholar]
- Crowl, H. H., & Kenney, J. D. P. 2006, ApJ, 649, L75 [NASA ADS] [CrossRef] [Google Scholar]
- Davies, J. I., Baes, M., Bendo, G. J., et al. 2010, A&A, 518, L48 [NASA ADS] [CrossRef] [EDP Sciences] [Google Scholar]
- Davies, J. I., Baes, M., Bianchi, S., et al. 2017, PASP, 129, 044102 [NASA ADS] [CrossRef] [EDP Sciences] [Google Scholar]
- De Vis, P., Jones, A., Viaene, S., et al. 2019, A&A, 623, A5 [NASA ADS] [CrossRef] [EDP Sciences] [Google Scholar]
- Doherty, M., Arnaboldi, M., Das, P., et al. 2009, A&A, 502, 771 [NASA ADS] [CrossRef] [EDP Sciences] [Google Scholar]
- Domainko, W., Mair, M., Kapferer, W., et al. 2006, A&A, 452, 795 [NASA ADS] [CrossRef] [EDP Sciences] [Google Scholar]
- Draine, B. T. 2003, ApJ, 598, 1017 [NASA ADS] [CrossRef] [Google Scholar]
- Draine, B. T., & Salpeter, E. E. 1979, ApJ, 231, 438 [NASA ADS] [CrossRef] [Google Scholar]
- Draine, B. T., Dale, D. A., Bendo, G., et al. 2007, ApJ, 663, 866 [NASA ADS] [CrossRef] [Google Scholar]
- Draine, B. T., Aniano, G., Krause, O., et al. 2014, ApJ, 780, 172 [NASA ADS] [CrossRef] [Google Scholar]
- Durrell, P. R., Côté, P., Peng, E. W., et al. 2014, ApJ, 794, 103 [NASA ADS] [CrossRef] [Google Scholar]
- Fazio, G. G., Hora, J. L., Allen, L. E., et al. 2004, ApJS, 154, 10 [NASA ADS] [CrossRef] [Google Scholar]
- Ferrarese, L., Côté, P., Cuillandre, J.-C., et al. 2012, ApJS, 200, 4 [NASA ADS] [CrossRef] [Google Scholar]
- Fossati, M., Fumagalli, M., Boselli, A., et al. 2016, MNRAS, 455, 2028 [Google Scholar]
- Fossati, M., Mendel, J. T., Boselli, A., et al. 2018, A&A, 614, A57 [NASA ADS] [CrossRef] [EDP Sciences] [Google Scholar]
- Fumagalli, M., da Silva, R. L., & Krumholz, M. R. 2011, ApJ, 741, L26 [NASA ADS] [CrossRef] [Google Scholar]
- Galametz, M., Kennicutt, R. C., Albrecht, M., et al. 2012, MNRAS, 425, 763 [NASA ADS] [CrossRef] [Google Scholar]
- Galliano, F., Madden, S. C., Tielens, A. G. G. M., et al. 2008, ApJ, 679, 310 [NASA ADS] [CrossRef] [Google Scholar]
- Gavazzi, G., Boselli, A., Scodeggio, M., et al. 1999, MNRAS, 304, 595 [NASA ADS] [CrossRef] [Google Scholar]
- Gavazzi, G., Fumagalli, M., Cucciati, O., et al. 2010, A&A, 517, A73 [NASA ADS] [CrossRef] [EDP Sciences] [Google Scholar]
- Gavazzi, G., Fumagalli, M., Fossati, M., et al. 2013, A&A, 553, A89 [NASA ADS] [CrossRef] [EDP Sciences] [Google Scholar]
- Gomez, H. L., Baes, M., Cortese, L., et al. 2010, A&A, 518, L45 [NASA ADS] [CrossRef] [EDP Sciences] [Google Scholar]
- Griffin, M. J., Abergel, A., Abreu, A., et al. 2010, A&A, 518, L3 [EDP Sciences] [Google Scholar]
- Gullieuszik, M., Poggianti, B. M., Moretti, A., et al. 2017, ApJ, 846, 27 [NASA ADS] [CrossRef] [Google Scholar]
- Gullieuszik, M., Poggianti, B. M., McGee, S. L., et al. 2020, ApJ, 899, 13 [CrossRef] [Google Scholar]
- Gwyn, S. D. J. 2008, PASP, 120, 212 [NASA ADS] [CrossRef] [Google Scholar]
- Hartke, J., Arnaboldi, M., Longobardi, A., et al. 2017, A&A, 603, A104 [NASA ADS] [CrossRef] [EDP Sciences] [Google Scholar]
- Hester, J. A., Seibert, M., Neill, J. D., et al. 2010, ApJ, 716, L14 [Google Scholar]
- Hollenbach, D. J., Werner, M. W., & Salpeter, E. E. 1971, ApJ, 163, 165 [NASA ADS] [CrossRef] [Google Scholar]
- Hughes, T. M., Cortese, L., Boselli, A., et al. 2013, A&A, 550, A115 [NASA ADS] [CrossRef] [EDP Sciences] [Google Scholar]
- Jáchym, P., Sun, M., Kenney, J. D. P., et al. 2017, ApJ, 839, 114 [NASA ADS] [CrossRef] [Google Scholar]
- James, A., Dunne, L., Eales, S., et al. 2002, MNRAS, 335, 753 [NASA ADS] [CrossRef] [Google Scholar]
- Kenney, J. D. P., van Gorkom, J. H., & Vollmer, B. 2004, AJ, 127, 3361 [NASA ADS] [CrossRef] [Google Scholar]
- Kenney, J. D. P., Geha, M., Jáchym, P., et al. 2014, ApJ, 780, 119 [NASA ADS] [CrossRef] [Google Scholar]
- Kenney, J. D. P., Abramson, A., & Bravo-Alfaro, H. 2015, AJ, 150, 59 [NASA ADS] [CrossRef] [Google Scholar]
- Kennicutt, R. C., Calzetti, D., Aniano, G., et al. 2011, PASP, 123, 1347 [Google Scholar]
- Lee, B., Chung, A., Tonnesen, S., et al. 2017, MNRAS, 466, 1382 [NASA ADS] [CrossRef] [Google Scholar]
- Leroy, A. K., Walter, F., Brinks, E., et al. 2008, AJ, 136, 2782 [Google Scholar]
- Leroy, A. K., Bolatto, A., Gordon, K., et al. 2011, ApJ, 737, 12 [Google Scholar]
- Longobardi, A., Arnaboldi, M., Gerhard, O., et al. 2013, A&A, 558, A42 [NASA ADS] [CrossRef] [EDP Sciences] [Google Scholar]
- Longobardi, A., Arnaboldi, M., Gerhard, O., et al. 2015, A&A, 579, A135 [NASA ADS] [CrossRef] [EDP Sciences] [Google Scholar]
- Longobardi, A., Peng, E. W., Côté, P., et al. 2018a, ApJ, 864, 36 [NASA ADS] [CrossRef] [Google Scholar]
- Longobardi, A., Arnaboldi, M., Gerhard, O., et al. 2018b, A&A, 620, A111 [NASA ADS] [CrossRef] [EDP Sciences] [Google Scholar]
- Longobardi, A., Boselli, A., Boissier, S., et al. 2020, A&A, 633, L7 [CrossRef] [EDP Sciences] [Google Scholar]
- Magrini, L., Bianchi, S., Corbelli, E., et al. 2011, A&A, 535, A13 [NASA ADS] [CrossRef] [EDP Sciences] [Google Scholar]
- McLaughlin, D. E. 1999, ApJ, 512, L9 [NASA ADS] [CrossRef] [Google Scholar]
- Mei, S., Blakeslee, J. P., Côté, P., et al. 2007, ApJ, 655, 144 [NASA ADS] [CrossRef] [Google Scholar]
- Mihos, J. C., Harding, P., Feldmeier, J. J., et al. 2017, ApJ, 834, 16 [NASA ADS] [CrossRef] [Google Scholar]
- Moretti, A., Paladino, R., Poggianti, B. M., et al. 2018, MNRAS, 480, 2508 [Google Scholar]
- Moretti, A., Paladino, R., Poggianti, B. M., et al. 2020, ApJ, 889, 9 [CrossRef] [Google Scholar]
- Moustakas, J., Kennicutt, R. C., Tremonti, C. A., et al. 2010, ApJS, 190, 233 [NASA ADS] [CrossRef] [Google Scholar]
- Murante, G., Arnaboldi, M., Gerhard, O., et al. 2004, ApJ, 607, L83 [NASA ADS] [CrossRef] [Google Scholar]
- Napolitano, N. R., Pannella, M., Arnaboldi, M., et al. 2003, ApJ, 594, 172 [NASA ADS] [CrossRef] [Google Scholar]
- Noll, S., Burgarella, D., Giovannoli, E., et al. 2009, A&A, 507, 1793 [NASA ADS] [CrossRef] [EDP Sciences] [Google Scholar]
- Oosterloo, T., & van Gorkom, J. 2005, A&A, 437, L19 [NASA ADS] [CrossRef] [EDP Sciences] [Google Scholar]
- Pillepich, A., Nelson, D., Hernquist, L., et al. 2018, MNRAS, 475, 648 [NASA ADS] [CrossRef] [Google Scholar]
- Poggianti, B. M., Moretti, A., Gullieuszik, M., et al. 2017, ApJ, 844, 48 [Google Scholar]
- Poggianti, B. M., Gullieuszik, M., Tonnesen, S., et al. 2019, MNRAS, 482, 4466 [Google Scholar]
- Poglitsch, A., Waelkens, C., Geis, N., et al. 2010, A&A, 518, L2 [NASA ADS] [CrossRef] [EDP Sciences] [Google Scholar]
- Popescu, C. C., Tuffs, R. J., Fischera, J., et al. 2000, A&A, 354, 480 [Google Scholar]
- Qiu, Y., Bogdanović, T., Li, Y., et al. 2020, Nat. Astron., 4, 900 [CrossRef] [Google Scholar]
- Rémy-Ruyer, A., Madden, S. C., Galliano, F., et al. 2014, A&A, 563, A31 [NASA ADS] [CrossRef] [EDP Sciences] [Google Scholar]
- Rieke, G. H., Young, E. T., Engelbracht, C. W., et al. 2004, ApJS, 154, 25 [NASA ADS] [CrossRef] [Google Scholar]
- Roediger, E., & Hensler, G. 2005, A&A, 433, 875 [NASA ADS] [CrossRef] [EDP Sciences] [Google Scholar]
- Ruszkowski, M., Brüggen, M., Lee, D., et al. 2014, ApJ, 784, 75 [NASA ADS] [CrossRef] [Google Scholar]
- Sommer-Larsen, J., Romeo, A. D., & Portinari, L. 2005, MNRAS, 357, 478 [NASA ADS] [CrossRef] [Google Scholar]
- Steyrleithner, P., Hensler, G., & Boselli, A. 2020, MNRAS, 494, 1114 [CrossRef] [Google Scholar]
- Sun, M., Jones, C., Forman, W., et al. 2006, ApJ, 637, L81 [NASA ADS] [CrossRef] [Google Scholar]
- Thomas, H. C., Alexander, P., Clemens, M. S., et al. 2004, MNRAS, 351, 362 [NASA ADS] [CrossRef] [Google Scholar]
- Tonnesen, S., & Bryan, G. L. 2012, MNRAS, 422, 1609 [NASA ADS] [CrossRef] [Google Scholar]
- Tonnesen, S., & Stone, J. 2014, ApJ, 795, 148 [NASA ADS] [CrossRef] [Google Scholar]
- Tonnesen, S., Bryan, G. L., & van Gorkom, J. H. 2007, ApJ, 671, 1434 [NASA ADS] [CrossRef] [Google Scholar]
- Urban, O., Werner, N., Simionescu, A., et al. 2011, MNRAS, 414, 2101 [NASA ADS] [CrossRef] [Google Scholar]
- Verdugo, C., Combes, F., Dasyra, K., et al. 2015, A&A, 582, A6 [NASA ADS] [CrossRef] [EDP Sciences] [Google Scholar]
- Vogelsberger, M., McKinnon, R., O’Neil, S., et al. 2019, MNRAS, 487, 4870 [NASA ADS] [CrossRef] [Google Scholar]
- Vollmer, B. 2003, A&A, 398, 525 [NASA ADS] [CrossRef] [EDP Sciences] [Google Scholar]
- Vollmer, B., Braine, J., Balkowski, C., et al. 2001, A&A, 374, 824 [NASA ADS] [CrossRef] [EDP Sciences] [Google Scholar]
- Vollmer, B., Braine, J., Combes, F., et al. 2005, A&A, 441, 473 [NASA ADS] [CrossRef] [EDP Sciences] [Google Scholar]
- Vollmer, B., Soida, M., Otmianowska-Mazur, K., et al. 2006, A&A, 453, 883 [NASA ADS] [CrossRef] [EDP Sciences] [Google Scholar]
- Vollmer, B., Braine, J., Pappalardo, C., et al. 2008, A&A, 491, 455 [NASA ADS] [CrossRef] [EDP Sciences] [Google Scholar]
- Vollmer, B., Wong, O. I., Braine, J., et al. 2012, A&A, 543, A33 [NASA ADS] [CrossRef] [EDP Sciences] [Google Scholar]
- Vollmer, B., Soida, M., Beck, R., et al. 2020, A&A, 633, A144 [CrossRef] [EDP Sciences] [Google Scholar]
- Ysard, N., Koehler, M., Jimenez-Serra, I., et al. 2019, A&A, 631, A88 [NASA ADS] [CrossRef] [EDP Sciences] [Google Scholar]
- Zabel, N., Davis, T. A., Smith, M. W. L., et al. 2019, MNRAS, 483, 2251 [NASA ADS] [CrossRef] [Google Scholar]
Appendix A: CIGALE fitting
This appendix provides additional information on the FIR background contaminant in the tail of NGC 4330. In Table A.1 we list the main photometric properties of the identified background galaxy and the SED fitting results. The table lists the initial parameters adopted in the fitting.
Summary of the measured and derived quantities for the background galaxy in the tail of NGC 4330.
Input parameters used for the CIGALE SED fitting of the background galaxy in the tail of NGC 4330.
All Tables
Physical properties of the stripped gas and dust extending beyond the optical disc.
Summary of the measured and derived quantities for the background galaxy in the tail of NGC 4330.
Input parameters used for the CIGALE SED fitting of the background galaxy in the tail of NGC 4330.
All Figures
|
Fig. 1. g′-band, Hα, FIR 250 μm, and HI maps for the galaxies in our sample. The Hα and FIR 250 μm images were smoothed by a Gaussian kernel of 2.5″ and 12″, respectively. Tails of stripped material extending beyond the optical disc (dotted ellipse) are visible in the Hα, FIR 250 μm, and HI bands. White arrows indicate the wind direction (Vollmer 2003; Lee et al. 2017). The red cross in the g′-band image of NGC 4330 identifies the background contaminant (see text). North is up; east is to the left. |
| In the text | |
|
Fig. 2. Smoothed Hα VESTIGE images of NGC 4330 (top), NGC 4522 (centre), and NGC 4654 (bottom) compared with the GALEX FUV emission (magenta contours), SPIRE 250 μm emission (red contours), and VIVA HI emission (blue contours). The faintest emissions from the SPIRE 250 μm data are at surface brightness levels of 0.6 MJy sr−1, while the HI contour levels reach column densities values of ΣHI = 2 × 1019 cm−2. Dotted black ellipses trace the extensions of the galaxies’ optical discs. The regions of the tails outside the optical disc are considered for our photometric analysis (red dotted contours). Linear scales and synthesised beam sizes are shown in the bottom-left and bottom-right corners, respectively. |
| In the text | |
|
Fig. 3. SED of the background galaxy contributing FIR flux in the tail of NGC 4330. Blue squares with errorbars are the observed fluxes with uncertainties. In orange are the modelled fluxes as predicted by the CIGALE fitting model (black line). The green dot identifies the extrapolated flux density at 250 μm. |
| In the text | |
|
Fig. 4. Left: dust-to-gas mass ratios in the stripped tails of NGC 4430, NGC 4522, and NGC 4654 as a function of the galaxy stellar mass for several values of dust temperature (colour bar). Grey dots (grey triangles) represent the dust-to-gas mass ratio if the stripped dust has a temperature of T = 20 K and MH2/MHI = 1 (MH2/MHI = 0, i.e. no H2 contribution in the tails). The error bars are dominated by the uncertainties on the FIR flux estimates. The dash-dotted line shows the measured values of the dust-to-gas ratios as a function of mass as measured in Virgo galaxies (Cortese et al. 2016; we plotted the case with a varying CO-to-H2 conversion factor). Right: same as left panel, however this time the dust-to-gas ratios are a function of the mean galaxy metallicity. The arrow plots the relation as a function of the outer galaxy metallicity (see text for further details). The dash-dotted line traces the expected dust-to-gas ratio metallicity relation for local late type galaxies with the shaded area tracing one standard deviation in a given metallicity bin (Moustakas et al. 2010; Hughes et al. 2013). |
| In the text | |
|
Fig. 5. Dust emission simulated using the modified blackbody law for 15 K (blue lines), 20 K (yellow lines), and 25 K (red lines) dust grains. The dust emission assuming a single spectral index of β = 2.0 (continuous lines) and β = 1.5 (dotted-dashed line) are also represented. The curves were normalised at 250 μm. The upper limits of the normalised flux densities at 100 μm and 160 μm measured in the tails of NGC 4330, NGC 4522, and NGC 4654 are shown as blue, green, and red downward pointing triangles, respectively. Dotted vertical lines identify 100 μm, 160 μm, and 250 μm. |
| In the text | |
|
Fig. 6. Distribution of the ratios of the dust to HI disc diameters (circles) as a function of the mean galaxy metallicity for non HI-deficient galaxies in Virgo. Objects are colour-coded according to their stellar mass and their sizes are proportional to their HI deficient parameter: the larger the size the smaller the HI-def (Hughes et al. 2013). |
| In the text | |
|
Fig. 7. Herschel FIR 250 μm images of NGC 4330, NGC 4522, and NGC 4654 (orange) overlaid on the mean extinction map of the Virgo intra-cluster dust (green and yellow trace mean values ⟨E(B − V)⟩ = 0 and ⟨E(B − V)⟩ = 0.07, respectively) by Longobardi et al. (2020, here the regions in space that are contaminated by background clusters are in grey). The three galaxies are magnified by a factor of ∼13 to show the details of the FIR emission. The extinction map shows that the intra-cluster dust is present within ∼1.2 Mpc (0.7 virial radii) around the dynamical centre of the cluster (sub-cluster A), as identified by the X-ray emission (Rosat contours from Böhringer et al. 1994). |
| In the text | |
Current usage metrics show cumulative count of Article Views (full-text article views including HTML views, PDF and ePub downloads, according to the available data) and Abstracts Views on Vision4Press platform.
Data correspond to usage on the plateform after 2015. The current usage metrics is available 48-96 hours after online publication and is updated daily on week days.
Initial download of the metrics may take a while.