Fig. 7.
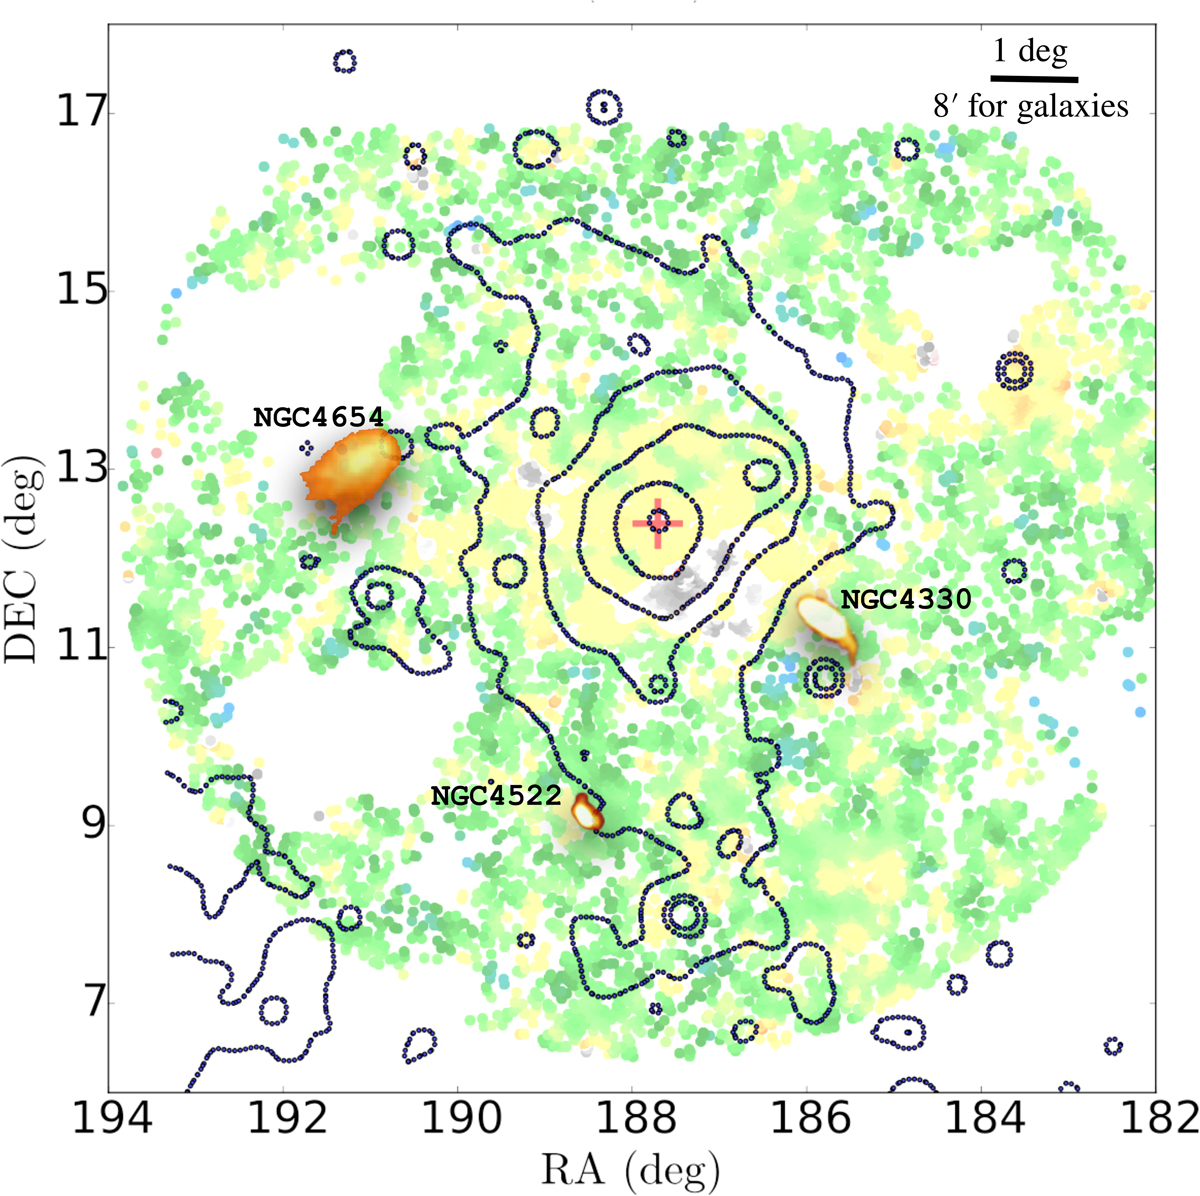
Herschel FIR 250 μm images of NGC 4330, NGC 4522, and NGC 4654 (orange) overlaid on the mean extinction map of the Virgo intra-cluster dust (green and yellow trace mean values ⟨E(B − V)⟩ = 0 and ⟨E(B − V)⟩ = 0.07, respectively) by Longobardi et al. (2020, here the regions in space that are contaminated by background clusters are in grey). The three galaxies are magnified by a factor of ∼13 to show the details of the FIR emission. The extinction map shows that the intra-cluster dust is present within ∼1.2 Mpc (0.7 virial radii) around the dynamical centre of the cluster (sub-cluster A), as identified by the X-ray emission (Rosat contours from Böhringer et al. 1994).
Current usage metrics show cumulative count of Article Views (full-text article views including HTML views, PDF and ePub downloads, according to the available data) and Abstracts Views on Vision4Press platform.
Data correspond to usage on the plateform after 2015. The current usage metrics is available 48-96 hours after online publication and is updated daily on week days.
Initial download of the metrics may take a while.