Fig. 1.
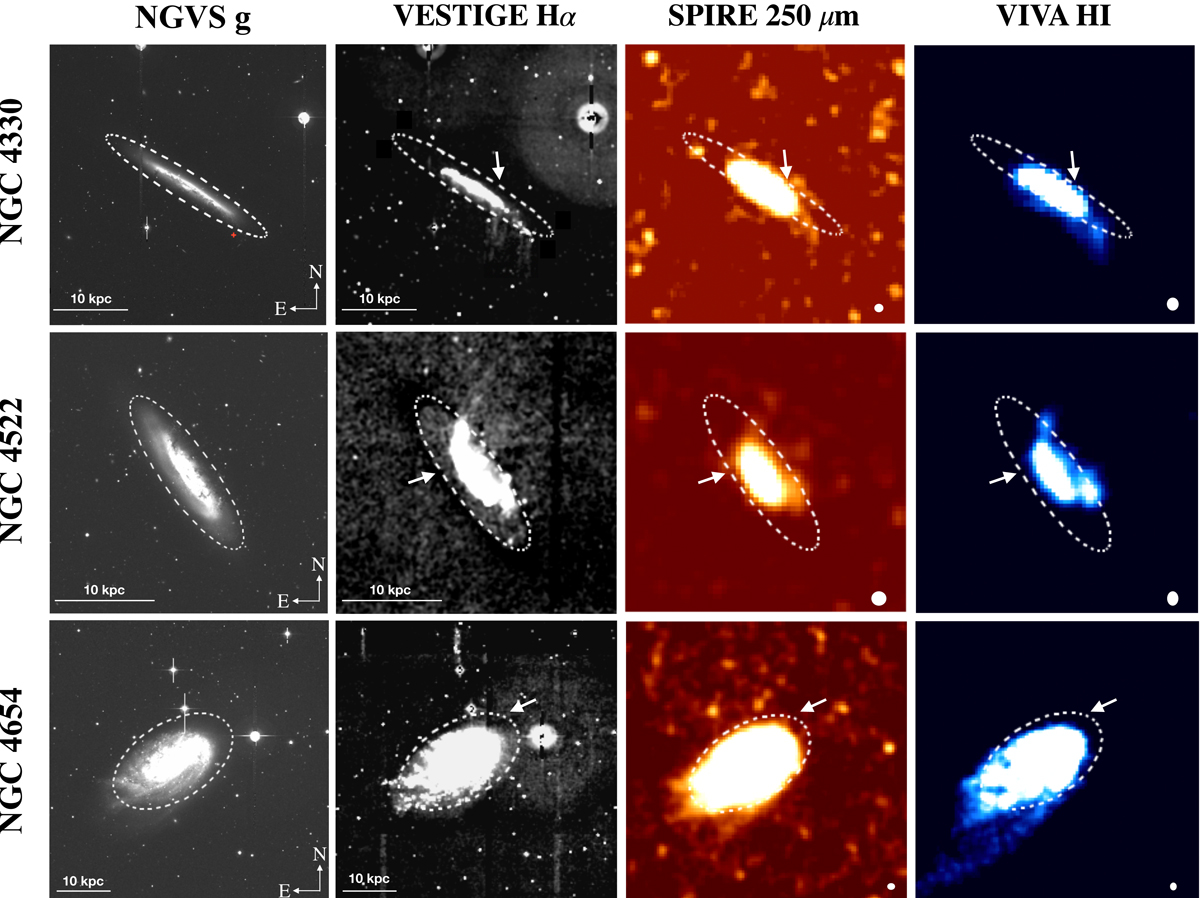
g′-band, Hα, FIR 250 μm, and HI maps for the galaxies in our sample. The Hα and FIR 250 μm images were smoothed by a Gaussian kernel of 2.5″ and 12″, respectively. Tails of stripped material extending beyond the optical disc (dotted ellipse) are visible in the Hα, FIR 250 μm, and HI bands. White arrows indicate the wind direction (Vollmer 2003; Lee et al. 2017). The red cross in the g′-band image of NGC 4330 identifies the background contaminant (see text). North is up; east is to the left.
Current usage metrics show cumulative count of Article Views (full-text article views including HTML views, PDF and ePub downloads, according to the available data) and Abstracts Views on Vision4Press platform.
Data correspond to usage on the plateform after 2015. The current usage metrics is available 48-96 hours after online publication and is updated daily on week days.
Initial download of the metrics may take a while.