Open Access
Fig. 3.
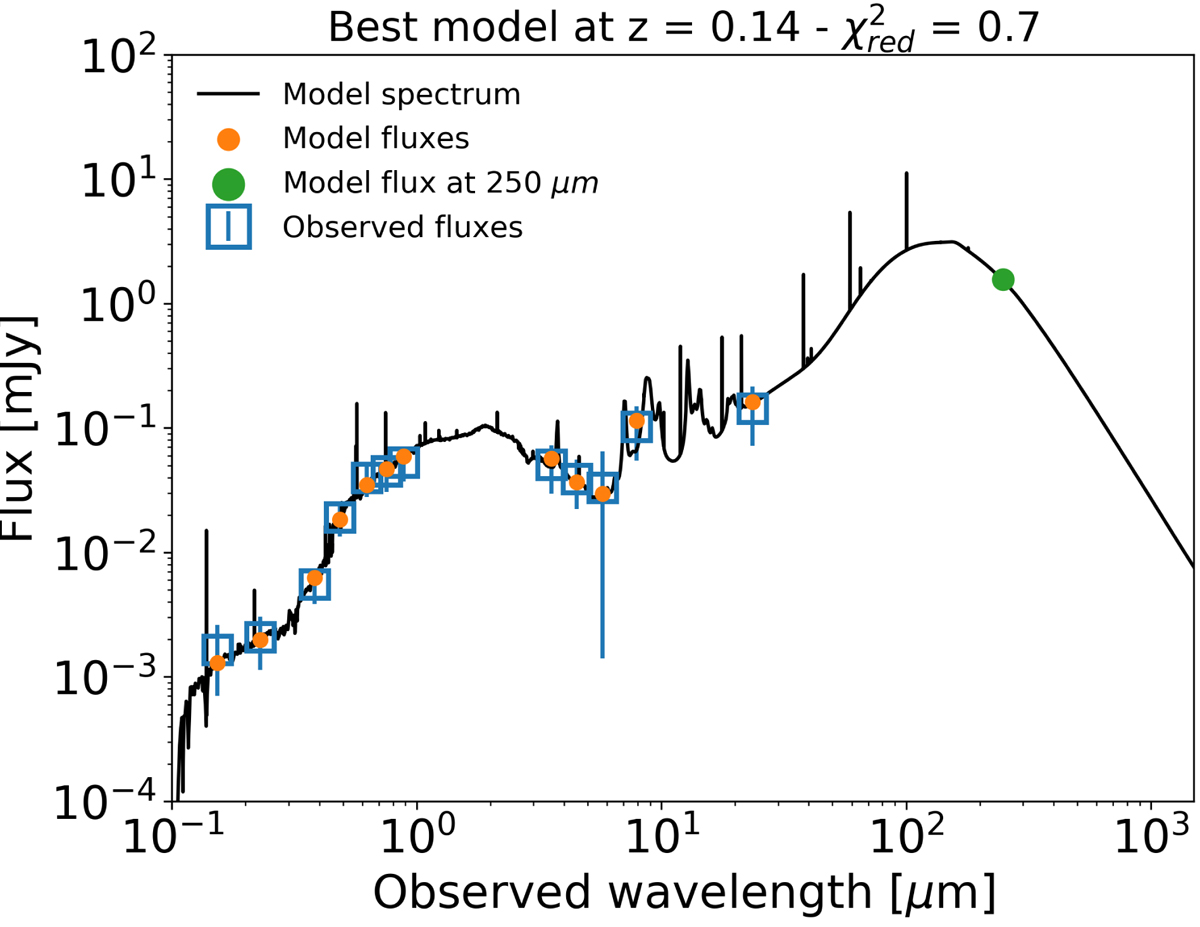
SED of the background galaxy contributing FIR flux in the tail of NGC 4330. Blue squares with errorbars are the observed fluxes with uncertainties. In orange are the modelled fluxes as predicted by the CIGALE fitting model (black line). The green dot identifies the extrapolated flux density at 250 μm.
Current usage metrics show cumulative count of Article Views (full-text article views including HTML views, PDF and ePub downloads, according to the available data) and Abstracts Views on Vision4Press platform.
Data correspond to usage on the plateform after 2015. The current usage metrics is available 48-96 hours after online publication and is updated daily on week days.
Initial download of the metrics may take a while.