Fig. 4.
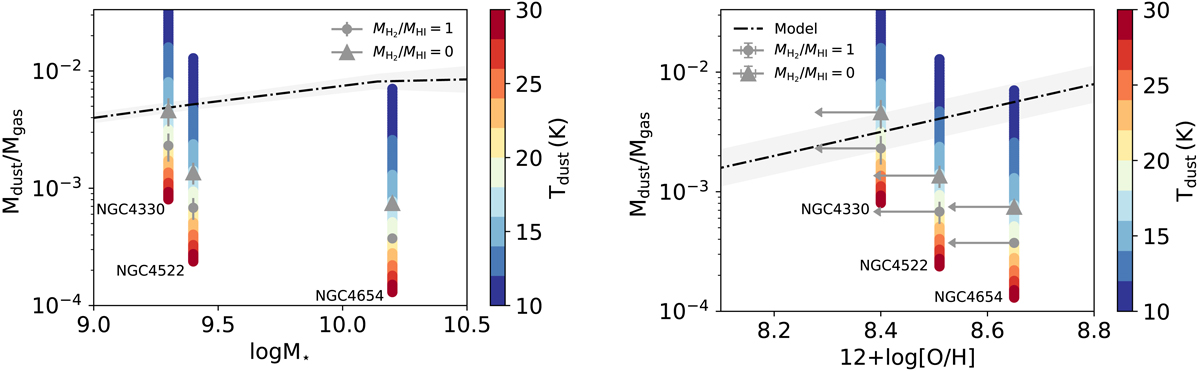
Left: dust-to-gas mass ratios in the stripped tails of NGC 4430, NGC 4522, and NGC 4654 as a function of the galaxy stellar mass for several values of dust temperature (colour bar). Grey dots (grey triangles) represent the dust-to-gas mass ratio if the stripped dust has a temperature of T = 20 K and MH2/MHI = 1 (MH2/MHI = 0, i.e. no H2 contribution in the tails). The error bars are dominated by the uncertainties on the FIR flux estimates. The dash-dotted line shows the measured values of the dust-to-gas ratios as a function of mass as measured in Virgo galaxies (Cortese et al. 2016; we plotted the case with a varying CO-to-H2 conversion factor). Right: same as left panel, however this time the dust-to-gas ratios are a function of the mean galaxy metallicity. The arrow plots the relation as a function of the outer galaxy metallicity (see text for further details). The dash-dotted line traces the expected dust-to-gas ratio metallicity relation for local late type galaxies with the shaded area tracing one standard deviation in a given metallicity bin (Moustakas et al. 2010; Hughes et al. 2013).
Current usage metrics show cumulative count of Article Views (full-text article views including HTML views, PDF and ePub downloads, according to the available data) and Abstracts Views on Vision4Press platform.
Data correspond to usage on the plateform after 2015. The current usage metrics is available 48-96 hours after online publication and is updated daily on week days.
Initial download of the metrics may take a while.