| Issue |
A&A
Volume 643, November 2020
|
|
|---|---|---|
| Article Number | A176 | |
| Number of page(s) | 28 | |
| Section | Extragalactic astronomy | |
| DOI | https://doi.org/10.1051/0004-6361/202038996 | |
| Published online | 20 November 2020 | |
Dorado and its member galaxies
Hα imaging of the group backbone⋆
1
INAF-Osservatorio Astrofisico di Asiago, Via dell’Osservatorio 8, 36012 Asiago, Italy
e-mail: This email address is being protected from spambots. You need JavaScript enabled to view it.
2
INAF-Osservatorio Astronomico di Padova, Vicolo dell’Osservatorio 5, 35122 Padova, Italy
3
Department of Physics and Astronomy “G. Galilei”, University of Padova, Vicolo dell’Osservatorio 3, 35122 Padova, Italy
4
Las Campanas Observatory, Carnegie Institution of Washington, Colina El Pino Casilla 601, La Serena, Chile
5
Departamento de Astronomía, Universidad de Chile, Camino del Observatorio 1515, Las Condes, Santiago, Chile
6
Dept. of Physics & Astronomy, The Johns Hopkins University, 3400 N. Charles St., Baltimore, MD 21218, USA
7
INAF-Osservatorio Astronomico di Capodimonte, Salita Moiariello 16, 80131 Napoli, Italy
8
Laboratório de Astrofísica Teórica e Observacional, Universidade Estadual de Santa Cruz, 45650-000 Ilhéus, BA, Brasil
9
University of Calgary, 2500 University, Drive NW, Calgary, Alberta, Canada
Received:
22
July
2020
Accepted:
29
September
2020
Abstract
Context. Dorado is a nearby, rich and clumpy galaxy group that extends for several degrees in the southern hemisphere. Although several studies have been dedicated to defining its members, their kinematics, and the hot and cold gas content, in particular H I, their present star formation activity remains unknown.
Aims. For the first time, we map the Hα distribution as a possible indicator of the star formation activity of Dorado members, a large fraction of which show interaction and merging signatures independently of their morphological type.
Methods. With the 2.5 m du Pont and the 1m Swope telescopes, we obtained narrow-band calibrated images of 14 galaxies that form the backbone of the group, mapping Hα+[N II] down to a few 10−17 erg cm−2 s−1 arcsec−2. We estimated the galaxy star formation rate from the Hα fluxes and corrected for Galaxy foreground extinction and [N II] contamination.
Results. We detected Hα+[N II] emission in all galaxies. H II regions clearly emerge in late-type galaxies, while in early-type galaxies the Hα+[N II] emission is dominated by [N II], especially in the central regions. However, H II complexes are revealed in four early-type galaxies. Even in the compact group SGC 0414-5559, in the projected centre of Dorado, H II regions are found both throughout the late-type galaxies and in the very outskirts of early-type members. Considering the Dorado group as a whole, we notice that the Hα+[N II] equivalent width, a measure of the specific star formation, increases with morphological type from early- to late-type members, although it remains lower than that observed in similar surveys of spiral galaxies. The star formation rate of the spiral members is in the range of what is observed in similar galaxies surveys (James et al., 2004). However, in three spiral galaxies, NGC 1536, PGC 75125, and IC 2058, the star formation rate is well below the median for their morphological classes. Conversely, the star formation rate of some early-type members tends to be higher than the average derived from Hα+[N II] surveys of this morphological family.
Conclusions. We detected Hα+[N II] in all the early-type galaxies observed and half of them show H II regions in well-shaped rings as well as in their outskirts. These findings suggest that early-type galaxies in this group are not dead galaxies: their star formation has not yet shut down. Mechanisms such as gas stripping and gas accretion through galaxy–galaxy interaction seem relevant in modifying star formation in this evolutionary phase of Dorado.
Key words: galaxies: elliptical and lenticular, cD / galaxies: spiral / galaxies: ISM / galaxies: interactions / galaxies: evolution
Data set are only available at the CDS via anonymous ftp to cdsarc.u-strasbg.fr (130.79.128.5) or via http://cdsarc.u-strasbg.fr/viz-bin/cat/J/A+A/643/A176
© ESO 2020
1. Introduction
Driven by gravitation, groups and their member galaxies co-evolve. During group evolution, the properties of galaxies are significantly transformed, as we are starting to learn from colour-magnitude diagrams (CMDs) which provide a colour snapshot of this process (Balogh et al. 2004; Baldry et al. 2004; Schawinski et al. 2007; Kaviraj et al. 2007). In CMDs, blue versus red galaxy populations trace the transition from an active to a more evolved or even passive phase (Marino et al. 2010, 2013, 2016; Rampazzo et al. 2018). Member galaxies modify both their star formation rate and morphology, from star forming late-type galaxies (LTGs) to early-type (ETGs; i.e. ellipticals and S0 galaxies (S0s)), quenching their star formation (Mazzei et al. 2014b). Several physical mechanisms are believed to play a role in this galaxy transformation, according to the richness of the surrounding environment (see e.g. Boselli & Gavazzi 2006, 2014). As velocity dispersions of galaxies in groups are comparable to the velocity dispersion of stars in individual galaxies, both interactions and merging mechanisms are more favored in groups than in clusters (Mamon 1992). Mergers can transform LTGs into ETGs, that is both S0s and ellipticals (see e.g. Toomre & Toomre 1972; Barnes 2002; Mazzei et al. 2014a, 2019) and quench star formation (SF) by ejecting the interstellar medium via starburst-, AGN-, or shock-driven winds (see e.g. Di Matteo 2015, and references therein).
Tal et al. (2009) presented a deep imaging study – reaching μV = 27.7 mag arcsec−2 – of a complete sample of luminous ETGs (MB < −20) at distances of 15–50 Mpc selected from the Tully (1988) catalogue of nearby galaxies. Tal et al. find that 73% of them show tidal disturbance signatures in their stellar bodies. Concerning the relation between gravitational interaction signatures and the galaxy environment, these latter authors find that galaxies in clusters are less perturbed than group and field galaxies. Tal et al. (2009) concluded that ETGs in groups and low-density environments continue to grow at the present day through mostly dry mergers involving little star formation. More recently, Rampazzo et al. (2020) found that ≈60% of isolated ETGs display shell structures, an unambiguous merging signature, extending the view of intense galaxy transformation to very low-density environments.
In LTGs, the Hα flux is directly connected to the star formation (SF) but this is not the case for ETGs. When Hα started to be widely detected in the central regions of ETGs using both spectroscopy (Heckman 1980; Phillips et al. 1986) and imaging (Goudfrooij et al. 1994b,a), several mechanisms were suggested to be at the origin of the emission in these galaxies, which are considered “red and dead”. The Hα extended emission was thought to be connected with the hot gas phase giving rise to the strong X-ray emission in ETGs (see e.g. Trinchieri et al. 1997, and references therein). The nuclei of most ETGs show low- ionisation nuclear emission region (LINER) properties, which could explain the Hα emission in the central regions. The role of post asymptotic giant branch (PAGB) stars has also been emphasised in cases where the emission is more extended (see e.g. Annibali et al. 2010). Both GALEX (Jeong et al. 2009; Marino et al. 2011a) and Spitzer (see e.g. Panuzzo et al. 2007, 2011; Vega et al. 2010; Rampazzo et al. 2013, and references therein) observations have increasingly demonstrated that SF can also be found in ETGs and can be at the origin of the Hα emission both in the centre and in the outer regions, often characterised by resonance rings. ETGs have been shown to often be the fuel of the SF (see e.g. Serra et al. 2012, and references), a phenomenon also often revealed in H I. Recently, a Hα survey of 147 ETGs, out of 260 in the ATLAS3D sample, was performed by Gavazzi et al. (2018), with 92 ETGs being undetected. These 147 are gas-free systems that lack a disc and exhibit passive spectra, even in their nuclei. Most (76%) of the remaining 55 ETGs from this sample are strong Hα emitters and were found to be associated with low-mass (M * ≈1010 M⊙) S0 galaxies, showing conspicuous gas (H I + H2) content, extended stellar discs, and SF also in their nuclei.
In the above context, the study of the Dorado group offers the possibility to investigate accretion and merging events from the perspective of gas content. Dorado is a H I rich group, with a total H I mass of 3.5 × 10¹⁰ M⊙, nearly half of which is concentrated in the spiral member NGC 1566 (Kilborn et al. 2005, 2009). These latter studies detected 13 galaxies including ETGs (NGC 1533, NGC 1543, NGC 1596). In addition, the H I distribution offers an indication of the strong interaction between Dorado members, which may re-fuel gas-poor systems such as ETGs. Ryan-Weber et al. (2003) revealed a vast system of H I around NGC 1533 with a tail connecting the galaxy to the IC2038/IC 2039 pair located several kiloparsecs away. Indeed, irrespective of their morphological classification, Dorado members show a significant fraction of galaxies, from the centre to the group periphery, showing either galaxy–galaxy interaction or merging signatures.
The UV–optical Dorado CMD (see Fig. 1 in Cattapan et al. 2019) is composed of both a red sequence, including several ETGs, and a green valley populated by numerous intermediate-luminosity galaxy members. Only NGC 1566, a bright “grand-design” spiral, is still located in the Blue Cloud. Therefore, with respect to the rich NGC 5486 group (Marino et al. 2016), Dorado is in an earlier and more active evolutionary phase (see Sect. 2) and offers a possibility to investigate the evolutionary mechanisms in action. Our study with GALEX of the early-type members, NGC 1533 and NGC 1543 (Marino et al. 2011b; Rampazzo et al. 2017), provide direct evidence of the presence of SF. Mazzei et al. (2014a,b) used smoothed particle hydrodynamic (SPH) simulations with chemo-photometric implementation to successfully reproduce the morphological, kinematical, and spectral energy distributions of two members of the Dorado group, NGC 1533 and NGC 1543, as a merger by-product (Mazzei et al. 2019).
The present work is motivated by indications of SF and dissipation events reported for Dorado members in the current literature. In this paper we aim to investigate the SF of the Dorado members, both early- and late-type galaxies, via Hα+[N II] narrow-band imaging observations. Several studies used Hα fluxes as an indicator of SF and calibrated the relation (see the review Kennicutt 1998). As a reference, we mention the Hα surveys of LTGs by James et al. (2004) and Kennicutt et al. (2009). James et al. (2004) found a strong correlation between total star formation rate (SFR) and Hubble type. The strongest SFR is found in isolated galaxies and occurs in Sc and Sbc types. The Dorado group was not included in the Kennicutt et al. (2008) study of the local volume. However, some Hα studies have been dedicated to NGC 1566, the brightest spiral member. Its Hα total luminosity, LHα, was obtained by Hoopes et al. (2001) and Kennicutt et al. (2009). Roy & Walsh (1986) studied the Hα emission in the outer NW arm of the galaxy. Uncalibrated Hα observations of IC 2058, an edge-on spiral spiral member, were performed by Rossa & Dettmar (2003) with the aim of studying the Hα extra-planar distribution. Trinchieri et al. (1997) obtained a deep Hα+[N II] image of NGC 1553, the brightest among ETGs in the group.
Our work is based on Hα+[N II] images obtained at the Irénée du Pont 2.5 m and Henrietta Swope 1 m telescopes at Las Campanas Observatory (Chile). The paper is organised as follows. In Sect. 2 we describe the Dorado group and suggest it is still undergoing a strong transition phase. Appendix A provides the member list adapted from the dynamical studies of Kourkchi & Tully (2017) and Firth et al. (2006). In Sect. 3 we present Hα+[N II] observations and the reduction performed. The analysis of the Hα+[N II] data is presented in Sect. 4. In Sect. 5 we discuss the morphology of the Hα+[N II] emission in each individual galaxy. A comparison of our results with the literature is provided in Appendix B. The SFR is discussed as a function of member morphological type. In the context of group evolution, Sect. 6 discusses the SFR in the group substructures.
2. Dorado group: an overview
Before presenting our observations we describe the structure of the group, also discussing the membership of the galaxies that form its backbone, namely our targets.
The Dorado group (RA = 64.3718 [deg], Dec = −55.7811 [deg]) extends for several degrees in the southern hemisphere (see e.g. Firth et al. 2006; Kourkchi & Tully 2017, and reference therein; Fig. 1). In this paper we assume that members are at the group distance of 17.69 Mpc (Kourkchi & Tully 2017). The group includes both bright ETGs and LTGs. Its structure is quite loose and clumpy, meaning that the two giant galaxies NGC 1566, a grand-design spiral, and NGC 1553, an S0 galaxy, have been considered as the centres of two homonymous but independent groups. In this sense, different member lists have been compiled with different selection criteria. The NGC 1566 group is composed of 18 member galaxies according to Huchra & Geller (1982), while Garcia (1993) and Brough et al. (2006) consider the group to be made up of 6 and 4 galaxy members, respectively. Makarov & Karachentsev (2011) reviewed the NGC 1553 group membership, including 29 members. The Dorado faint galaxy population is still poorly defined. A large population of dwarf galaxies is expected in groups dominated by ETGs, as is the case of Dorado. From a Canada-France-Hawaii Telescope (CFHT) Megacam campaign, Tully (2015) reported that these groups have larger dwarf-to-giant ratios with respect to groups dominated by LTGs (considering giants as those with Mr < −17 and dwarfs with −17 < Mr < −11, H0 = 75 km s−1 Mpc−1). An attempt to map the Dorado faint galaxy population was made by Carrasco et al. (2001) but without determining their redshift.
 |
Fig. 1. Projected distribution of the Dorado group member galaxies (see Appendix A). Galaxies labeled are those investigated in the present Hα+[N II] study. Galaxies are indicated according to their B-band absolute magnitude and morphological type. Fields covered by the du Pont and Swope pointings, listed in Table 1, are indicated in grey. |
Firth et al. (2006) redefined the Dorado members on the basis of the group structure and its dynamical properties. The Firth et al. (2006) Dorado backbone is composed of 20 members starting from the 79 galaxies, including a few dwarfs that Ferguson & Sandage (1990) identified and catalogued in the Dorado region. The Dressler & Shectman (1988) test applied to the group candidates by Firth et al. (2006) provided a 2D view of the group clumpiness. Furthermore, Firth et al. (2006) performed a crossing-time test checking for virialisation and found an indication that the group is still undergoing dynamical relaxation.
Recently Kourkchi & Tully (2017) revised the group structure, findings that 31 galaxies belong to Dorado according to their systemic radial velocities and membership criteria from Tully (2015). The group velocity dispersion is 242 km s−1 (Kourkchi & Tully 2017). The average recession velocity is ⟨Vhel⟩ = 1230 ± 89 km s−1. The 2° turnaround radius and the virial radius are 0.653 Mpc and 0.654 Mpc, respectively. The group virial mass weighted on virial radius is 3.50 × 10¹³ M⊙ (formulæ and definitions are provided by Kourkchi & Tully 2017 and Tully 2015).
The list of candidate members adopted in this paper is presented and discussed in Appendix A. We considered 31 member candidates: 30 from Kourkchi & Tully (2017) list excluding 2MASXJ04105983-5628496, plus PGC 75125 from Firth et al. (2006). Figure 1 shows the distribution in RA(J2000) and Dec (J2000) of the Kourkchi & Tully (2017) members. Appendix A provides further information about the group. Figure A.1 shows the morphological type distribution, which includes both ETGs and LTGs, and the velocity distribution. The galaxy population is dominated by the two giant ETGs, NGC 1549 and NGC 1553, the pair AM 0414-554/AM 0415-555 (Arp & Madore 1987) located roughly in the projected group centre, and the bright spiral, NGC 1566, at the group periphery. Iovino (2002) suggested that the pair NGC 1549/NGC 1553 is part of SCG 0414-5559, a compact group that also includes a spiral, IC 2058, and an S0, NGC 1546.
NGC 1549 and NGC 1553, in the group projected centre, show a wide system of shells and ripples (Malin & Carter 1983) whose origin is connected to merging and/or accretion episodes (Dupraz & Combes 1987; Weil & Hernquist 1993; Mancillas et al. 2019). While NGC 1553 has a normal rotation curve, NGC 1549 also shows a velocity gradient along its minor axis (Rampazzo 1988). NGC 1533 and NGC 1543, both S0s, show strong ring-like FUV emission (Marino et al. 2011b,a). Rampazzo et al. (2017) further investigated NGC 1533 and NGC 1543 using Swift-UVOT (Roming et al. 2005) in W1, M2, and W2 filters, confirming the presence of a young stellar population. Mazzei et al. (2014a,b, 2019) by matching the global properties of NGC 1533 and NGC 1543, derive their age and that of mergers (major and minor respectively) which drive their evolution. Cattapan et al. (2019) deep surface photometry unveiled strong interaction signatures in NGC 1533, IC 2038, and IC 2039. NGC 1536 (AM 0409-563) is a late-type galaxy showing a clear asymmetry in its structure, likely the result of an ongoing interaction. NGC 1596 is a lenticular galaxy interacting with NGC 1602, an LTG. In NGC 1596, the ionised gas counter-rotates with respect to stars (Bureau & Chung 2006). Chung et al. (2006) suggested that the origin of the counter-rotating gas is the interaction between the two galaxies that are embedded in a common H I cloud.
The presence of AGN-like activity has only been investigated in some of the Dorado members. Annibali et al. (2010) found that NGC 1533 and NGC 1553 are LINERs in their nuclear region (these authors investigated the region re/8 − re/2, but the classification in their Table 4 is relative to re/16). Rampazzo et al. (2013) studied the nuclear regions of NGC 1533, NGC 1549 and NGC 1553 in the mid-infrared with Spitzer, unveiling polyaromatic hydrocarbons (PAHs) with anomalous ratios in their spectra. These features have been interpreted as a relic of past star formation activity (see e.g. Vega et al. 2010).
The high fraction of signatures of galaxy–galaxy encounters, accretions, and merging suggest that Dorado members are going through a deep transforming phase, revealed by the (NUV – r) versus Mr CDM (Cattapan et al. 2019). Many ETGs have already reached the red sequence, while other galaxies are still transforming in the green valley. For the former, our objective is to test whether or not their star formation is completely quenched. For galaxies in the green valley, we aim to check how their SFR compares with that of galaxies of similar morphological type.
3. Observations and reduction
In this section we describe our Hα+[N II] data set and the reduction techniques we applied. The filter pass band includes [N II] emission lines (Fig. 2). The SFR of galaxies is derived applying a correction to the Hα emission, following the recipe of Lee et al. (2009); see Sect. 5.3.
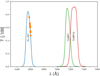 |
Fig. 2. Transmission profiles of the narrow band filters on and off the Hα line. Observed galaxies are indicated as dots on the Hα+[N II] filter at the wavelength given by their heliocentric recession velocity. |
A large fraction of Dorado members are dwarfs (see Appendix A.1). The separation of most of them from other members would have required a specific pointing. We decided to concentrate our efforts on bright galaxies for two reasons: (1) they have nearby companions and (2) they are well-studied galaxies, that is, additional information about their evolution (structure, kinematics, spectroscopic studies) is already available in the literature. Considering that we have lost one and a half nights because of bad weather conditions, the final sample resulted of 14 galaxies (13 in Kourkchi & Tully 2017 plus PGC 75125 in the Firth et al. 2006 list).
3.1. Hα+[N II] observations
Hα+[N II] images were obtained using the direct CCD Camera at the du Pont 2.5 m and at Swope 1m telescopes at Las Campanas Observatory (LCO, Chile). Observations cover the period between November 30 and December 7, 2018. Table 1 reports the details of the observing runs.
Hα narrow band observations.
The SITe2K CCD at the du Pont telescope covers a field of view (FOV) of 8.8 arcmin2 with a spatial scale of 0 259 pix−1, while the E2V CCD231-84 CCD at the Swope telescope has a larger FOV of 29.7 × 29.8 arcmin2 with a spatial sampling of 0
 435 px−1. Table 1 shows that some du Pont observations are composed of a mosaic of frames for the bright Dorado members, and a single frame for less extended galaxies. NGC 1566 and NGC 1581 were observed with a single, wide field image at the Swope telescope.
Hα+[N II] and nearby continuum images were obtained with the following filters: on-band #657 (FWHM = 74 Å), and off-bands #716 (FWHM = 77 Å) and #723 (FWHM = 109 Å). The Hα+[N II] #657 contains the [N II]λλ6548,6584 emission lines, while the #716 filter can be contaminated by [Ar III]λ7136, which is nevertheless a weak line, and #723 is almost completely free of emission lines.
The strategy of the observations consisted of taking 3 × 900 s (at the du Pont telescope) and 3 × 1200 s (at the Swope telescope) images for each filter on-band and off-band. The off-band image is obtained after each on-band image in order to minimise the seeing variations and to facilitate the continuum subtraction. For some of the galaxies, more than one pointing was required to cover the desired FOV. The seeing changed from night to night between 0 9 and 1
 6, but it was rather stable within each single night.
3.2. Hα+[N II] reduction
Data reduction was performed using the IRAF reduction package (Tody 1986). Raw scientific data were corrected for overscan. Flat-field correction was applied using twilight sky flats acquired during the observing run. Each image was background subtracted, normalised to 1 s exposure time, and corrected for airmass by means of the CTIO atmospheric extinction curve.
Each off-band image was first corrected for the different transmission curves of #716 and #723 with respect to the on-band Hα #657 filter, and then registered to the on-band image with the IRAF task IMALIGN. In addition, the PSFMATCH task was applied to take into account the small seeing variations before proceeding with the continuum subtraction. The continuum-subtracted, calibrated individual Hα+[N II] images were combined to finally produce a single averaged image per pointing. Multiple pointings, when available, were combined to compose the mosaic using SWarp (Bertin et al. 2002).
With the exception of some bright stars, the subtraction procedure was generally successful, as most of the stars disappeared with small or even no residuals. Saturated stars cannot obviously be well subtracted and leave large residuals on the final images.
3.3. Flux calibration
Photometric standard stars LTT 1788, LTT 3218, LTT 3864, LTT 4816, and Feige 110 observed during the nights were used for flux calibration. Raw images were processed as explained above up to airmass correction. In order to calculate the flux calibration constants, the PHOT task was used to measure the instrumental fluxes. These fluxes were then compared to the real fluxes obtained by multiplying the spectrum of each standard star (extracted from IRAF database) for the transmission curve of the on-band #657 filter.
4. Data analysis
Before carrying out measurements, the background of each continuum subtracted image was inspected and carefully re-fitted and re-subtracted with the IRAF task IMSURFIT if necessary. This is a delicate point, because even very small gradients can produce spurious fluxes when large areas of the image are integrated. To estimate the depth of the newly processed images, we measured the average surface brightness standard deviation, which ranges between 3 and 5 × 10⁻¹⁷ erg cm−2 s−1 arcsec−2.
We applied the IRAF task ELLIPSE to the off-band images, keeping centre, ellipticity, and position angle fixed in order to obtain concentric apertures. The ellipse parameters, reported in Table 2 (columns 3–5) were chosen on the basis of the outer isophotes of the images in the off-band continuum. Residuals of stars, particularly bright and saturated stars, were carefully masked. Figures 3 and 4 show on-band and off-band images, respectively, of the triplet (Cattapan et al. 2019) composed of the spiral IC 2038 and the two early-type galaxies IC 2039 and NGC 1533.
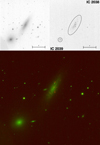 |
Fig. 3. Pair IC2038 (NW) and IC2039 (SE) in continuum (top left panel) and in the Hα+[NII] light (top right panel). The image size is 4′×4′. North is towards the top, and east is to the left. Residuals of stars have been masked. The ellipse, whose parameters are given in Table 2, encloses the integration area. The bottom panel shows a two-colour image of the pair (continuum in green and Hα+[N II] in red) that highlights a large numbers of brights HII regions. |
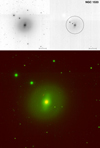 |
Fig. 4. As in Fig. 3 but for NGC 1533. Labels A and B indicate H II complexes (see text). The image size is 7′×7′. |
Parameters used to measure the Hα+[NII] flux and its EW.
Once the off-band images were fitted, the same ellipse was applied to the on-band continuum-subtracted ones. Following the examples and suggestions by James et al. (2004) we calculated the Hα+[N II] equivalent width (EW) profiles, and the total flux within the largest apertures showing emission up to 1σ level. Finally, the fluxes were corrected for the transmission of the on-band Hα filter at the wavelength corresponding to the radial velocity of each single galaxy, as given in Table A.1. The 3σ error associated to each measure is calculated using the sky background measured in five independent regions outside the ellipse whose parameters are reported in Table 2.
We remind the reader that fluxes are not corrected for internal reddening because the value of the extinction is unknown. Nonetheless it is worth noting that reddening and [N II] contamination change the Hα flux in opposite directions, such that they can even compensate each other but both effects cannot be quantified with the present data. This uncertainty does not apply to the EW, which is almost independent of reddening. The final Hα+[N II] fluxes and EW are reported in Table 2.
5. Results
We now present the results of our analysis for each single galaxy. In Appendix B we instead compare our results with the available literature.
5.1. Continuum versus Hα+[N II] morphology: individual notes
We report below some notes about the Hα+[N II] emission in our targets with particular attention to asymmetries or correlations with features present in the continuum image and to resonance structures. We present and discuss two-colour images (continuum in green and Ha+[NII] in red) which emphasise the morphology of Hα emission regions.
IC 2038/IC 2039. These two galaxies are classified Scd (Type = 7.0 ± 0.5) and E-S0 (Type = −3.1 ± 0.7), respectively. According to Cattapan et al. (2019) the galaxies show clear signatures of interaction. The Hα distribution of IC 2038, shown in Fig. 3, is clumpy and marks the presence of H II regions, without any obvious arm structure. H II regions are distributed along the galaxy body which appears slightly elongated towards the companion galaxy in the SE direction (see Cattapan et al. 2019, their Fig. 2). In IC 2039, the Hα+[N II] emission is diffuse and smooth, without H II regions.
NGC 1533. This galaxy is classified E-S0 with a bar (Type = −2.5 ± 0.6) by HyperLeda and (RL)SB00 by Comerón et al. (2014), that is, the galaxy has an outer ring, a lens, and an inner bar. H II regions in Fig. 4, labelled A and B, correspond to the rings clearly revealed in far-ultraviolet (FUV) by GALEX (see e.g. Werk et al. 2010; Marino et al. 2011c; Rampazzo et al. 2017).
NGC 1536. This galaxy is classifed as SBc (Type = 4.6 ± 1.8) in HyperLeda. In the continuum image the galaxy shows a thin bar in the central region and irregular arms with signatures of interaction. The Hα+[N II] emission follows roughly the structures seen in the continuum (Fig. C.1). H II regions are asymmetrically distributed with respect to the inner bar. These regions develop along the NW arm and are scattered within the south galaxy body.
NGC 1543. This galaxy is considered a S0 with bar and a ring (Type = −2.0 ± 0.8) in HyperLeda. The Hα+[N II] emission follows the bar in the galaxy central region (see Fig. C.2). The Hα emission is concentrated in some H II complexes, labelled A, B, and C in Fig. C.2, along the southeast edge of the outer ring. These SF areas are clearly visible in FUV GALEX observations (Marino et al. 2011b,a; Rampazzo et al. 2017).
NGC 1546. This galaxy, considered a S0-a (Type = −0.4 ± 1.7) in Comerón et al. (2014), is classified E(b)3/(R’)SA(r)ab, that is, it could be a 3D ETG or a SA with an inner ring. The continuum image in Fig. C.3 shows a small bulge embedded in a strongly inclined disc (53.3 degree in Hyperleda). The Hα+[N II] emission shows a flocculent structure inside the disc. The H II regions, which are emphasised in the two-colour image, follow the inner and outer rings evidenced by Comerón et al. (2014). A strong dust lane is visible in the SW ridge of the galaxy.
NGC 1549. This galaxy is considered in HyperLeda to be a true elliptical (Type = −4.3 ± 0.9). The Hα+[N II] emission in Fig. C.4 (top right panel) shows an amorphous distribution like that of the continuum (top left panel). No H II regions are visible.
NGC 1553. This galaxy is classified S0 with a ring (Type = −2.3 ± 0.6). Comerón et al. (2014) classified it SA(rl,nr’l)0+, that is, two rings are present in this lenticular galaxy. For NGC 1553, 75% of the Hα+[N II] flux is measured within an ellipse of 60″ of semi-major axis, containing the core and the ring visible in Fig. C.5, which is a relatively small central region with respect to the size of the ellipse reported in Table 2. No H II regions are revealed in the galaxy (see, however, Sect. 6.1). Trinchieri et al. (1997) show a Hα+[N II] image of the galaxy (their Fig. 11, right panel) but no flux is provided in that paper. At faint levels (the authors smoothed the image to enhance features), the morphology in their image shows a noisy spiral arm, in the southeast direction, which is not detected in our observations.
IC 2058. This galaxy is an edge-on spiral (Scd, Type = 6.6 ± 0.9). Hα+[N II] emission is revealed along the plane of the galaxy and no obvious bulge is visible (see Fig. C.6). Uncalibrated Hα observations of this galaxy performed by Rossa & Dettmar (2003) did not reveal any extra-planar Hα emission in the halo of this spiral galaxy. Figure C.6 shows that H II regions are indeed distributed all along its disc.
PGC 75125. This dwarf galaxy is a companion of IC 2058 according to Firth et al. (2006). The two galaxies are nearby in projection and have a heliocentric velocity difference ΔVhel = 26 km s−1. According to HyperLeda, the galaxy morphological type is T = 5.0 ± 3.0. In the continuum image, the galaxy structure appears boxy and without spiral arms. An elongated, distorted Hα+[N II] distribution (Fig. C.7) appears in the outer regions of this galaxy. The Hα+[N II] emission could mark the (warped) disc of the galaxy. We suggest this galaxy is likely a late S0.
NGC 1566. This is a grand-design barred galaxy classified as a SABb (Type = 4.0 ± 0.2) in the HyperLeda catalogue. According to Comerón et al. (2014), who classified the galaxy (R’1)SB(r’l, s,nb)b, there are two rings of which we do not find any evidence in the Hα+[N II] image (Fig. C.8). NGC 1566 is asymmetric (the southern part is more stretched than the northern one).
NGC 1581. This is an E-S0 galaxy (Type = −2.9 ± 0.8 according HyperLeda). Figure C.9 shows an inner ring both in the continuum and in the Hα+[N II] images. Small bright H II regions are visible near the galaxy centre and in the inner ring, which is brighter in the west region of the galaxy. NGC 1581 is likely a companion of NGC 1566 (Kendall et al. 2015; Oh et al. 2015);see also Sect. 6).
NGC 1596/ NGC 1602. These two Dorado members, nearby in projection, are separated by ΔVhel = 230 km s−1 (Fig. C.10). NGC 1596 is a S0 galaxy (Type = -2.0 ± 0.5). No H II regions are visible. NGC 1602 is an irregular galaxy (Type = 9.5 ± 0.6). Our Hα+[N II] image outlines the presence of several H II regions which form a sort of ring and a large complex west of the galaxy centre.
5.2. Hα+[N II] equivalent width
In Fig. 5 we plot the EW growth curve for each galaxy. Growth curves, computed following James et al. (2004), whose large sample is a benchmark reference, are obtained dividing the Hα+[N II] emission aperture fluxes by the continuum within the same elliptical aperture, assuming that the average continuum level within the filter is equal to the continuum level in Hα #657 filter. Total fluxes and EW are reported in Table 2. The EW of the Hα+[N II] emission traces the specific SFR, and is normalised by the luminosity of the older stellar population of the galaxy (see e.g. James et al. 2004; Lee et al. 2009).
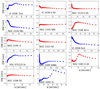 |
Fig. 5. Hα+[NII] EW growth curve of each galaxy measured in concentric elliptical apertures out to the value of the elliptical aperture given in Table 2 and shown in Figs. 3 and 4 and in Appendix B (Figs. C.1–C.10). ETGs are indicated in red, LTGs in blue. Morphological classifications are from HyperLeda. |
Figure 5 shows that EW growth curves are basically flat in ETGs with average values of ≤0.75 nm. NGC 1553, IC 2039, and NGC 1533 show higher EW values at the centre, namely 1, 1, and 1.5, respectively. Moreover, the quasi-constant trend of NGC 1533 rests at a higher value than on average. NGC 1546 shows a rising inner curve reaching EW = 1.5 between 10″ and 20″, which is in the bright ring, and then a slow decrease down to EW = 1 in the outer region (about 1′). NGC 1581 shows almost the same trend as NGC 1546, reaching EW = 1.7 at 12″ and then slowly decreasing to EW = 1 at 35″, which is the limit of emission we detect in this galaxy.
The growth curves for LTGs show different shapes. IC 2038 shows a rising curve out to 18″ reaching a value of 2.5 units, before decreasing and stabilising around EW = 2. In PGC 75125 the curve shows a plateau following the maximum value of EW = 2.5 reached at 5″. Growth curves of NGC 1536 and IC 2058 are decreasing from the centre to the periphery, while in NGC 1566, after reaching a minimum around 25″, the curve shows a slight increase.
Concerning irregular galaxies, NGC 1602 shows the highest value in our sample of EW = 5.6 at 30″. In the outer region the curve decreases down to EW = 4.2.
The total EW (Table 2) of our targets is plotted versus morphological type in Fig. 6. In the same figure we compare our results with those of James et al. (2004), who report the mean EW as derived from a large sample of spiral galaxies, including interacting spirals as well as members of pairs and groups. These latter authors found an increasing trend of EW. Our results follow this trend although our targets with 4≤Type≤8 have values lower than the average and the median. However, spirals with values of EW ≈ 1.5–2.2, as in our Dorado members, are present in the James et al. (2004) sample (see their Fig. 15). Although our sample is not large enough for our findings to be statistically significant, with respect to previous studies it extends the range of morphological types including several ETGs (the brigher ones) in the Dorado groups.
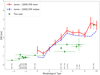 |
Fig. 6. Integrated value of Hα+[NII] EW for our targets as a function of their morphological type. Our values are compared with the mean and the median for the late-type galaxy sample studied by James et al. (2004). |
5.3. Star formation rate
The Hα luminosities and SFRs are reported in the last columns of Table 3. Since our observations include [N II] we need to remove this contribution from the total flux. This implies knowledge of the [N II]/Hα line ratio, for example from spectroscopy. An alternative is to use the average relationship between [N II]λ6583/Hα and the total B-band absolute magnitude MB (Col. 2 in Table 3), a consequence of the luminosity–metallicity relation for galaxies. We adopt the Lee et al. (2009) formulæ, in particular their equations 1 and 2, to derive the [N II]/Hα ratio, L(Hα), and the SFR. Assuming a 3:1 ratio between [N II]λ6583 and [N II]λ6548, these latter authors propose the following formulæ. If MB > −20.3, log([N II]λ6583/Hα) = (−0.173 ± 0.007) ×MB − (3.903 ± 0.137).
Parameters used to compute the SFR from Hα luminosity.
For MB ≤ −20.3, [N II]λ6583/Hα = 0.54. For all LTGs–with the exclusion of NGC 1566–, as they are fainter than −18 absolute B-mag, [N II]/Hα ≤ 0.16 with an error of < 10%. In this way, we compute the Hα luminosity, L(Hα), in Table 3 and the SFR as: SFR(M⊙ yr−1) = 7.9 × 10⁻³⁵ L(Hα) W.
In Fig. 7 we plot the SFR as a function of morphological type. For Type > 0, three of our targets are consistent with the trend reported by James et al. (2004, for a sample of 334 spiral galaxies, of morphological types from S0/a to Irr and with Vhel ≤ 3000 km s−1), increasing until Type ∼4–5 then declining, while another three targets, PGC 75125, IC 2038, and NGC 1536, have significantly lower SFR, comparable with Type< 0 sample galaxies. We point out that LTGs with low SFR, like the cases above, are also found in the James et al. (2004) sample. PGC 75125, in particular, has a very uncertain classification and is likely near to S0s (see our Sect. 5).
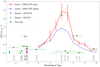 |
Fig. 7. Hα SFR of Dorado galaxies as a function of their morphological type. For LTGs (0 ≤ Type ≤ 10) the red line and the blue dotted lines represent the mean and the median SFR computed on a sample of 334 galaxies by James et al. (2004). For ETGs (−5≤ Type < 0) the magenta and cyan squares represent the SFR of detected objects (55/147), representative of the whole ATLAS3D survey, by Gavazzi et al. (2018). These latter authors divided ETGs into two families of elliptical (Type = −5) and S0s (Type = −2). Our values (green diamonds) are reported in Table 3. |
Dorado is not sufficiently rich in spirals to define a trend for Types> 0, but its galaxy population includes several early types. In Fig. 7 we compare our results with the SFR calculated by Gavazzi et al. (2018) from Hα+[N II] imaging of a sample of 147 ETGs from ATLAS3D. These latter authors detect 55 EGTs (37% of the sample), mostly S0. To compute the SFR, Gavazzi et al. (2018) adopted the Kennicutt (1998) formula modified by a Chabrier IMF. As SFR(Chabrier) = SFR(Kennicutt)/1.58 (Boselli et al. 2015), we applied this transformation to the sample in Gavazzi et al. (2018) to compare their values with our estimates.
Gavazzi et al. (2018) divided ETGs into two sets: ellipticals (Type = −5, magenta squares) and S0s (Type=−2, cyan squares). Four of our galaxies show a larger SFR than those found by Gavazzi et al. (2018), namely three S0s (NGC 1533, NGC 1543, NGC1553) and NGC 1549, a bona fide elliptical. NGC 1553 has a SFR that, remarkably, is above the average for ETGs, despite its EW value. Figure 8 (adapted from Rampazzo et al. 2003), discussed in Sect. 6.1, provides a clear map of the presence and complex structure of the Hα emission in the inner region of this galaxy.
 |
Fig. 8. NGC 1553: Hα monochromatic map obtained from Fabry-Perot (Rampazzo et al. 2003) overplotted to the present Hα+[N II] contours. The Hα emission is clumpy and extends for about 30″. We note that the Hα peak is displaced from the Hα+[N II] centre and corresponds to the X-ray source Chandra CXOU J041610.5-554646.8. |
6. Discussion
It is widely accepted that cluster galaxies have depressed SFRs in comparison with the field (e.g. Poggianti et al. 2006; Vulcani et al. 2010; Paccagnella et al. 2016, and references therein). Understanding SF quenching during the galaxy co-evolution in groups is fundamental for two reasons: groups contain ≈60% of the galaxies in the nearby universe (Tully & Fisher 1988; Ramella et al. 2002; Tago et al. 2008) and the transition in galaxy properties that is typical between field galaxies and clusters takes place roughly at the characteristic densities of groups (Lewis et al. 2002; Goto et al. 2003; Gómez et al. 2003; Marino et al. 2016). In the following, we discuss our results considering substructures in the Dorado group, from its barycentre to the periphery.
6.1. The Dorado barycentre: the compact group SCG 0414-5559
The barycentre of Dorado hosts the compact group SGC 0414-5559 identified by Iovino (2002) (for the compact group definition see Hickson 1982). SGC 0414-5559 includes four members, namely NGC 1546 (member C), NGC 1549 (member B), NGC 1553 (member A), and IC 2058 (member D). The average recession velocity of the four galaxies is 1259 km s−1 with a standard deviation of 93 km s−1 (see Fig. A.1 and Table A.1).
Diaferio et al. (1994) proposed that compact groups form continually in a single rich group during its collapse and virialisation. This idea is based on observational evidence that compact groups are located within looser structures or rich neighbourhoods (see e.g. Ribeiro et al. 1998, and references therein). According to the N-body simulations of Diaferio et al. (1994), the survival time of these structures is about 1 Gyr and most of the member galaxies are not merger remnants.
As sketched in Sect. 2, galaxies in SCG 0414-5559 are, in contract, rich in merging and interaction signatures. The nuclei of the two shell galaxies, NGC 1549 and NGC 1553, are LINERs (see e.g. Annibali et al. 2010; Rampazzo et al. 2013). Optical line strength indices show that NGC 1553 has a young nucleus with a luminosity-weighted age of 4. ± 0.7 Gyr (Annibali et al. 2007). Mid-infrared Spitzer-IRS spectra of both NGC 1549 and NGC 1553 from Rampazzo et al. (2013) show that PAHs are present in the nucleus with anomalous emission ratios. This kind of nucleus could host AGNs as well as residuals of past star formation events (see e.g. Vega et al. 2010). In the X-ray domain, the emission of the nucleus of NGC 1553 is AGN-like (Flohic et al. 2006). GALEX observations detected both NGC 1553 (Marino et al. 2011b) and NGC 1549 in NUV while a ring is barely visible in FUV in NGC 1553.
Figures C.4 and C.5 show that the Hα+[N II] emission distribution, along the galaxy body, is following the stellar continuum. Gavazzi et al. (2018) suggest that weak Hα emitters, for example galaxies dominated by [N II], can harbours AGN at their centre, not connected with the observed widespread SF. Spectroscopic studies illustrate and enrich the above finding. Rampazzo et al. (2003) used Fabry-Perot observations to study the Hα kinematics in the central regions of NGC 1553. The high spectral resolution (R = 9400 at Hα, for S/N = 3) of the instrument made it possible to isolate Hα emission showing that gas and stars co-rotate. In Fig. 8 we overplot the Hα monochromatic map from the Fabry-Perot to our Hα+[N II] isophotal contours. The map shows the clumpy and irregular Hα distribution, whose peak is centred neither on the continuum nor on the Hα+[N II] emission but coincides with an X-ray discrete source whose colours suggest an absorbed AGN (Blanton et al. 2001; Flohic et al. 2006). The X-ray-discrete source, Chandra CXOU J041610.5-554646.8, seems partly responsible for the very innermost Hα emission of NGC 1553.
The outskirts of NGC 1553 are characterised by very extended shells (Malin & Carter 1983). We searched for extragalactic H II regions and dwarf galaxies in our FOV. [CMI2001]4136-0 is an object that is highly visible in GALEX FUV projected on the NGC 1553 outskirts (Fig. 9). Although it is classified as a galaxy in CDS, we we do not see any obvious galaxy in continuum frame. Rather, in Hα we see two H II regions which should be associated to NGC 1553.
 |
Fig. 9. [CMI2001]4136-01 (RA = 04 16 15.1 Dec = −55 41 51 J2000) is a region northeast of NGC 1553 that has been detected by GALEX. A zoom on this area is shown in the continuum (left panel) and in Hα+[N II] (right panel). The FOV is 2′ × 2′. In the centre of the field, two H II regions are clearly visible in Hα+[N II] frame, while objects are barely detected in the continuum. |
The region of IC 2058, southeast of NGC 1549/NGC 1553, is H I -rich (Kilborn et al. 2009) with a mass of 17.1 ± 1.2 ×10⁸ M⊙. Pearson et al. (2016) studied the H I distribution enclosing IC 2058 and the dwarf galaxy PGC 75125. On the basis of the low outer versus total H I gas fraction, these latter authors suggest that most of the H I gas, removed in the IC2058/PGC 75125 galaxy–galaxy interaction, is in an ionised state. Both IC 2058 and PGC 75125 show H II complexes (see also Rossa & Dettmar 2003, for IC2058). The Hα+[N II] emission, crossing PGC 75125 as a clumpy and warped lane, may suggest an in-flight gas refueling (see e.g. Domingue et al. 2003, and references therein) following the picture described by Pearson et al. (2016).
NGC 1546 is located southwest of NGC 1549 and NGC 1553. Kilborn et al. (2005) detected this galaxy in H I with a mass of 24.1 ± 1.4×10⁸ M⊙. Its H II regions have a flocculent appearance likely following the inner and outer rings described by Comerón et al. (2014).
In summary, the SF is concentrated at the southern periphery of the SCG 0414-5559 compact group in correspondence with a rich concentration of H I , while the area covered by NGC 1549 and NGC 1553 is undetected down to the Kilborn et al. (2005) survey limit of ≈3.5 × 10⁸ M⊙. However, Hα was detected using Fabry-Perot in the central 30″ by Rampazzo et al. (2003) and in the present study as H II regions in the NGC 1553 outskirts.
6.2. The northwest side of the Dorado backbone: NGC 1533, IC 2038, and IC 2039
The northwest side of Dorado is a physical substructure in the group (see e.g. Fig. A.1 bottom panel). Ryan-Weber et al. (2003) detected a wide plume of H I extending from IC 2038 to the east towards NGC 1533. Several extragalactic H II regions were detected in this H I tail by Werk et al. (2010, their Fig. 7).
Figure 4 shows that SF in NGC 1553 is not shut down: H II regions, indicated with A and B, are outside the galaxy centre in a SF ring shown by Marino et al. (2011a) in NUV and FUV. We searched for H II regions detected by Werk et al. (2010). The H II regions shown in Fig. 10 correspond to the Werk et al. (2010) detection. However, the triplet merits further investigation with wide-field, deep Hα+[N II] images (see e.g. Boselli et al. 2018).
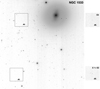 |
Fig. 10. Left panel: southeast region of NGC 1533 shown in the continuum nearby Hα. The two areas of 60″×60″ inserted in the panel mark the position of H II regions revealed by our Hα+[N II] observations, E1+ E2 (04 10 13.5 −56 11 36 J2000) and E4 (04 10 10.66 −56 07 27.99 J2000) and shown in the two right panels. These H II regions were first identified by Werk et al. (2010). |
Our observations confirm that SF is detected not only in the spiral galaxy IC 2038 and in the centre of NGC 1533 but also along the H I tails. The SF in IC 2038 is depressed if compared with objects of the same morphological type (Fig. 7), likely because of ongoing stripping (see e.g. Werk et al. 2010; Cattapan et al. 2019).
6.3. The southwest edge of Dorado: NGC 1536 and NGC 1543
NGC 1536 and NGC 1543 appear quite isolated in projection within the group, although their heliocentric velocities (Vhel = 1296 and Vhel = 1148 km s−1, respectively) are very close to that of the central pair, NGC 1549 and NGC 1553 (Vhel = 1202 km s−1). The structure of NGC 1536 is relatively asymmetric. Both NGC 1536 and NGC 1543 were detected in Hα+[N II] H II regions are revealed throughout the body of NGC 1536 but the galaxy has a very low SFR (Fig. 7). Kilborn et al. (2005) noted that H I is detected at a rate that is five to ten times less than expected for this galaxy.
H II regions are detected in the outer ring in NGC 1543. In the central 1.5″ of NGC 1543, Parkash et al. (2019) measured a ratio of [NII]/Hα = 2.004, confirming that, as in the case of NGC 1553, the dominant phenomenon is not SF, at least in the nucleus. Indeed, the galaxy nucleus is classified as a LINER. Although NGC 1543 is classified as a barred S0 (see Table A.1), Murugeshan et al. (2019, and references therein) included the galaxy in a sample of H I -deficient late-type galaxies (see also Kilborn et al. 2005). Investigating the possible role of the angular momentum in the H I depletion (logH I = 8.75 M⊙), these latter authors show that H I is concentrated in the galaxy outskirts, overlapping the stellar outer ring. The galaxy main body is devoid of H I at the limit of their survey. The H II complexes we find in this galaxy develop at the southeast edge of the H I and stellar ring. Murugeshan et al. (2019) suggested that the H I hole in NGC 1543 is regulated by the galaxy specific angular momentum rather than the influence of the environment.
Marino et al. (2011a) found FUV emission in the same area in which we found H II regions. Mazzei et al. (2019) showed that the global properties of this galaxy, both photometric and spectro-photometric (SED, B absolute magnitude, morphology, velocity dispersion and rotation, X-ray luminosity of the hot gas, and amount of H I gas) can be accounted for by a minor merger event (mass ratio 5:1). The galaxy has a global age of 10.7 Gyr and suffered rejuvenation episodes in the last 2.3 Gyr. In these galaxies, the “H I deficiency” seems dominant in regulating the SF.
6.4. Towards the east along the backbone: the pairs NGC 1566/NGC 1581 and NGC 1596/NGC 1602
Three objects are found in projection east of the SCG 0414-5559 central compact group along the Dorado backbone, namely NGC 1566, NGC 1581, and the clump formed by NGC 1596 and NGC 1602. There is evidence that not only the two close galaxies NGC 1596 and NGC 1602 form a physical pair but also the very separated ones NGC 1566 and NGC 1581. Both regions are H I rich (Kilborn et al. 2005; Chung et al. 2006).
Kendall et al. (2015) and Oh et al. (2015) suggest that NGC 1566 and NGC 1581 form a physical pair of galaxies, although their projected separation in terms of galaxy size, Rproj/R25, is 9.7 kpc. This pair, with a relative mass ratio of 0.05 and a radial velocity difference of 96 km s−1, has a high tidal parameter (a measure of the strength of the tidal interaction) according to Kendall et al. (2015). The arm structures of NGC 1566 (Fig. C.8) still show signatures of an encounter that might have occurred with NGC 1581 (Oh et al. 2015), while NGC 1581 does not show obvious signatures of interaction (see Fig. C.9). However, NGC 1581, which shows H II regions in the inner ring, could have acquired the gas from NGC 1566 during its peri-galactic passage. Several acquisition and gas-stripping scenarios have been discussed in the case of mixed ETG+spiral pairs by Domingue et al. (2003), while mass-transfer examples are in described in detail by Keel (2004).
The case of the physical pair NGC 1596/NGC 1602 (Fig. C.10) may be another example of H I gas transfer by a donor. The area in which the pair is found is very rich in neutral hydrogen (Chung et al. 2006) which extends from NGC 1602, the donor, to NGC 1596, the receiver. In NGC 1596, the acquired gas counter-rotates with respect to stars. However, we do not detect H II regions in NGC 1596 but only an extended Hα+[N II] emission. Chung et al. (2006) reported that the ionised gas in NGC 1596 produces mostly [OIII]λ5007 emission in the central part (see also Bureau & Chung 2006). There is no mention of Hα by Bureau & Chung (2006), although one channel (of the dual-channel spectrograph) is centred on the Hα wavelength. The [OIII] emission is concentrated in the central regions (of a few arcsec; see Fig. 1 in Bureau & Chung 2006).
7. Summary and conclusions
Dorado is a nearby, rich group extending for about 10 square degrees in the southern hemisphere. We observed the 14 galaxies that form the group backbone, both early and late types, in narrow-band Hα+[N II] imaging. We obtained their Hα luminosity and estimated their SFR.
We obtained the following results:
-
All members were detected in Hα+[N II], irrespective of their morphological type.
-
H II regions are clearly visible in half of the ETGs, namely NGC 1533, NGC 1543, NGC 1546, and NGC 1581. H II regions are found in rings and/or filaments. In NGC 1549, NGC 1553, and NGC 1596, the Hα+[N II] emission does not show the clumpy structures of H II regions, but a rather smooth structure. However, Hα is likely present in the central regions of the galaxy as suggested by the high-resolution Fabry-Perot observations of NGC 1553 (Rampazzo et al. 2003).
-
We detect H II regions in the galaxy outskirts of NGC 1533 (Werk et al. 2010, and reference therein) and in NGC 1553, detected also by GALEX as FUV-emitting regions.
-
Gavazzi et al. (2018), using the ATLAS3D sample, detected 55/147 ETGs, which is 37%
 of their sample (errors are calculated using 1σ low and upper limits from Poisson statistics following Gehrels 1986). Considering errors, Gavazzi et al. (2018) detected less than half of their galaxies in Hα+[N II],, likely because of the significant presence of Virgo members which include passively evolving ETGs (see e.g. Bressan et al. 2006). We conclude that ETGs in Dorado are leaving an active phase and their SF is not yet extinguished.
 -
The H II regions of the LTG NGC 1536 are irregularly distributed following the morphological perturbation of the underlying galaxy. This is also partially seen in IC 2038.
-
The EW of Hα+[N II] emission, a measure of the specific SFR, is increasing with morphological type, although most of the LTGs in our sample are below the mean and median values corresponding to their morphological types (James et al. 2004). The EW of ETGs extends the trend towards low morphological-type values, in the −5≤Type≤0 range.
-
The SFR of the Dorado spiral members is in the range of general surveys of LTGs (James et al. 2004), but rarely above the median of their morphological type. Three galaxies, namely NGC 1536, PGC 75125, and IC 2058, have a SFR that is well below the median for their morphological classes. The dominant mechanisms in action in this evolutionary phase of the Dorado group are gas stripping and gas exchange via in-flight re-fuelling between galaxies. Some galaxies are already H I deficient, as in cluster counterparts.
In summary, the present Hα+[N II] observations show the Dorado backbone to be a strongly evolving environment. Hα is a short-timescale (107 years) indicator in terms of evolution. The gas reservoirs, still present in LTGs and their surrounding environment, sometimes trigger a residual activity in ETGs.
The donor–receiver mechanism, via galaxy–galaxy interaction, appears important at the edge of Dorado, considering the pairs (NGC 1566/ NGC 1581, NGC 1596/ NGC 1602) and the triplet (NGC 1533, IC 2038, and IC 2039). Gas stripping is another mechanisms in action: NGC 1533 stripped IC 2038, and the same might have happened in the past between NGC 1566 and NGC1581 and between NGC 1596 and NGC 1602. The consequence of this stripping could be linked to the low SFR of the spiral IC 2038 (Fig. 7), to the presence of H II regions in the inner ring of NGC 1581, and to the H I plume connecting NGC 1602 to NGC 1596 (Chung et al. 2006).
The barycentre of the group, the compact group SCG 0414-5559, appears more evolved. In the two shell galaxies NGC 1549 and NGC 1553, the Hα+[N II] emission is dominated by [NII], although Hα has been found in the NGC 1553 central region via Fabry-Perot high-resolution observations (Rampazzo et al. 2003). Star formation is still found in the outskirts of this compact group in IC 2058, in its dwarf physical companion PGC 75125, both enclosed in an H I cloud, and in NGC 1546.
Analysis of the SFR in Dorado will continue in the far-ultraviolet. We have already observed the present sample with UVIT on Astrosat (Tandon et al. 2017) in the FUV band. The connection between UV and Hα SFRs will be the subject of a forthcoming paper.
Acknowledgments
We wish to thank the unknown referee for very constructive suggestions. R.R. and P.M acknowledge the partial support of the INAF PRIN-SKA 2017 program 1.05.01.88.04. MS acknowledges financial support from the VST project (P.I. P. Schipani). E.C. acknowledges support from ANID project Basal AFB-170002. This paper includes data gathered with the du Pont and Swope Telescopes located at Las Campanas Observatory, Chile. We acknowledge the usage of the HyperLeda database (http://leda.univ-lyon1.fr). IRAF is distributed by the National Optical Astronomy Observatories, which is operated by the Association of Universities for Research in Astronomy, Inc. (AURA) under cooperative agreement with the National Science Foundation.
References
- Annibali, F., Bressan, A., Rampazzo, R., Zeilinger, W. W., & Danese, L. 2007, A&A, 463, 455 [NASA ADS] [CrossRef] [EDP Sciences] [Google Scholar]
- Annibali, F., Bressan, A., Rampazzo, R., et al. 2010, A&A, 519, A40 [NASA ADS] [CrossRef] [EDP Sciences] [Google Scholar]
- Arp, H. C., & Madore, B. 1987, A catalogue of Southern Peculiar Galaxies and Associations [Google Scholar]
- Baldry, I. K., Glazebrook, K., Brinkmann, J., et al. 2004, ApJ, 600, 681 [NASA ADS] [CrossRef] [Google Scholar]
- Balogh, M. L., Baldry, I. K., Nichol, R., et al. 2004, ApJ, 615, L101 [NASA ADS] [CrossRef] [Google Scholar]
- Barnes, J. E. 2002, MNRAS, 333, 481 [NASA ADS] [CrossRef] [Google Scholar]
- Bertin, E., Mellier, Y., Radovich, M., et al. 2002, in Astronomical Data Analysis Software and Systems XI, eds. D. A. Bohlender, D. Durand, T. H. Handley, ASP Conf. Ser., 281, 228 [Google Scholar]
- Blanton, E. L., Sarazin, C. L., & Irwin, J. A. 2001, ApJ, 552, 106 [NASA ADS] [CrossRef] [Google Scholar]
- Boselli, A., Fossati, M., Gavazzi, G., et al. 2015, A&A, 579, A102 [NASA ADS] [CrossRef] [EDP Sciences] [Google Scholar]
- Boselli, A., Fossati, M., Ferrarese, L., et al. 2018, A&A, 614, A56 [NASA ADS] [CrossRef] [EDP Sciences] [Google Scholar]
- Boselli, A., & Gavazzi, G. 2006, PASP, 118, 517 [NASA ADS] [CrossRef] [Google Scholar]
- Boselli, A., & Gavazzi, G. 2014, A&ARv., 22, 74 [NASA ADS] [CrossRef] [Google Scholar]
- Bressan, A., Panuzzo, P., Buson, L., et al. 2006, ApJ, 639, L55 [NASA ADS] [CrossRef] [Google Scholar]
- Brough, S., Forbes, D. A., Kilborn, V. A., & Couch, W. 2006, MNRAS, 370, 1223 [NASA ADS] [CrossRef] [Google Scholar]
- Bureau, M., & Chung, A. 2006, MNRAS, 366, 182 [NASA ADS] [Google Scholar]
- Carrasco, E. R., Mendes de Oliveira, C., Infante, L., & Bolte, M. 2001, AJ, 121, 148 [NASA ADS] [CrossRef] [Google Scholar]
- Cattapan, A., Spavone, M., Iodice, E., et al. 2019, ApJ, 874, 130 [NASA ADS] [CrossRef] [Google Scholar]
- Chung, A., Koribalski, B., Bureau, M., & van Gorkom, J. H. 2006, MNRAS, 370, 1565 [NASA ADS] [CrossRef] [Google Scholar]
- Comerón, S., Salo, H., Laurikainen, E., et al. 2014, A&A, 562, A121 [NASA ADS] [CrossRef] [EDP Sciences] [Google Scholar]
- Di Matteo, T. 2015, in IAU Gen. Assembly, 29, 2257908 [Google Scholar]
- Diaferio, A., Geller, M. J., & Ramella, M. 1994, AJ, 107, 868 [NASA ADS] [CrossRef] [Google Scholar]
- Domingue, D. L., Sulentic, J. W., Xu, C., et al. 2003, AJ, 125, 555 [NASA ADS] [CrossRef] [Google Scholar]
- Dressler, A., & Shectman, S. A. 1988, AJ, 95, 985 [NASA ADS] [CrossRef] [Google Scholar]
- Dupraz, C., & Combes, F. 1987, A&A, 185, L1 [NASA ADS] [Google Scholar]
- Ferguson, H. C., & Sandage, A. 1990, AJ, 100, 1 [NASA ADS] [CrossRef] [Google Scholar]
- Firth, P., Evstigneeva, E. A., Jones, J. B., et al. 2006, MNRAS, 372, 1856 [NASA ADS] [CrossRef] [Google Scholar]
- Flohic, H. M. L. G., Eracleous, M., Chartas, G., Shields, J. C., & Moran, E. C. 2006, ApJ, 647, 140 [NASA ADS] [CrossRef] [Google Scholar]
- Garcia, A. M. 1993, A&AS, 100, 47 [NASA ADS] [Google Scholar]
- Gavazzi, G., Consolandi, G., Pedraglio, S., et al. 2018, A&A, 611, A28 [NASA ADS] [CrossRef] [EDP Sciences] [Google Scholar]
- Gehrels, N. 1986, ApJ, 303, 336 [NASA ADS] [CrossRef] [Google Scholar]
- Gómez, P. L., Nichol, R. C., Miller, C. J., et al. 2003, ApJ, 584, 210 [NASA ADS] [CrossRef] [Google Scholar]
- Goto, T., Yamauchi, C., Fujita, Y., et al. 2003, MNRAS, 346, 601 [NASA ADS] [CrossRef] [Google Scholar]
- Goudfrooij, P., Hansen, L., Jorgensen, H. E., & Norgaard-Nielsen, H. U. 1994a, A&AS, 105, 341 [NASA ADS] [Google Scholar]
- Goudfrooij, P., Hansen, L., Jorgensen, H. E., et al. 1994b, A&AS, 104, 179 [NASA ADS] [Google Scholar]
- Hawley, S. A., & Phillips, M. M. 1980, ApJ, 235, 783 [NASA ADS] [CrossRef] [Google Scholar]
- Heckman, T. M. 1980, A&A, 500, 187 [Google Scholar]
- Hickson, P. 1982, ApJ, 255, 382 [NASA ADS] [CrossRef] [Google Scholar]
- Hoopes, C. G., Walterbos, R. A. M., & Bothun, G. D. 2001, ApJ, 559, 878 [NASA ADS] [CrossRef] [Google Scholar]
- Huchra, J. P., & Geller, M. J. 1982, ApJ, 257, 423 [NASA ADS] [CrossRef] [Google Scholar]
- Iovino, A. 2002, AJ, 124, 2471 [NASA ADS] [CrossRef] [Google Scholar]
- James, P. A., Shane, N. S., Beckman, J. E., et al. 2004, A&A, 414, 23 [NASA ADS] [CrossRef] [EDP Sciences] [Google Scholar]
- Jeong, H., Yi, S. K., Bureau, M., et al. 2009, MNRAS, 398, 2028 [NASA ADS] [CrossRef] [Google Scholar]
- Kaviraj, S., Schawinski, K., Devriendt, J. E. G., et al. 2007, ApJS, 173, 619 [NASA ADS] [CrossRef] [Google Scholar]
- Keel, W. C. 2004, AJ, 127, 1325 [NASA ADS] [CrossRef] [Google Scholar]
- Kendall, S., Clarke, C., & Kennicutt, R. C. 2015, MNRAS, 446, 4155 [NASA ADS] [CrossRef] [Google Scholar]
- Kennicutt, R. C., Jr. 1998, ARA&A, 36, 189 [Google Scholar]
- Kennicutt, R. C., Jr., Lee, J. C., Funes, J. G., et al. 2008, ApJS, 178, 247 [NASA ADS] [CrossRef] [Google Scholar]
- Kennicutt, R. C., Jr., Hao, C.-N., Calzetti, D., et al. 2009, ApJ, 703, 1672 [NASA ADS] [CrossRef] [Google Scholar]
- Kilborn, V. A., Forbes, D. A., Barnes, D. G., et al. 2009, MNRAS, 400, 1962 [NASA ADS] [CrossRef] [Google Scholar]
- Kilborn, V. A., Koribalski, B. S., Forbes, D. A., Barnes, D. G., & Musgrave, R. C. 2005, MNRAS, 356, 77 [NASA ADS] [CrossRef] [Google Scholar]
- Kourkchi, E., & Tully, R. B. 2017, ApJ, 843, 16 [NASA ADS] [CrossRef] [Google Scholar]
- Lee, J. C., Gil de Paz, A., Tremonti, C., et al. 2009, ApJ, 706, 599 [NASA ADS] [CrossRef] [Google Scholar]
- Lewis, I., Balogh, M., De Propris, R., et al. 2002, MNRAS, 334, 673 [NASA ADS] [CrossRef] [Google Scholar]
- Makarov, D., & Karachentsev, I. 2011, MNRAS, 412, 2498 [NASA ADS] [CrossRef] [Google Scholar]
- Malin, D. F., & Carter, D. 1983, ApJ, 274, 534 [NASA ADS] [CrossRef] [Google Scholar]
- Mamon, G. A. 1992, ApJ, 401, L3 [NASA ADS] [CrossRef] [Google Scholar]
- Mancillas, B., Duc, P.-A., Combes, F., et al. 2019, A&A, 632, A122 [NASA ADS] [CrossRef] [EDP Sciences] [Google Scholar]
- Marino, A., Bianchi, L., Rampazzo, R., Buson, L. M., & Bettoni, D. 2010, A&A, 511, A29 [NASA ADS] [CrossRef] [EDP Sciences] [Google Scholar]
- Marino, A., Rampazzo, R., Bianchi, L., et al. 2011a, MNRAS, 411, 311 [NASA ADS] [CrossRef] [Google Scholar]
- Marino, A., Bianchi, L., Rampazzo, R., et al. 2011b, Ap&SS, 335, 243 [NASA ADS] [CrossRef] [Google Scholar]
- Marino, A., Bianchi, L., Rampazzo, R., et al. 2011c, ApJ, 736, 154 [NASA ADS] [CrossRef] [Google Scholar]
- Marino, A., Plana, H., Rampazzo, R., et al. 2013, MNRAS, 428, 476 [NASA ADS] [CrossRef] [Google Scholar]
- Marino, A., Mazzei, P., Rampazzo, R., & Bianchi, L. 2016, MNRAS, 459, 2212 [NASA ADS] [CrossRef] [Google Scholar]
- Mazzei, P., Marino, A., Rampazzo, R., Galletta, G., & Bettoni, D. 2014a, Adv. Space Res., 53, 950 [Google Scholar]
- Mazzei, P., Marino, A., & Rampazzo, R. 2014b, ApJ, 782, 53 [NASA ADS] [CrossRef] [Google Scholar]
- Mazzei, P., Rampazzo, R., Marino, A., et al. 2019, ApJ, 885, 165 [CrossRef] [Google Scholar]
- Murugeshan, C., Kilborn, V., Obreschkow, D., et al. 2019, MNRAS, 483, 2398 [CrossRef] [Google Scholar]
- Oh, S. H., Kim, W.-T., & Lee, H. M. 2015, ApJ, 807, 73 [NASA ADS] [CrossRef] [Google Scholar]
- Paccagnella, A., Vulcani, B., Poggianti, B. M., et al. 2016, ApJ, 816, L25 [NASA ADS] [CrossRef] [Google Scholar]
- Panuzzo, P., Vega, O., Bressan, A., et al. 2007, ApJ, 656, 206 [NASA ADS] [CrossRef] [Google Scholar]
- Panuzzo, P., Rampazzo, R., Bressan, A., et al. 2011, A&A, 528, A10 [NASA ADS] [CrossRef] [EDP Sciences] [Google Scholar]
- Parkash, V., Brown, M. J. I., Jarrett, T. H., Fraser-McKelvie, A., & Cluver, M. E. 2019, MNRAS, 485, 3169 [CrossRef] [Google Scholar]
- Pearson, S., Besla, G., Putman, M. E., et al. 2016, MNRAS, 459, 1827 [NASA ADS] [CrossRef] [Google Scholar]
- Phillips, M. M., Jenkins, C. R., Dopita, M. A., Sadler, E. M., & Binette, L. 1986, AJ, 91, 1062 [NASA ADS] [CrossRef] [Google Scholar]
- Poggianti, B. M., von der Linden, A., De Lucia, G., et al. 2006, ApJ, 642, 188 [NASA ADS] [CrossRef] [Google Scholar]
- Ramella, M., Geller, M. J., Pisani, A., & da Costa, L. N. 2002, AJ, 123, 2976 [NASA ADS] [CrossRef] [Google Scholar]
- Rampazzo, R. 1988, A&A, 204, 81 [NASA ADS] [Google Scholar]
- Rampazzo, R., Plana, H., Longhetti, M., et al. 2003, MNRAS, 343, 819 [NASA ADS] [CrossRef] [Google Scholar]
- Rampazzo, R., Panuzzo, P., Vega, O., et al. 2013, MNRAS, 432, 374 [NASA ADS] [CrossRef] [Google Scholar]
- Rampazzo, R., Mazzei, P., Marino, A., et al. 2017, A&A, 602, A97 [NASA ADS] [CrossRef] [EDP Sciences] [Google Scholar]
- Rampazzo, R., Mazzei, P., Marino, A., et al. 2018, Ap&SS, 363, 80 [CrossRef] [Google Scholar]
- Rampazzo, R., Omizzolo, A., Uslenghi, M., et al. 2020, A&A, 640, A38 [CrossRef] [EDP Sciences] [Google Scholar]
- Ribeiro, A. L. B., de Carvalho, R. R., Capelato, H. V., & Zepf, S. E. 1998, ApJ, 497, 72 [NASA ADS] [CrossRef] [Google Scholar]
- Roming, P. W. A., Kennedy, T. E., Mason, K. O., et al. 2005, Space Sci. Rev., 120, 95 [NASA ADS] [CrossRef] [Google Scholar]
- Rossa, J., & Dettmar, R. J. 2003, A&A, 406, 505 [NASA ADS] [CrossRef] [EDP Sciences] [Google Scholar]
- Roy, J.-R., & Walsh, J. R. 1986, MNRAS, 223, 39 [NASA ADS] [CrossRef] [Google Scholar]
- Ryan-Weber, E. V., Webster, R. L., & Staveley-Smith, L. 2003, MNRAS, 343, 1195 [NASA ADS] [CrossRef] [Google Scholar]
- Schawinski, K., Kaviraj, S., Khochfar, S., et al. 2007, ApJS, 173, 512 [NASA ADS] [CrossRef] [Google Scholar]
- Serra, P., Oosterloo, T., Morganti, R., et al. 2012, MNRAS, 422, 1835 [Google Scholar]
- Tago, E., Einasto, J., Saar, E., et al. 2008, A&A, 479, 927 [NASA ADS] [CrossRef] [EDP Sciences] [Google Scholar]
- Tal, T., van Dokkum, P. G., Nelan, J., & Bezanson, R. 2009, AJ, 138, 1417 [NASA ADS] [CrossRef] [Google Scholar]
- Tandon, S. N., Subramaniam, A., Girish, V., et al. 2017, AJ, 154, 128 [NASA ADS] [CrossRef] [Google Scholar]
- Tody, D. 1986, in The IRAF Data Reduction and Analysis System, ed. D. L. Crawford, SPIE Conf. Ser., 627, 733 [NASA ADS] [Google Scholar]
- Toomre, A., & Toomre, J. 1972, ApJ, 178, 623 [Google Scholar]
- Trinchieri, G., Noris, L., & di Serego Alighieri, S. 1997, A&A, 326, 565 [NASA ADS] [Google Scholar]
- Tully, R. B. 1988, Nearby Galaxies Catalog [Google Scholar]
- Tully, R. B. 2015, AJ, 149, 54 [NASA ADS] [CrossRef] [Google Scholar]
- Tully, R. B., & Fisher, J. R. 1988, Catalog of Nearby Galaxies [Google Scholar]
- Vega, O., Bressan, A., Panuzzo, P., et al. 2010, ApJ, 721, 1090 [NASA ADS] [CrossRef] [Google Scholar]
- Vulcani, B., Poggianti, B. M., Finn, R. A., et al. 2010, ApJ, 710, L1 [NASA ADS] [CrossRef] [Google Scholar]
- Weil, M. L., & Hernquist, L. 1993, ApJ, 405, 142 [NASA ADS] [CrossRef] [Google Scholar]
- Werk, J. K., Putman, M. E., Meurer, G. R., et al. 2010, AJ, 139, 279 [NASA ADS] [CrossRef] [Google Scholar]
Appendix A: Dorado members
The Dorado group is indicated as PGC1 14765, that is with the PGC (Principal Galaxy Catalogue) number of the main galaxy NGC 1553 in Kourkchi & Tully (2017) and counts 31 members. They are indicated with the number N, reported in column 1 of Table A.1. From this list we removed 2MASXJ04105983-5628496, which corresponds to NGC 1536, which is already present in the list, reducing the number of members to 30. In Table A.1 we add PGC 75125 from the Firth et al. (2006) Dorado sample to the re-defined Kourkchi & Tully (2017) list. PGC 75125 is in the same frame as IC 2058 (see Table 1 and Fig. 1) and is a physical companion of this galaxy.
Dorado members.
From the Kourkchi & Tully (2017) paper, the table reports:
member number (column 1);
Right Ascension (column 2);
Declination (column 3);
PGC number (column 4);
Galaxy name (column 5);
Morphological Type (column 6);
the total apparent B-band magnitude (column 7);
the total apparent Ks-band magnitude (column 8);
the logarithm of the total apparent Ks-band magnitude in solar luminosity (column 9);
the heliocentric recession velocity (column 10);
the galaxy distance in Mpc and the percentage error (column 11).
The distribution of the morphological type and of the heliocentric velocity are shown in Fig. A.1.
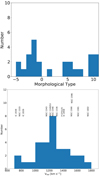 |
Fig. A.1. From top to bottom, morphological type (only 26/31 objects in Table A.1 have a morphological classification) and heliocentric velocity distribution of Dorado members in Table A.1. Members included in this study are indicated in correspondence with their heliocentric velocity. |
Appendix B: Comparison with the literature
Only one galaxy, NGC 1566, in our sample has been previously observed in the same band. Hoopes et al. (2001) and Kennicutt et al. (2009) performed Hα and Hα+[N II] imaging of the entire galaxy, respectively. Hoopes et al. (2001) observed at the CTIO 0.9m telescope using Hα 6602/20 filter and an R-band filter to remove the stellar continuum. The 6602/20 filter, centred at λ = 6596 Å has a FWHM = 18 Å and a transmission of 70% at the central wavelength. As a consequence, the [NII] emission does not contaminate the measure. The paper reports the Hα luminosity LHα = 31.65 ± 0.6×1033 W (adopting a distance of 17.49 Mpc). This is equivalent to a flux of 880 × 10−14 erg s−1 cm−2.
In their Table 1, Kennicutt et al. (2009) reported a measure of log(Hα+[N II]) = −10.9 ± 0.1 erg s−1 cm−2 corresponding to a Hα+[N II] flux of 1318 × 10−14erg s−1 cm−2.
Kennicutt et al. (2009) adopted the [NII]/Hα = 0.62 ± 0.06 ratio to correct for the [NII] emission obtained by Hawley & Phillips (1980) from the study of three H II regions. Roy & Walsh (1986) performed long-slit scanning spectroscopy at low resolution (Δλ = 0.7 Å) covering a rectangular region of 120″ × 16″ positioned on the NW spiral arm of NGC 1566. They measured the lines fluxes in five H II regions. From their work we derived the average ratio of [NII]/Hα = 0.38, which is significantly reduced with respect to that found by Hawley & Phillips (1980).
Assuming as the net Hα flux the value of Hoopes et al. (2001), the Hα+[N II] flux is 1425.6 ± 50.2 ×10⁻¹⁴ erg s−1 cm−2 and 1214.4 ± 33.4 ×10⁻¹⁴ erg s−1 cm−2 adopting the Hawley & Phillips (1980) and Roy & Walsh (1986) [NII]/Hα ratios, respectively.
We conclude that our value 1246.7 ± 125.1 × 10⁻¹⁴ erg s−1 cm−2 (Table 2) agrees, within errors, with both the Hoopes et al. (2001) Hα estimate, once adopted the Roy & Walsh (1986) [NII]/Hα ratio, and with the Hα+[N II] measure by Kennicutt et al. (2009).
Appendix C: Images in the continuum and in the Hα+[N II] filter
We present here the images of the galaxies observed in Hα+[N II]. For galaxies larger than the du Pont FOV (8 85 × 8
 85) we obtained a mosaic of images. Left and right panels show continuum and Hα images, respectively. Stellar residuals, sometimes present in the Hα images due to bright stars, were removed.
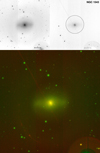 |
Fig. C.2. As in Fig. 3 but for NGC 1543. Labels A, B, and C (top right panel) indicate emission areas along the outer ring of the galaxy. The total flux in the ring is 3.72 ± 0.37 × 10⁻¹⁴ erg s−1 cm−2 . The image size is 8′×8′. |
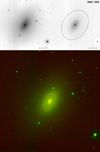 |
Fig. C.5. As in Fig. 3 but for NGC 1553. The image size is 7′×7′. Two Hα-bright regions are shown in detail in Fig. 9. |
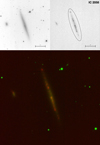 |
Fig. C.6. As in Fig. 3 but for IC 2058. The image size is 5′×5′. The physical companion of IC 2058, PGC 75125, is visible east of the galaxy. |
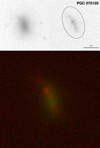 |
Fig. C.7. As in Fig. 3 but for PGC 75125. The image size is 50″ × 50″. The galaxy is classified as spiral (T = 5 ± 3) in HyperLeda. In the continuum the galaxy structure appears boxy and without spiral arms. The Hα+[NII] image shows a warped, clumpy star forming lane crossing the galaxy. |
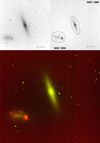 |
Fig. C.10. As in Fig. 3 but for the physical pair (Bureau & Chung 2006) formed by NGC 1596 (NW) and NGC 1602 (SE). The image size is 7′×7′. |
All Tables
All Figures
|
Fig. 1. Projected distribution of the Dorado group member galaxies (see Appendix A). Galaxies labeled are those investigated in the present Hα+[N II] study. Galaxies are indicated according to their B-band absolute magnitude and morphological type. Fields covered by the du Pont and Swope pointings, listed in Table 1, are indicated in grey. |
| In the text | |
|
Fig. 2. Transmission profiles of the narrow band filters on and off the Hα line. Observed galaxies are indicated as dots on the Hα+[N II] filter at the wavelength given by their heliocentric recession velocity. |
| In the text | |
|
Fig. 3. Pair IC2038 (NW) and IC2039 (SE) in continuum (top left panel) and in the Hα+[NII] light (top right panel). The image size is 4′×4′. North is towards the top, and east is to the left. Residuals of stars have been masked. The ellipse, whose parameters are given in Table 2, encloses the integration area. The bottom panel shows a two-colour image of the pair (continuum in green and Hα+[N II] in red) that highlights a large numbers of brights HII regions. |
| In the text | |
|
Fig. 4. As in Fig. 3 but for NGC 1533. Labels A and B indicate H II complexes (see text). The image size is 7′×7′. |
| In the text | |
|
Fig. 5. Hα+[NII] EW growth curve of each galaxy measured in concentric elliptical apertures out to the value of the elliptical aperture given in Table 2 and shown in Figs. 3 and 4 and in Appendix B (Figs. C.1–C.10). ETGs are indicated in red, LTGs in blue. Morphological classifications are from HyperLeda. |
| In the text | |
|
Fig. 6. Integrated value of Hα+[NII] EW for our targets as a function of their morphological type. Our values are compared with the mean and the median for the late-type galaxy sample studied by James et al. (2004). |
| In the text | |
|
Fig. 7. Hα SFR of Dorado galaxies as a function of their morphological type. For LTGs (0 ≤ Type ≤ 10) the red line and the blue dotted lines represent the mean and the median SFR computed on a sample of 334 galaxies by James et al. (2004). For ETGs (−5≤ Type < 0) the magenta and cyan squares represent the SFR of detected objects (55/147), representative of the whole ATLAS3D survey, by Gavazzi et al. (2018). These latter authors divided ETGs into two families of elliptical (Type = −5) and S0s (Type = −2). Our values (green diamonds) are reported in Table 3. |
| In the text | |
|
Fig. 8. NGC 1553: Hα monochromatic map obtained from Fabry-Perot (Rampazzo et al. 2003) overplotted to the present Hα+[N II] contours. The Hα emission is clumpy and extends for about 30″. We note that the Hα peak is displaced from the Hα+[N II] centre and corresponds to the X-ray source Chandra CXOU J041610.5-554646.8. |
| In the text | |
|
Fig. 9. [CMI2001]4136-01 (RA = 04 16 15.1 Dec = −55 41 51 J2000) is a region northeast of NGC 1553 that has been detected by GALEX. A zoom on this area is shown in the continuum (left panel) and in Hα+[N II] (right panel). The FOV is 2′ × 2′. In the centre of the field, two H II regions are clearly visible in Hα+[N II] frame, while objects are barely detected in the continuum. |
| In the text | |
|
Fig. 10. Left panel: southeast region of NGC 1533 shown in the continuum nearby Hα. The two areas of 60″×60″ inserted in the panel mark the position of H II regions revealed by our Hα+[N II] observations, E1+ E2 (04 10 13.5 −56 11 36 J2000) and E4 (04 10 10.66 −56 07 27.99 J2000) and shown in the two right panels. These H II regions were first identified by Werk et al. (2010). |
| In the text | |
|
Fig. A.1. From top to bottom, morphological type (only 26/31 objects in Table A.1 have a morphological classification) and heliocentric velocity distribution of Dorado members in Table A.1. Members included in this study are indicated in correspondence with their heliocentric velocity. |
| In the text | |
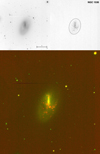 |
Fig. C.1. As in Fig. 3 but for NGC 1536. The image size is 5′×5′. |
| In the text | |
|
Fig. C.2. As in Fig. 3 but for NGC 1543. Labels A, B, and C (top right panel) indicate emission areas along the outer ring of the galaxy. The total flux in the ring is 3.72 ± 0.37 × 10⁻¹⁴ erg s−1 cm−2 . The image size is 8′×8′. |
| In the text | |
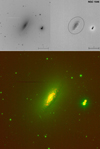 |
Fig. C.3. As in Fig. 3 but for NGC 1546. The image size is 5′×5′. |
| In the text | |
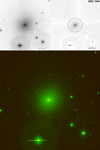 |
Fig. C.4. As in Fig. 3 but for NGC 1549 The image size is 8′ × 8′. |
| In the text | |
|
Fig. C.5. As in Fig. 3 but for NGC 1553. The image size is 7′×7′. Two Hα-bright regions are shown in detail in Fig. 9. |
| In the text | |
|
Fig. C.6. As in Fig. 3 but for IC 2058. The image size is 5′×5′. The physical companion of IC 2058, PGC 75125, is visible east of the galaxy. |
| In the text | |
|
Fig. C.7. As in Fig. 3 but for PGC 75125. The image size is 50″ × 50″. The galaxy is classified as spiral (T = 5 ± 3) in HyperLeda. In the continuum the galaxy structure appears boxy and without spiral arms. The Hα+[NII] image shows a warped, clumpy star forming lane crossing the galaxy. |
| In the text | |
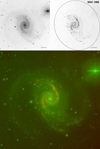 |
Fig. C.8. As in Fig. 3 but for NGC 1566. The image size is 10′×10′. |
| In the text | |
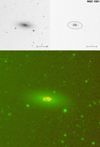 |
Fig. C.9. As in Fig. 3 but for NGC 1581. The image size is 5′×5′. |
| In the text | |
|
Fig. C.10. As in Fig. 3 but for the physical pair (Bureau & Chung 2006) formed by NGC 1596 (NW) and NGC 1602 (SE). The image size is 7′×7′. |
| In the text | |
Current usage metrics show cumulative count of Article Views (full-text article views including HTML views, PDF and ePub downloads, according to the available data) and Abstracts Views on Vision4Press platform.
Data correspond to usage on the plateform after 2015. The current usage metrics is available 48-96 hours after online publication and is updated daily on week days.
Initial download of the metrics may take a while.