Fig. 7.
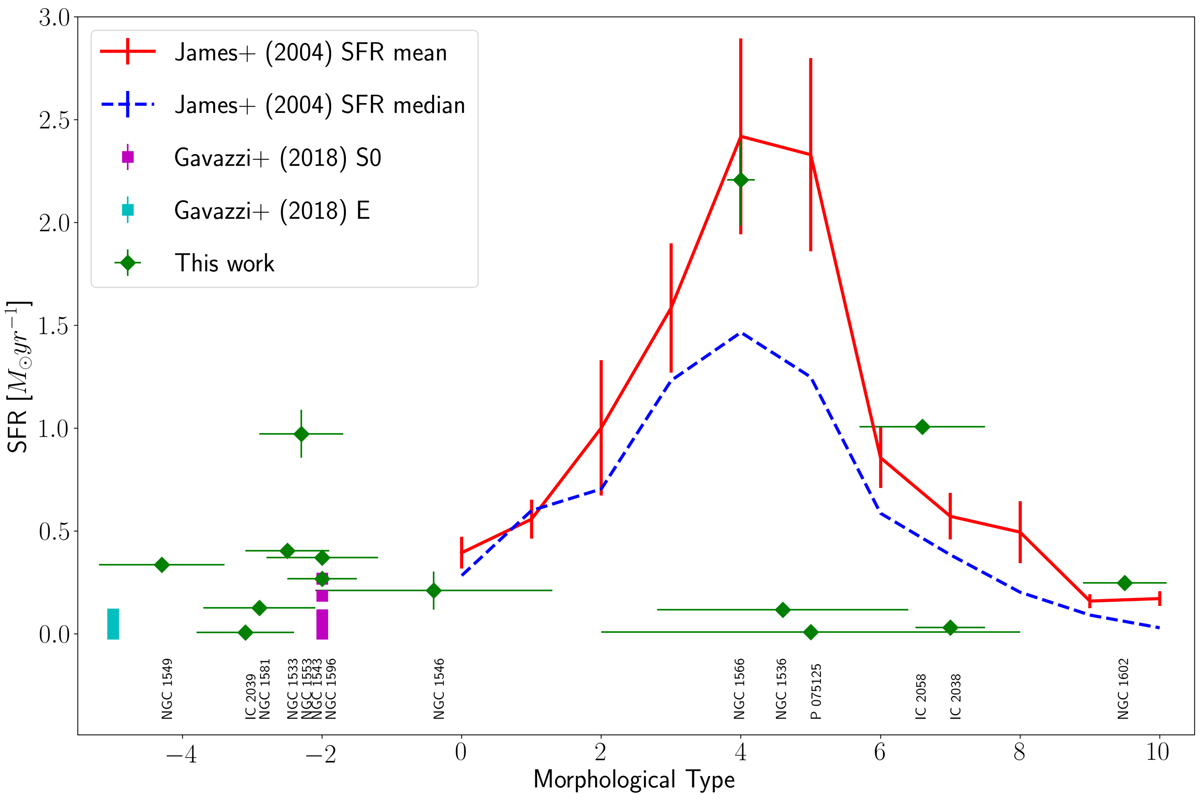
Hα SFR of Dorado galaxies as a function of their morphological type. For LTGs (0 ≤ Type ≤ 10) the red line and the blue dotted lines represent the mean and the median SFR computed on a sample of 334 galaxies by James et al. (2004). For ETGs (−5≤ Type < 0) the magenta and cyan squares represent the SFR of detected objects (55/147), representative of the whole ATLAS3D survey, by Gavazzi et al. (2018). These latter authors divided ETGs into two families of elliptical (Type = −5) and S0s (Type = −2). Our values (green diamonds) are reported in Table 3.
Current usage metrics show cumulative count of Article Views (full-text article views including HTML views, PDF and ePub downloads, according to the available data) and Abstracts Views on Vision4Press platform.
Data correspond to usage on the plateform after 2015. The current usage metrics is available 48-96 hours after online publication and is updated daily on week days.
Initial download of the metrics may take a while.