| Issue |
A&A
Volume 664, August 2022
|
|
|---|---|---|
| Article Number | A192 | |
| Number of page(s) | 19 | |
| Section | Extragalactic astronomy | |
| DOI | https://doi.org/10.1051/0004-6361/202243726 | |
| Published online | 30 August 2022 | |
Dorado and its member galaxies
III. Mapping star formation with FUV imaging from UVIT⋆
1
INAF – Osservatorio Astrofisico di Asiago, Via dell’Osservatorio 8, 36012 Asiago, Italy
e-mail: This email address is being protected from spambots. You need JavaScript enabled to view it.
2
INAF – Osservatorio Astronomico di Padova, Vicolo dell’Osservatorio 5, 35122 Padova, Italy
3
Dept. of Physics & Astronomy, The Johns Hopkins University, 3400 N. Charles St., Baltimore, MD 21218, USA
4
University of Calgary, 2500 University Drive NW, Calgary, Alberta, Canada
5
INAF – Osservatorio Astronomico di Capodimonte, Salita Moiariello 16, 80131 Napoli, Italy
6
Department of Physics and Astronomy “G. Galilei”, University of Padova, Vicolo dell’Osservatorio 3, 35122 Padova, Italy
Received:
6
April
2022
Accepted:
30
May
2022
Abstract
Context. We are investigating the star formation in galaxies of the actively evolving Dorado group where, for a large fraction of both early- and late-type galaxies, signatures of interactions and merging events are revealed by optical and radio observations.
Aims. Our previous Hα+[N II] study, probing ≈10 Myr timescales, suggested that star formation is still ongoing in early-type galaxies. In this work, we use far-UV (FUV) imaging to map recent star formation on longer timescales, on the order of 100 Myr.
Methods. We used the Ultraviolet Imaging Telescope UVIT on board Astrosat to image the galaxies of the Dorado backbone previously observed in Hα+[N II], with the far-UV filter FUV.CaF2 (1300–1800 Å). The sample included NGC 1536, NGC 1546, NGC 1549, [CMI2001]4136-01, NGC 1553, IC 2058, PGC 75125, NGC 1566, NGC 1596, and NGC 1602; for the two latter galaxies, the UVIT data provided the first view in far-UV. For the others, previously observed by GALEX, the UVIT data afford a ∼5× improvement in spatial resolution.
Results. FUV.CaF2 emission is revealed in all the Dorado galaxies observed, tracing young stellar populations in ring structures and showing tidal distortions. The Sérsic index, derived by fitting the luminosity profiles, is always n < 3, suggesting that the FUV.CaF2 emission originates from a disk also in early-type galaxies. The star formation rate (SFR) ranges from 0.004 ± 0.001 M⊙ yr−1 for [CMI2001]4136-01 to 2.455 ± 0.027 M⊙ yr−1 for NGC 1566. Most of the recent star formation is found at the periphery of the Dorado group, where most of late-type galaxies are located. For these galaxies, the ratio SFRHα/SFRFUV.CaF2 is close to 1, except for the edge-on IC 2058, similar to previously reported relations for local volume samples. For early-type galaxies, however, SFRHα is about 15 times higher than SFRFUV. Dorado’s early-type galaxies define a separate locus in SFRFUV, SFRHα space with respect to the late-type galaxies, which is well represented by the relation log (SFRFUV.CaF2) = 0.70 × log (SFRHα)−1.26.
Conclusions. The disk structure of the FUV.CaF2 emitting populations discovered in all the early-types galaxies implies dissipative processes and wet merging events. The systematic discrepancy between SFRs derived from Hα and FUV fluxes suggests that rejuvenation episodes in early-type galaxies cannot sustain constant star formation over ∼100 Myr timescales.
Key words: ultraviolet: galaxies / galaxies: elliptical and lenticular, cD / galaxies: spiral / galaxies: interactions / galaxies: evolution
The data set is only available at the CDS via anonymous ftp to cdsarc.u-strasbg.fr (130.79.128.5) or via http://cdsarc.u-strasbg.fr/viz-bin/cat/J/A+A/664/A192
© R. Rampazzo et al. 2022
 Open Access article, published by EDP Sciences, under the terms of the Creative Commons Attribution License (https://creativecommons.org/licenses/by/4.0), which permits unrestricted use, distribution, and reproduction in any medium, provided the original work is properly cited.
This article is published in open access under the Subscribe-to-Open model. This email address is being protected from spambots. You need JavaScript enabled to view it. to support open access publication.
1. Introduction
In the local supercluster (LS, ≤3500 km s−1) (de Vaucouleurs 1953), galaxy groups play an important role in galaxy evolution. Kourkchi & Tully (2017) suggest that, considering the infall domain of the LS, only a small fraction of the galaxy mass resides within clusters. Virgo, Fornax, and Antlia associations with an infall mass of 7 × 10¹⁴ M⊙, 2 × 10¹⁴ M⊙, and 4 × 10¹⁴ M⊙ respectively, contain 60%, 30%, and 15% of their mass already collapsed within the cluster (Kourkchi & Tully 2017). This evidence suggests that a large fraction of galaxies in the LS are still evolving within small galaxy associations, making the study of groups critical in order to understand galaxy evolution.
Before groups fall into clusters, they collapse under gravity and form substructures, where their galaxy members undergo morphological transformations, as for early-type galaxies (ETGs), and start to quench. A number of studies show that ETGs are more strongly clustered than late-type galaxies (LTGs) (Davis & Geller 1976; Dressler 1980). Boselli & Gavazzi (2014) reviewed some of the mechanisms driving galaxy evolution as a function of the environment. Such mechanisms transform field galaxies (i.e., LTGs) into cluster-like galaxies (i.e., ETGs), and drive groups from an ‘active’ (star-forming) phase, typical of the field, (see e.g., Marino et al. 2016; Rampazzo et al. 2018) to a more ‘passive’ phase, typical of the clusters. It is widely accepted that cluster galaxies tend to have depressed star formation (SF) in comparison to field galaxies (see e.g., Bressan et al. 2006; Poggianti et al. 2006; Rampazzo et al. 2013, and references therein). At least part of the galaxy transformation happens at densities typical of the groups (i.e., groups operate a galaxy pre-processing). We are investigating galaxy groups, from local group analogs (Marino et al. 2010, 2013, 2014) to very evolved groups, such as the NGC 5486 group (Marino et al. 2016), using a multi-wavelength approach in order to understand their evolution and explore the connection between their galaxy population and their activity. This paper continues our study for optical wavelengths (Cattapan et al. 2019), Hα (Rampazzo et al. 2020, hereafter Ram2020), and FUV wavelengths (Rampazzo et al. 2021, hereafter Ram2021), of the Dorado group and its substructures.
Dorado is a nearby (17.69 Mpc) group in the Southern Hemisphere (RA = 64.3718 deg, Dec = −55.7811 deg). We adopt the member list defined by Firth et al. (2006, and references therein) and Kourkchi & Tully (2017) (see Table A.1 of Ram2020). Figure 1 shows the projected distribution of Dorado members, indicating their morphological class and B-band magnitude. Multi-wavelength data, from FUV to optical and radio, converge in presenting Dorado as a strongly evolving group of galaxies in the LS. A large fraction of Dorado members, including ETGs, shows either merging or interaction signatures in their structures (Sect. 2 in Ram2020). Residual SF is seen in bright ETGs that populate the red sequence, as well as in intermediate luminosity members still crossing the green valley of the UV-optical colour magnitude diagram of the group (see Fig. 1 in Cattapan et al. 2019).
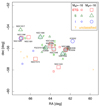 |
Fig. 1. Projected distribution of Dorado galaxy members according to Firth et al. (2006) and Kourkchi & Tully (2017). Members are labelled according to their morphology and B-Band magnitude provided by HyperLeda. UVIT FUV.CaF2 fields listed in Table 1 are enclosed by a light-green circle that has the diameter of the UVIT field (28′). Target galaxies within each field are also labelled. The morphological, photometric, and star-forming properties obtained from the UVIT FUV.CaF2 data set about NGC 1533, and IC 2038 and IC 2039, shown as dark-grey circles in the figure, have been presented and discussed in Ram2021. Ram2020 also observed NGC 1581 and NGC 1543 in Hα+[N II]. All galaxies except NGC 1596 and NGC 1602 have been already observed with GALEX at lower resolution and sensitivity (see e.g., Marino et al. 2011a,b). |
Dorado has a clumpy structure (Firth et al. 2006) with respect to evolved groups, such as NGC 5486 (Marino et al. 2016). Iovino (2002) found that the central part of Dorado forms a compact group, namely SGC 0414−5559, composed of the brightest galaxies at the peak of the velocity distribution (Table A.1 in Ram2020). This structure, the core of Dorado, is formed by NGC 1546, NGC 1549, NGC 1553, and IC 2058. Compact groups are the ideal sites for studying galaxy interactions and mergers, given the high space density and low-velocity dispersions of their galaxies (Mamon 1992). From N-body simulations, Diaferio et al. (1994) proposed that compact groups continuously form within loose groups during their collapse and virialization phase. There is much observational evidence that compact groups are found within looser structures or rich neighbourhoods (see e.g., Ribeiro et al. 1998, and references therein). Diaferio et al. (1994) simulations suggested that the life time of the compact groups is about 1 Gyr and that most of the simulated member galaxies are not merger remnants. More recently, semi-analytic simulations (SAMs) by Díaz-Giménez et al. (2021) have suggested a late assembly for the compact groups that may host merger remnants. This could be the case of SGC 0414−5559 in Dorado, since both NGC 1549 and NGC 1553 show a wide shell system (Malin & Carter 1983).
Some peripheral substructures have been found in Dorado, such as the triplet formed by NGC 1533, IC 2039 and IC 2039 (Cattapan et al. 2019), south-east of the compact group. Pair-like structures such as NGC 1566 and NGC 1581 (Kendall et al. 2015; Oh et al. 2015), and NGC 1596 and NGC 1602 (Bureau & Chung 2006; Chung et al. 2006) are found north-west of the compact group. Most of these galaxies show signatures of interaction as discussed by Ram2020.
A further indication that Dorado is at an early stage of evolution is the fact that it is still gas-rich, in comparison to evolved environments. The basic ingredients for SF, H I reservoirs, have been discovered in several Dorado members (Ryan-Weber et al. 2003; Kilborn et al. 2009; Elagali et al. 2019), with the exclusion of NGC 1549 and NGC 1553. Signatures of gas transfer between the LTG NGC 1602 and the ETG NGC 1596 have been detected (Chung et al. 2006). The fuel to ignite SF in the ring of the lenticular galaxy NGC 1581 (Ram2020) may have been stripped by the interaction (Oh et al. 2015; Kendall et al. 2015) with NGC 1566.
Ram-pressure stripping signatures of H I have been detected in NGC 1566 (Elagali et al. 2019). This is particularly interesting since the galaxy is located at the periphery of the Dorado group. It has long been suggested that the presence of ram-pressure stripping removes gas from spirals in rich clusters (Gunn et al. 1972), but its efficiency was questioned in less rich environments (Abadi et al. 1999). Kantharia et al. (2005) revealed signatures in the radio continuum and 2 cm HI observations of both tidal interaction and ram-pressure stripping on spiral members of Holmberg 124, a poor group environment. Roberts et al. (2021) extended the search for jellyfish galaxies in low-density environments in the radio continuum domain, using the LOFAR Two-metre Sky Survey (LoTSS) project to investigate about 500 SDSS groups (z < 0.05). They find that jellyfish galaxies are most commonly found in clusters, with the frequency decreasing towards the lowest mass groups. Vulcani et al. (2021) provided a panorama about different processes taking place in low-density environments, including ram-pressure stripping, using VLT/MUSE optical data. The GALaxy evolution EXplorer (GALEX hereafter) (Martin et al. 2005; Morrissey et al. 2007) was used to identify asymmetries, such as tails and jellyfish tentacles, by Smith et al. (2010) in Coma galaxies, as well as to study star formation in jellyfish tentacles in single objects in Virgo (see e.g., Hester et al. 2010, references therein). More recently, high spatial resolution FUV studies using Astrosat-UVIT investigated ram-pressure stripping in action in cluster jellyfish galaxies (George et al. 2018; Hota et al. 2021).
This paper presents our study of the Dorado backbone based on Astrosat-UVIT FUV.CaF2 observations. We investigate the central compact group SGC 0414−5559 and two substructures, one formed by NGC 1566 and NGC 1581, and the other by NGC 1596 and NGC 1602. Target galaxies are listed in Table 1. We associated the FUV.CaF2 images with two deep optical g- and r-band wide field images of the Dorado group from the ESO-VLT Survey Telescope (VST hereafter, Schipani et al. 2012). Such images were obtained within the VEGAS survey of nearby ETGs (Capaccioli et al. 2015; Spavone et al. 2017). The plates used reach a surface brightness of 30.5 mag arcsec−2 in g-bands, and 29.0 mag arcsec−2 in r-bands, with a resolution of (0 21 px−1) and a total field of view of 1° ×1°. The full analysis of the optical data will be presented in a forthcoming companion paper (Ragusa et al., in prep.). We use VST images in order to compare the optical Rg29 and Rr28 galaxy radii at μg = 29 mag arcsec−2 and μr = 28 mag arcsec−2, respectively, with the distribution and the extension of the FUV.CaF2 emission.
Dorado galaxies observed with UVIT.
The plan of this paper is as follows. Section 2 presents target galaxies and provides the motivation for the UVIT study. In Sect. 3 we present FUV.CaF2 observations and the reduction techniques adopted. The morphological and photometric analyses performed and the determination of star formation rate (SFR) from the FUV.CaF2 integrated galaxy luminosity are detailed in Sect. 4. The FUV.CaF2 properties of individual galaxies are presented and summarized in Sect. 5. We discuss in Sect. 6 the FUV.CaF2 versus the optical extensions of our target galaxies. In Sect. 7 we discuss and compare the SFR from the FUV.CaF2 flux with the values obtained from the Hα flux by Ram2020. We summarize our results and draw some conclusions in Sect. 8.
2. The target galaxies and motivation for the FUV study
Ram2020 used Hα+[N II] imaging to derive the SFR of the Dorado backbone galaxies consisting of six LTGs, namely: IC 2038, NGC 1536, IC 2058, PGC 75125, NGC 1566, and NGC 1602, and eight ETGs, from Es to S0-a with a large fraction of S0s, namely: IC 2039, NGC 1533, NGC 1543, NGC 1546, NGC 1549, NGC 1553, NGC 1581, and NGC 1586. The LTG SFR ranges from 0.01 ± 0.001 to 2.2 ± 0.2 M⊙ yr−1. These values suggest that LTGs in Dorado have a large spread in the SFR compared with a general LTG sample (see e.g., James et al. 2004). The SFR of ETGs ranges from 0.008 ± 0.003 to 1.01 ± 0.10 M⊙ yr−1. The comparison with the ETGs sample of Gavazzi et al. (2018) suggests that the SF in Dorado ETGs are not yet shut down. Ram2020 proposes that mechanisms such as gas stripping and gas accretion, through galaxy–galaxy interaction, are relevant in this evolutionary phase of Dorado.
The measure of the SFR from Hα+[N II] imaging for ETGs is challenging due to the low Hα emission fluxes, which need both a careful continuum subtraction and [NII] line correction (see e.g., Gavazzi et al. 2018; Karachentsev & Kaisina 2013). This motivated us to complement the Ram2020 study by probing the SFR of the same Dorado members, using FUV.CaF2 (1300–1800 Å) observations obtained with Astrosat-UVIT. UVIT observations have been used in Ram2021 to study the south-west part of the group, which includes the substructure composed of NGC 1533, IC 2038, and IC 2039 (see Fig. 1).
This paper completes the UVIT FUV.CaF2 study of the Dorado backbone. Our targets map the Dorado central region (the SGC 0414−5559 compact group together with NGC 1536), and its north-east extension (Fig. 1) dominated by the pair NGC 1566 and NGC 1581, and the pair NGC 1596 and NGC 1602. Table 1 provides some relevant properties of the galaxies considered in this paper. All targets, except for NGC 1596 and NGC 1602, had been previously imaged in UV (FUV and Near UV (NUV) with GALEX, in a broad passband similar to the FUV.CaF2 UVIT filter used here, but at about five times lower resolution. Therefore, the new UVIT data are a significant improvement in resolution with respect to GALEX UV studies, as they probe the FUV morphology on about a 0.14 kpc scale (the typical size of SF complexes), and they are the first FUV view of these two galaxies.
3. Observations and data reduction
Astrosat is an X-ray – UV observatory launched by the Indian Space Research Organization on September 28, 2015. The Ultra-Violet Imaging Telescope facility UVIT (Tandon et al. 2017) is composed of two Ritchey-Chretien telescopes, each with a 37.5 cm aperture and a circular field of view with a diameter of 28′. Originally, one telescope observed FUV wavelengths (1300–1800 Å) and the other both NUV (2000–3000 Å) and optical band (VIS) wavelengths (3200–5500 Å), by means of a beam-splitter directing NUV and VIS to individual cameras.
The NUV detector is currently not working. Therefore, observations have been performed with the FUV channel only. We used the full field of view, in photon counting mode, with the Filter F148W CaF2 (λmean = 1481, Δλ = 500 Å). Photons are counted on a planar CMOS array at approximately 28 Hz and stacked to reconstruct the image (see for details Postma et al. 2011; Kumar et al. 2012; Postma & Lehay 2017; Tandon et al. 2017), with the astrometric world coordinate solution solved automatically by a trigonometric algorithm (Postma & Lehay 2020).
Table 2 compiles the relevant information on the Astrosat-UVIT observations obtained in two programmes: A05_002 and A07_010 (PI: R. Rampazzo). A05_002 covers the three members of the compact group SGC 0414-5559, namely NGC 1549 (Field C), NGC 1553 (Field D), and IC 2058 (Field E). The A07_010 programme observed the fourth member of the compact group NGC 1546 (Field B), and NGC 1536 (Field A), located south of the NGC 1533 substructure (see Ram2020). NGC 1536 has a recession velocity similar to that of the compact group. Observations of NGC 1566 (Field F) were obtained from the Astrosat archive (programme G06_087 PI S. Stalin). We used only the FUV.CaF2 observation for consistency with our programmes.
UVIT observations.
4. Data analysis
Images reconstructed from the photon-counting data with 0 416 sub-sampling were rebinned for our analysis, to enhance the signal-to-noise ratio (S/N) to 1
 664 px−1. The nominal zero point magnitude of the FUV.CaF2 filter is 18.08 mag (Tandon et al. 2017).
Surface photometry was performed using the ELLIPSE fitting routine in the STSDAS package of IRAF (Jedrzejewski 1987), increasing the size of the apertures logarithmically. Foreground and background objects were masked. The present UVIT FUV.CaF2 observations allow surface brightness profiles to be measured down to μFUV ∼ 29 − 30 mag arcsec−2, with an error of ±0.3–0.5 mag arcsec−2.
We applied the procedure outlined by Ebeling et al. (2006), ASMOOTH, to enhance the S/N in the galaxy outskirts, in order to bring out faint structures in the UV image. The only parameter required by the procedure is the minimum S/N, τmin. The algorithm increases the smoothing scale until the S/N within the kernel reaches the τmin input value. ASMOOTH suppresses very efficiently the noise, while the signal, which is locally significant at the selected S/N level, is preserved on all scales.
4.1. Integrated magnitudes and surface photometry
We derived apparent magnitudes by integrating the surface brightness within elliptical isophotes. The ELLIPSE task defines the elliptical contours of the isophotes and accounts for the geometrical information contained within them, allowing the variation of the ellipticity, ϵ = 1 − b/a, and position angle, PA, along the ellipse major axis, a. The task also provides a measure of the isophotal shape parameter, the so-called a4 parameter from the fourth cosine component of the Fourier analysis of the fitted ellipse, allowing us to distinguish between boxy (a4 < 0) and disky (a4 > 0) isophotes (Bender et al. 1988). ELLIPSE, widely applied to optical images of ETGs, was used by Jeong et al. (2009) and Marino et al. (2011b) in order to obtain the surface photometry of ETGs from GALEX FUV data. Since irregular and peculiar features, such as clumps expected in FUV images, induce sudden variations in both ϵ and PA, we notice that the isophotal shape parameter, a4, loses its physical meaning. For this reason in Table 3, which collects the relevant parameters derived by our FUV.CaF2 surface photometry, we provide only the average ellipticity ⟨ϵ⟩ and position angle ⟨PA⟩ (Cols. (4) and (5) respectively).
Integrated magnitudes of Dorado in UVIT FUV.CaF2.
We estimated magnitude uncertainty by propagating the statistical errors on the isophotal intensity. Table 3 (Col. (3)) provides the FUV CaF2-1, UVIT integrated magnitudes, corrected for Galactic foreground extinction as in Ram2021. The comparison with the current literature (Table 1) is shown in Fig. 2 and discussed in Sect. 5.
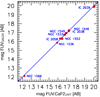 |
Fig. 2. Comparison with the FUV GALEX magnitudes reported in Table 1. The comparison includes galaxies in Ram2021, namely NGC 1533, IC 2038, and IC 2039, whose magnitudes are corrected for foreground Galactic extinction as described in their Table 3. |
FUV.CaF2 images are shown in the top left panel of Figs. 4–11. Irregular and peculiar features are shown by NGC 1536, PGC 75125, IC 2058, and CMI[2001]4136-01. Spiral arms are visible in NGC 1546 and NGC 1566.
The UV surface photometry of NGC 1553 has been investigated by Marino et al. (2011b) with GALEX. Figure 3 compares our UVIT luminosity profile with that of Marino et al. (2011b). The profiles are consistent. GALEX FUV point spread function (PSF) full width at half maximum (FWHM) is 4 2 (Morrissey et al. 2007) with respect to the nominal value of 1
 5 of UVIT (Tandon et al. 2017). We check our PSF using the star TYC 8505-1906-1, a single star in the Tycho II stellar catalogue, located in the UVIT field D, which includes NGC 1553. We fit the stellar profile with a 2D single Gaussian. The best fit provides a FWHMRA = 1
 68 and a FWHMDec = 1
 47, meaning the stellar image has an ellipticity of 0.13. Therefore, the FWHM value is consistent with the nominal value measured by Tandon et al. (2017).
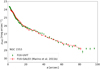 |
Fig. 3. UVIT FUV.CaF2 luminosity profile of NGC 1553 (green squares) compared with that of Marino et al. (2011b) from FUV-GALEX observations. The UVIT image of NGC 1553 was binned into 4 × 4 pixel bins. |
4.1.1. UVIT FUV.CaF2 versus GALEX FUV magnitudes
In Fig. 2 we compare our UVIT FUV.CaF2 asymptotic magnitudes, obtained by integrating the galaxy luminosity profiles (see Sect. 4.1) with the GALEX FUV asymptotic magnitudes reported in Table 1. The comparison includes Dorado members located in the NGC 1533 substructure, obtained in the same way as in Ram2021. UVIT FUV.CaF2 magnitudes agree with GALEX FUV magnitudes, as expected, given that the two filters have somewhat similar bandpasses.
4.1.2. Analysis of the FUV-CaF2-1 surface brightness profiles
We fit the azimuthal FUV-CaF2-1 surface brightness profiles of galaxies with a single Sérsic law (Sérsic 1963). We are aware that in some cases it represents a crude representation of the surface brightness profile. However, a simple Sérsic law provides useful information that can be compared with existing results for larger samples. The Sérsic law μ ∝ a1/n, where μ is the surface brightness, a the semi-major axis, and n the Sérsic index, is a generalization of the de Vaucouleurs et al. (1992)a1/4 and Freeman (1970) exponential laws. The value of n accounts for the variety of the shapes of the surface brightness profiles of ETGs, with n = 4 representing the ‘classic’ Elliptical’s shape. An exponential disk (Freeman 1970) has an index n = 1.
UV surface brightness profiles of ETGs may reach large values of n (see e.g., Marino et al. 2011b). Rampazzo et al. (2017), by comparing UV and optical data from Swift-UVOT of eleven EGTs, suggest that, if n < 3, the presence of a disk starts to emerge. The value n < 2.5 is also adopted in optical surveys to isolate disk galaxies (see e.g., Meert et al. 2015).
The Sérsic law fit is shown in the top right panels of Figs. 4–11, superposed on the UVIT FUV.CaF2 surface brightness profiles. The fit, which accounts for the UVIT-PSF, is extended to the whole profile up to the background. We did not mask FUV bright substructures such as the bar in NGC 1536 or the knots in IC 2058 and NGC 1602. The values of the Sérsic index obtained from the fits are collected in Col. (6) of Table 3.
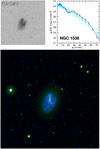 |
Fig. 4. Top left panel: UVIT FUV.CaF2 image of NGC 1536. The image size is 7′×7′. North is on the top, and east is to the left. Top right panel: UVIT FUV.CaF2 surface brightness profile (blue). The single Sérsic law is superposed (cyan) to fit the light profile. Bottom panel: colour composite RGB image of NGC 1536 using Hα+[N II] and nearby continuum images (from Ram2020) as red and green channels, and the FUV.CaF2 image as a blue channel. Both the Hα+[N II] and the continuum images have been re-sampled to the UVIT image resolution. |
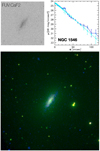 |
Fig. 5. As in Fig. 4 but for NGC 1546. The image size is 7′×7′. North is on the top and east is to the left. |
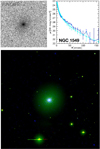 |
Fig. 6. As in Fig. 4 but for NGC 1549. The image size is 8′×8′. North is on the top and east is to the left. |
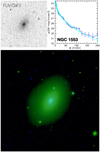 |
Fig. 7. As in Fig. 4 but for NGC 1553. The image size is 7′×7′. North is on the top and east is to the left. |
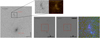 |
Fig. 8. Left panel: UVIT FUV.CaF2 image of CMI2001 in the field of NGC 1553. The size of the figure is 7′×7′. Top panels: zoom on the [CMI2001]4136-01 FUV.CaF2 region, 2′×2′ wide, before and after smoothing with ASMOOTH, and with τmin = 1.5. Bottom panels: [CMI2001]4136-01 image in continuum and Hα+[N II] adapted from Ram2020. The red square encloses the CMI2001 region. Bottom right panel: RGB colour composite image obtained from the continuum, Hα+[N II], and FUV images used as the green, red, and blue channels, respectively. |
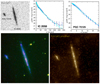 |
Fig. 9. Top left panel: UVIT FUV.CaF2 image of IC 2058 and PGC 75125 at the centre of the frame and at the east side, respectively. The image size is 5′×5′. North is on the top and east is to the left. Top central panel: FUV.CaF2 surface brightness profile (blue) of IC 2058 and (top right panel) of PGC 75125. The single Sérsic law is superposed (cyan) to fit the light profile. Bottom left panel: colour composite RGB image of IC 2058 and PGC 75125 as in Fig. 4. Bottom right panel: FUV.CaF2 image smoothed using the AMOOTH task, with τmin = 1.5. |
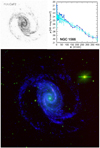 |
Fig. 10. As in Fig. 4 but for NGC 1566. The image size is 13′×13′. North is on the top and east is to the left. |
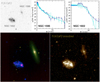 |
Fig. 11. Top left panel: UVIT FUV.CaF2 image of NGC 1596 (north-west) and NGC 1602 (south-east). The image size is 7′×7′. North is on the top and east is to the left. Top right panels: FUV.CaF2 surface brightness profiles of NGC 1596 and NGC 1602 (blue solid lines). The fit of a single Sérsic law is overlaid to the luminosity profile (cyan squares). Bottom left panel: colour composite RGB image of NGC 1596 and NGC 1602 as in Fig. 4. Bottom right panel: FUV.CaF2 image smoothed using ASMOOTH task, with τmin = 1.5. |
4.2. The recent SFR from FUV.CaF2 integrated galaxy luminosity
Both Hα and FUV luminosities trace recent SF, although they map slightly different age ranges. Kennicutt & Evans (2012, their Table 1) indicated an age range of 0–100 Myr and of 0–10 Myr for the stellar populations contributing to FUV and Hα, with mean ages of 10 and 3 Myr, respectively, although the age strongly depends on stellar metallicity (Bianchi 2011, her Fig. 5)
From the integrated FUV luminosity of Dorado members, we derived their recent SFR, following Lee et al. (2009, their Eq. (3)):
![Mathematical equation: $$ \begin{aligned} \mathrm{SFR} [M_\odot \,\mathrm{yr}^{-1}] = 1.4 \times 10^{-28}\,L_{\rm FUV}\,[\mathrm{erg\,s^{-1}\,Hz}^{-1}]. \end{aligned} $$](/articles/aa/full_html/2022/08/aa43726-22/aa43726-22-eq8.gif) (1)
(1)
The results are given in Col. (8) of Table 3. The Galactic extinction correction is AFUV = 7.9 × E(B − V) (Lee et al. 2009, see also Ram2021) using the E(B − V) values provided by Ram2020 in Table 3. No internal dust attenuation has been applied.
5. Results
Table 3 presents results derived from our FUV.CaF2 analysis, including luminosity scaled to the distance of 17.69 Mpc. In the following we discuss the results in terms of the galaxy type classification, which is revised here based on the FUV.CaF2 morphology and the Sérsic index.
NGC 1536. The FUV.CaF2 image (Fig. 4, top left panel) shows the irregular arm structure of this barred spiral galaxy (SBc, according to HyperLeda). We can clearly see its off-centre bar. The average FUV.CaF2 ⟨PA⟩ = 162° is consistent with the optical one at R25 (Table 1). The average ellipticity (⟨ϵ⟩ = 0.40, Table 3) differs from the optical one (0.28, Table 1) due to ellipticity variations of the FUV.CaF2 emission.
The index obtained from the Sersic law fit, n = 0.76 ± 0.02, suggests the presence of a disk. The H II regions found by Ram2020 stand out in red in Fig. 4. They are distributed along the brightest features of the FUV.CaF2 emission (bar and arm segments), although the FUV.CaF2 emission is more diffuse and extended (see also Sect. 6).
At 30 mag arcsec−2 the FUV.CaF2 luminosity profile extends up to 70″, well outside  , the R25 isophote in the B-band. We notice, however, the larger extension of the R-band continuum (green) with respect to FUV.CaF2 emission (blue) in the bottom panel of Fig. 4.
NGC 1546. This galaxy (Fig. 5) has un uncertain classification. Comerón et al. (2014) classify it as E(b)3/(R′)SA(r)ab. This means it could be either an ETG, as suggested by HyperLeda, which reports a classification of S0-a, or a spiral with an inner ring (r) and an outer pseudo-ring (R′). The FUV.CaF2 image (top left panel) shows diffuse emission in the outer regions, and the colour composite image (bottom panel) reveals a spiral structure embedded in a diffuse halo. However, the shape of this galaxy is reminiscent of 3D ETGs mentioned by Buta et al. (2015), in the R continuum and Hα+[N II] bands. The FUV.CaF2 average PA is consistent with the optical, 144.8°, at R25 from HyperLeda, and 152.4° ±0.7 from the Carnegie Galaxy Survey (CGS hereafter) in the I-band (Ho et al. 2011). The average FUV.CaF2 ellipticity, ⟨ϵ⟩ = 0.66, is twice as large as the optical ellipticity (Table 1).
The fit of the surface brightness profile with a Sérsic index n = 0.98 ± 0.04 is shown in the top right panel of Fig. 5. The FUV.CaF2 structure results basically show a disk with a bump that peaks at about 26″ or 2.6 kpc. Comerón et al. (2014) find an inner closed ring (r) and an outer pseudo-ring (R′) in this galaxy. The bump we detect in FUV.CaF2 corresponds to the R′ pseudo-ring that Comerón et al. (2014) detect at  .
.
NGC 1549. The FUV.CaF2 image of this galaxy, shown in Fig. 6, contrasts with the large scale optical system of shells and plumes discovered by Malin & Carter (1983). These features, due to old stellar populations, are not detected in our red continuum image (Fig. 6, green in the composite image) because of the short exposure time (see also the CGS study by Ho et al. (2011)). The colour composite image evidences a blue ring in the inner part (≈10–20″ radius) as revealed from our FUV.CaF2 luminosity profile, but not from optical data (Ho et al. 2011) or Hα from Ram2020.
The average ellipticity, ⟨ϵ⟩ = 0.07, and PA, ⟨PA⟩ = 0°, account for the roundness and smoothness of the FUV.CaF2 emission, unlike the B-band optical evaluation of HyperLeda, which provides ϵ = 0.15 and PA = 146.2° at R25. The PA of the I-band image of CGS (Ho et al. 2011) 173.8° ± 2.7 is consistent with the FUV.CaF2 measurement.
Our Sérsic fit of the surface brightness profile gives an index n = 2.86 ± 0.28, suggesting that in the FUV.CaF2 band, NGC 1549 is an E/S0.
NGC 1553. The HyperLEDA classification for this galaxy is S0 with a ring. Malin & Carter (1983) discovered a wide system of shells around this galaxy (see their Fig. 2). The colour composite image shown in Fig. 7 does not show such features, neither in FUV.CaF2, as expected, nor in the red continuum image due to the short exposure times.
The recent classification by Comerón et al. (2014) suggests the presence of resonance rings in this lenticular SA(rl, nr′l)0+. In more detail, they found an inner close ring-lens (rl) with semi-major axis of 35 4, and a nuclear pseudoring-lens structure (nr′l) with a semi-major axis of 9″ (see also Ho et al. 2011). Although these features are derived using IR data, a faint bump appears in the FUV.CaF2 luminosity profile of Fig. 7 between 30 and 40″, corresponding to the ring-lens (rl) above. Hα emission was detected by Fabry–Perot (FP) high-resolution observations of the NGC 1553 inner regions (Rampazzo et al. 2007). The FP Hα monochromatic map in the inner 30″ results in a quite clumpy image (see Fig. 8 in Ram2020).
The average FUV.CaF2 PA and ellipticity are very similar to the optical values at R25, which are PA = 150.4° and ϵ = 0.31, respectively. The PA of 151.3° ± 1.5° is measured in the I-band by CGS (Ho et al. 2011).
The right panel of Fig. 7 shows the Sérsic fit of the surface brightness profile. The Sérsic index obtained, n = 2.67 ± 0.21, is consistent with the one derived by Marino et al. (2011b) with the same method using GALEX FUV observations. This value suggests that FUV.CaF2 emission is structured in a disk, that is to say, the galaxy is an E/S0, consistent with the HyperLeda morphological type in Table 1.
[CMI2001]4136-01. This source, detected by Ram2020 (their Figs. 9 and 10) in Hα+[N II], probing its association with the Dorado group, reveals a complex and irregular morphology in our colour composite image (Fig. 8). This source has been classified as a galaxy in the GALEX-database.
The bottom panel of Fig. 8 shows H II regions within the faint structure of [CMI2001]4136-01. The case may be reminiscent of H II regions found by Werk et al. (2010) in the very periphery of NGC 1533, in the north-east substructure of Dorado. These seem connected with ongoing interaction between NGC 1533, and IC 2038 and IC 2039, suggested in optical by Cattapan et al. (2019), in H I by Ryan-Weber et al. (2003, 2004) and Kilborn et al. (2009), and in FUV.CaF2 by Ram2021. In this context, [CMI2001]4136-01, projecting on an optical shell of NGC 1553 (see also Fig. 2 in Malin & Carter 1983), could be distorted by interaction with the Dorado centre (SCG 0414−5559), a region that, unlike NGC 1533, is H I poor (Elagali et al. 2019).
IC 2058 and PGC 75125. IC 2058 and PGC 75125 are part of the Dorado central compact group SCG 0414−5559 (Iovino 2002). A distortion of PGC 75125 is evident from the FUV.CaF2 image (Fig. 9). The two galaxies, separated by ΔVhel = 28 km s−1, are likely interacting, as suggested by both the shape of the present FUV.CaF2 emission and H I observations by Elagali et al. (2019, their Fig. 14).
The FUV.CaF2 image of IC 2058, seen edge-on, does not show distortions. The smoothed image, shown in the bottom right panel of Fig. 9, shows the presence of some extra-planar features, not detected in Hα by both Rossa & Dettmar (2003) and Ram2020.
The geometrical parameters of IC 2058, PA = 17.9°, and ϵ = 0.85, at R25 in Table 1 are very similar to the average ⟨ϵ⟩ = 0.74 and ⟨PA⟩ = 18° obtained from the FUV.CaF2 surface photometry (Table 3).
The single Sérsic law fits of both galaxies luminosity profiles, shown in the top central and right panels of Fig. 9, with index n = 1.48 ± 0.10 for IC 2058 and n = 1.20 ± 0.03 for PGC 75125, trace the presence of a disk in both these galaxies (Table 3).
NGC 1566. The FUV.CaF2 emission (Fig. 10) of this grand design spiral, classified by Comerón et al. (2014) (R′)SAB(r′l, s, nb)b, is very extended, with the outermost spiral arm out to about 6 7 (about 31 kpc). This radius is larger than both the optical B-band radius at μ25, 3
 62 (HyperLeda), and the I-band emission radius measured at 26.5 mag arcsec−2 that reaches 4
 06 (Ho et al. 2011) (see Sect. 6 and Table 4).
Radial extension of targets in FUV.CaF2, I, g- and r-bands
The optical PA and ellipticity measured at R25, PA = 44.2° and ϵ = 0.32, differ from those provided by the FUV.CaF2 surface photometry. FUV.CaF2 isophotes appear nearly round with average ellipticity 0.05 and PA 15°. The PA measured in the I-band by CGS is 26.4° ± 4.7°.
In the top right panel of Fig. 10 are shown our surface brightness profile and single Sérsic law fit. The fit does not interpret the inner ring. The Sérsic index, n = 0.94 ± 0.05, follows the general disk structure, while the actual profile shows deviations corresponding to the spiral arms.
NGC 1596 and NGC 1602. Our UVIT image is the first UV view of both these systems. Our composite image (Fig. 11) shows that the FUV.CaF2 emission dominates the light of the irregular galaxy NGC 1602, whereas it is mixed with older stellar populations in NGC 1596. We enhanced the signal of faint structures using ASMOOTH task to look for an FUV connection between the two galaxies following the behaviour of the H I emission (Bureau & Chung 2006; Elagali et al. 2019), without success.
The smoothed image (bottom right panel), however, reveals extra-planar light, so the FUV disk loses the regular shape shown in the optical bands (bottom left panel).
The value of the Sérsic index in Fig. 11 (top: central and left panels) n = 2.12 ± 0.18 (Table 3) is consistent with the presence of a disk in NGC 1596. The average PA and ellipticity, 20° and 0.5, are consistent with HyperLeda values (Table 1) and the I-band measure of the PA, 20.0° ± 0.8° from CGS.
The surface brightness profile of NGC 1602 is very irregular as the shape of the galaxy which is classified a SBm in optical. The average ellipticity and PA, 0.3 and 80° are consistent with HyperLeda values (Table 1).
The Sérsic index, n = 0.25 ± 0.04, results from the irregular shape of the FUV.CaF2 light distribution in this galaxy. We notice that the case n = 0.5 corresponds to a Gaussian.
We summarize the results of our FUV.CaF2 morphological and structural analysis.
All surface brightness profiles are fitted by a 1D single Sérsic law with n < 3, suggesting that the FUV.CaF2 structures of most of the Dorado members we analysed, including ETGs, have a disk shape. Such FUV structures have been formed via dissipative mechanisms (Rampazzo et al. 2017).
NGC 1536 shows an off-centre bar. FUV.CaF2 rings are frequently detected among both ETGs and LTGs. Our findings support previous GALEX observations, (Jeong et al. 2009; Marino et al. 2011a,b) showing that these rings are SF sites (Bianchi 2011), associated with H II regions, the same as for NGC 1546, NGC 1566, NGC 1581 (Ram2020), and NGC 1533 (Ram2021).
We observe FUV.CaF2 extra-planar emission from the disks of IC 2058 and NGC 1596. (Figs. 9 and 11, right bottom panels). We fail in revealing FUV.CaF2 diffuse emission corresponding to the H I emission detected in between IC 2058 and PGC 75125 by Elagali et al. (2019), and in between NGC 1596 and NGC 1602 by Chung et al. (2006). Further insights on this point from deep optical images are discussed in the next section.
Asymmetries are visible in NGC 1536, PGC 75125, NGC 1566, and CMI[2001]4136-01, likely due to tidal perturbations.
6. FUV.CaF2 versus deep optical imaging: looking for XUV emission
We intend to test the presence of XUV disks in the Dorado members (i.e., the presence of FUV emission at large galacto-centric distances) up to several optical radii. Roughly 30% of spiral galaxies in the local Universe show XUV features (Thilker et al. 2007, 2010; de Gil Paz et al. 2008). This phenomenon is relevant for understanding how FUV observations intercept faint SF levels (see e.g., Bigiel et al. 2010). For comparison, we consider also the FUV.CaF2 extension versus optical in ETGs.
The FUV-optical comparison performed in Sect. 5, made on the basis of continuum observations from the Hα+[N II] data set of Ram2020, is hampered by the short exposure time through the narrow band optical filters used. In this section we compare the FUV.CaF2 extension of our targets with optical radius at 29 and 28 mag arcsec−2 in g- and r-bands, respectively, from the deep surface photometry by Ragusa et al. (in prep.). Table 4 reports the above values together with the R26.5 radius in the I-band measured by Ho et al. (2011).
6.1. The Dorado core
The left panel of Fig. 12 shows a VST colour composite image of the compact group. The image includes NGC 1546, NGC 1549, NGC 1553, and IC 2058, observed with UVIT FUV.CaF2 fields B, C, D, and E (see Table 1 and Fig. 1). The VST images also include PGC 75125 and [CMI2001]4136-01 projected between NGC 1549 and NGC 1553. An unsharp masking of the same field in the g-band is shown in the right panel. We notice that NGC 1546, in addition to NGC 1549 and NGC 1553 (Malin & Carter 1983), shows a faint shell and/or ripple in its south-east side. Shells are mostly revealed in ETGs, while they are very rare, if they exist at all, in LTGs (see e.g., Schweizer & Seitzer 1992). The presence of shells and/or ripples plus H II regions in the central spiral like structure of NGC 1546 (Ram2020) make this galaxy a borderline object between ETGs and LTGs. The morphological type (T = −0.4) and the classification by Comerón et al. (2014) is appropriated.
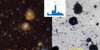 |
Fig. 12. Compact group SCG 0414−5559. Left panel: colour composite VST image of the Dorado group centre (north is on the top and east is to the left). The field of view is 51 |


The radial extension on the VST images of NGC 1546, NGC 1549, and NGC 1553 is larger than the FUV.CaF2 emission radius by 2.3, 3.2, and 3.4 times, respectively, in the g-band, and by 2.1, 3.5, and 3.5 in the r-band (Table 4). Conversely, the FUV.CaF2 emission of IC 2058 has a radius of 3 2, similar to the galaxy g-band extension (1.1 times) but larger than r-band extension, which is 0.7 times the FUV extension.
The VST image shows that the structure of PGC 75125, the physical companion of IC 2058, in FUV.CaF2 (Fig. 9) is either a warped disk or a bar-like structure embedded in a spheroidal halo. The optical radii (Table 4) are 0 62 and 0.57 in g- and r-bands, respectively, and 0
 42 in FUV.CaF2 at μFUV.CaF2 = 29 mag arcsec−2, meaning the extension of PGC 75125 in optical is 1.5 times larger than in FUV.CaF2.
We conclude that the compact group members do not show signature of XUV features.
6.2. NGC 1566 and NGC 1581
The top panel of Fig. 13 shows the VST colour composite image of NGC 1566 and NGC 1581. The projected separation between these galaxies (210 kpc) is quite large, although the recession velocity separation (ΔVhel = 96 km s−1, bottom left panel of Fig. 13) is compatible with the galaxies being associated.
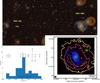 |
Fig. 13. NGC 1566 and NGC 1581. In the top panel is shown the VST image colour composite image (RGB as in Fig. 12) of NGC 1566 and NGC 1581 members (north is on the top and east is to the left, FoV = 60 |


The UVIT field F includes NGC 1566. NGC 1581 was not observed either by GALEX or by UVIT. The grand design spiral NGC 1566 dominates the FUV emission of the Dorado group (Table 3, see also Fig. 2). It extends up to 1.65 × R26.5 and 0.83 × R29g, and is similar to R28r (Table 4). The bottom right panel of Fig. 13 shows that the FUV.CaF2 emission extends almost up to the H I column density of 3.7 × 1020 cm2, marked by the red contours.
6.3. NGC 1596 and NGC 1602
The radial velocities of NGC 1596 and NGC 1602 differ by 230 km s−1 as shown by the red arrows in the bottom right panel of Fig. 14. The left panel of this figure shows a colour composite image of the pair. NGC 1602 is enclosed in a halo stretched towards the NGC 1596 halo.
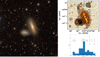 |
Fig. 14. The physical pair NGC 1596 and NGC 1602. In the redshift space these galaxies are separated by 230 km s−1, as shown by the bottom right panel. The VST colour composite image (RGB as in Fig. 12) of the pair (left panel, north on is the top and east is to the left, FoV = 17 |


UVIT FUV.CaF2 observations (Fig. 11) show that the two galaxies are sharply separated and without any outer halo. However, the extra-planar features shown by adaptive smoothing applied to the FUV.CaF2 image (bottom right panel of Fig. 11) may trace the H I connection (Chung et al. 2006) between the two galaxies, shown in the top left panel of Fig. 14 in which the neutral gas contours are overlaid. The on-going interaction between these two Dorado members distorts their halos, as evidenced by the unsharp masking of the VST image.
The radius is about 1 3 at μFUV.CaF2 = 30 mag arcsec−2 for NGC 1596. The optical emission from the VST of NGC 1596 is 5
 5 at μg = 29 mag arcsec−2 and 6′ at μr = 28 mag arcsec−2, indicating that the optical emission is 4.6 and 4.23 times larger than the FUV.CaF2 emission. NGC 1602 at μFUV.CaF2 = 30 mag arcsec−2 has a radius of 0
 8, that is to say 4.5 times smaller than both the R29g and R28r radii from the VST frames (see Table 4). None of these galaxies host a XUV disk.
We may summarize, the discussion about FUV.CaF2 extension with respect to optical and H I observations as follows.
The radius of the FUV.CaF2 emission in Dorado ETGs is several times smaller than the optical radius as measured either by VST or CGS. This is also the case for NGC 1533 (Ram2021).
Since the central FUV.CaF2 emission is always consistent with a disk structure, the dissipative processes triggered the recent SF and exhausted the H I in NGC 1549 and NGC 1553, not revealed by the Elagali et al. (2019, see their Fig. 14) mosaic of the Dorado group.
In the periphery of SGC 0414−5559 (i.e., NGC 1546, and in the pair IC 2058 and PGC 75125), the FUV.CaF2 emission is coupled with H I emission (Kilborn et al. 2005; Elagali et al. 2019) and on-going SF (see also Rampazzo et al. 2021).
In LTGs, the FUV.CaF2 and optical VST radii are comparable, such as for IC 2058, NGC 1536 and NGC 1566. Larger FUV.CaF2 extension, XUV disks, are detected in IC 2038 (Ram2021). In NGC 1566 the H I gas emission extends well beyond the FUV.CaF2 radius measured in the present study (Table 4). The fact that both optical and the FUV.CaF2 are of similar size in NGC 1566 may indicate that the SF drops well before the H I extension.
The distortion revealed by VST images in the outskirts of NGC 1602 superposes to the H I pipeline emission that connects it to NGC 1596 (Bureau & Chung 2006; Chung et al. 2006), and may feed its recent SF detected by UVIT.
7. SFR from FUV.CaF2 flux versus Hα flux
In this section we compare the SFRs of Dorado members as derived from Hα (Ram2020) with the SFRs obtained from the FUV.CaF2 luminosities (Sect. 4.2). In the comparison we also include members of the NGC 1533 Dorado substructure previously analysed by Ram2021, thus covering most of the backbone of the Dorado group. We also compare the SFRs of Dorado members with those of galaxies in the local volume (LV) (Lee et al. 2009; Karachentsev & Kaisina 2013).
Regarding the comparison between the SFRs obtained from different indicators, we recall some critical points discussed by Bianchi (2011). First of all, UV probes age up to hundreds of Myr, while Hα traces ionizing photons by O and early B stars (i.e., significantly younger ages, see Sect. 4.2 and references therein). Therefore, the Kennicutt et al. (2009) relations are a good approximations for constant average SFR (t > 10 Gyr). Second, UV fluxes are affected by reddening more severely than optical fluxes and, furthermore, dust properties and extinction vary with the local stellar environment. Accurate modeling of galaxy properties from UV data must also account for internal extinction, in particular for LTGs (Bianchi et al. 2017, Table 1).
In Fig. 15 (left panel), we compare the SFRs obtained from Hα (Ram2020) and FUV.CaF2 fluxes (Table 3). Both fluxes are corrected for the foreground extinction as described in Sect. 4.2. No correction for internal extinction has been applied. Figure 15 shows that all Doardo LTGs (T > 0, blue squares) are essentially distributed along the 1:1 line (dashed black line in the left panel), except for the edge-on IC 2058, where neglecting internal extinction correction can significantly alter the result.
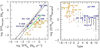 |
Fig. 15. Left panel: comparison between SFR derived from Hα and FUV.CaF2 luminosities. The Dorado sample is plotted with orange (ETG) and blue (LTG) squares. For comparison, we plot Lee et al. (2009, their Table 2) sample with red (ETG) and grey (LTG) dots. The magenta dot shows NGC 1533 as derived using SFR from Hα by Kaisina et al. (2012) and from FUV.CaF2 measured in this work. All measures account for Galactic extinction, but internal dust attenuation has not been modelled and accounted for. The solid and dashed black lines show the Lee et al. (2009) relation and the one-to-one correspondence, respectively. The solid green and dashed orange lines are the regression fit of the entire Dorado sample (Eq. (3)) and of the ETGs members (Eq. (2)), respectively. Right panel: ratio of SFR from Hα and FUV.CaF2 versus galaxy morphological type. |
For the Dorado ETGs (−5 ≤ T ≤ 0 orange squares), instead, SFRFUV.CaF2 is at least is 1 dex lower than SFRHα. Such a marked difference is also seen in the right panel of Fig. 15 where the ratio [SFRHα/SFRFUV.CaF2] is plotted as a function of the morphological type.
Given that the Dorado’s ETGs define a well separated locus from the LTGs, and a clear trend (roughtly paralell to that of the LTGs, but more than 1dex offset), we fit the relation between their SFR values and find:
 (2)
(2)
with a correlation index = 0.97. The regression fit is shown as a dashed orange line in Fig. 15.
For comparison, we also plot in Fig. 15 the sample of about 300 local volume (< 11 Mpc) galaxies by Lee et al. (2009), who used GALEX UV data and ground-based Hα measurements to derive SFR; these authors account for the foreground but not for internal extinction, the same as we did for our data set. Their sample included LTGs (the majority, grey dots in our figure) and a few ETGs (red dots). Lee et al. (2009) derived a relation from their whole sample, which we report in the left panel of Fig. 15 as a solid black line. A few facts appear evident from Fig. 15. The relation from Lee et al. (2009) is driven by their LTGs (more numerous in their sample), and it does not strongly differ from the distribution of the Dorado’s LTGs; these seem more closely aligned along the 1:1 line (again excluding the edge-on case, which would require a large extinction correction). We do not derive a formal regression fit for the Dorado LTGs due to the scarcity of the sample. The ETGs in the sample from Lee et al. (2009) (red dots in Fig. 15) span a broad locus, from their relation derived for the whole sample all the way to the locus of the Dorado ETGs. Karachentsev & Kaisina (2013) also studied the SFR of the LV galaxies using Hα and FUV measures, and note that ETGs show a large dispersion in SFR.
The SFRFUV.CaF2 versus SFRHα trend for the entire Dorado sample, shown in Fig. 15 by a green continuous line, is represented by the relation:
 (3)
(3)
with correlation index = 0.84. The comparison of this relation with the general relation by Lee et al. (2009) and with the relation for Dorado’s ETGs simply reflects the differing composition of the samples (i.e., the relative content of ‘classical’ LTGs versus ETGs) parallel, as expected because they trace a gradient of SFR intensity across the sample.
This is further evidenced in Fig. 16, where the trend of the log(SFRHα/SFRFUV) ratio is shown as a function of the log SFR(Hα) (left panel) and the absolute B-band magnitude, MB (right panel) in Table 1. We fit our values, obtaining relations for the entire Dorado sample (Eqs. (4) and (6)) and for ETGs (Eqs. (5) and (7)). The relations plotted in the left panel of Fig. 16 are:
 (4)
(4)
 (5)
(5)
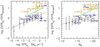 |
Fig. 16. Ratio between the SFR from Hα and FUV.CaF2 luminosities on a logarithmic scale versus the SFR from Hα (left panel) and the absolute B-band magnitude (right panel). The symbols used are the same as those in Fig. 15. The black dots are average values of the sample of Lee et al. (2009, their Table 2). The solid grey lines are the linear least squares fits by Lee et al. (2009). The solid green and dashed orange lines are the regression fit of the entire Dorado sample (Eq. (4) in the left panel and Eq. (6) in the right panel) and for the ETGs (Eq. (5) in the left panel and Eq. (7) in the right panel), respectively. |
while in the right panel, these are:
 (6)
(6)
 (7)
(7)
If we exclude IC 2058, Dorado LTGs roughly align along the SFRHα versus SFRFUV.CaF2 one-to-one correspondence line as shown in Fig. 15. We conclude that the relation between the two SFR indicators for LTGs (especially at log (SFR) ≳ − 2.5) is essentially consistent across different LV environments, while ETGs can depart by over one order of magnitude.
We believe it is unlikely that internal extinction in LTGs could account for the large discrepancy between SFRFUV versus SFRHα. Mazzei et al. (2014a,b) performed full modeling with smoothed particle hydrodynamic simulations, with chemo-photometric implementation (SPH-CPI) of two galaxies; one in our sample (NGC 1533) and one with similar characteristics (NGC 1543, Marino et al. 2011a, Ram2020). The simulations included self-gravity of gas, stars and dark matter, radiative cooling, hydro-dynamical pressure, shock heating, viscosity, star formation, feedback from evolved stars and type II supernovae, and chemical enrichment, and matched all the observed properies of the galaxies.
Their results showed that internal reddening could account for a factor of two correction to the SFR, at most.
We argue that the differences in behaviour of LTGs and ETGs, shown by Figs. 15 and 16, is not surprising, given the different modality of SF which is residual in ETGs, unlike in LTGs. SF episodes in ETGs cannot support a constant SF for 108 yr or longer (1 Gyr), as required for SFRUVKennicutt (1998) calibration. Moreover, as Kennicutt & Evans (2012, and references therein) reported, the systematic dependence of the Hα/UV ratio in Figs. 15 and 16 may be produced by temporal variations in SFRs. Such variations of SFR are typical of ETGs, as shown by SPH-CPI simulations (see Mazzei et al. 2019, and references therein). Since the global Dorado Hα versus FUV SFR relation is driven by the ETGs (i.e., by the Dorado evolutionary status), we argue that the FUV versus Hα SFR relation may be caused by the mix of different galaxy types.
8. Summary and conclusions
Using the far-ultraviolet channel (FUV.CaF2) (1300–1800 Å) of Astrosat-UVIT, we observed seven fields mapping Dorado, a nearby and still clumpy group extending for about 10 square degrees in the Southern Hemisphere. We present the study of its core region, identified by the compact group SCG 0414−5559 (Iovino 2002), the NGC 1566 and NGC 1581 substructures, and the NGC 1596 and NGC 1602 substructures (the latter observed for the first time in FUV). We also included in the analysis the Dorado south-west NGC 1533 substructure that was previously investigated with UVIT and the same filter in Ram2021.
All galaxies observed were detected in FUV.CaF2. We revealed an inner ring in NGC 1549, not detected in optical bands, and a ring in NGC 1546, which adds to FUV rings found in NGC 1533 and NGC 1543 by previous UV studies (see Marino et al. 2011a, and Ram2021). Simulations show these resonance rings originate by mergers, flyby encounters and, in general, galaxy–galaxy interactions (Mazzei et al. 2014a,b, 2018; Mazzei et al. 2019, 2022; Eliche-Moral et al. 2018). Structural asymmetries in the FUV.CaF2 images of NGC 1566, PGC 75125, and [CMI2001]4136-01 are additional signatures of interactions. In both IC 2058 and NGC 1596, the smoothed FUV.CaF2 emission enhances the presence of extra-planar features not revealed in Hα (Ram2020).
We analysed the galaxy morphology and the surface brightness profiles, and obtained integrated magnitudes. We fitted the surface brightness profiles, adopting a single Sérsic law. Excluding NGC 1602, which was strongly irregular in the FUV.CaF2 band, the range of the Sérsic index, 0.76 ± 0.02 ≤ n ≤ 2.86 ± 0.28, indicates the presence of a disk in all the galaxies (see Rampazzo et al. 2017), and suggests that dissipation mechanisms have operated in shaping the FUV.CaF2 structure, even in the gas poor ETGs like NGC 1553 and NGC 1549.
We used deep, g- and r- wide field VST images to investigate the presence of XUV disks through comparison with the FUV.CaF2 extension. We found that in ETGs, the FUV.CaF2 emission is several times less extended than the optical one. Conversely, LTGs have similar FUV.CaF2 and optical dimensions. IC 2038 is consistent with having an XUV disk (Ram2021).
The residual SF in ETGs of Dorado is proven by their FUV emission, shaped in a disk, and by the detection of H II regions in a significant fraction of them (Ram2020). The SFR estimates from Hα and UV give consistent results for LTGs. The only exception is IC 2058, which is seen edge-on. Conversely, the SFR estimate from Hα of Dorado ETGs is at least 10 times higher than the UV estimate. We derived the relations describing the SFRFUV.CaF2 and the SFRHα trends for the entire Dorado backbone (Eqs. (3), (4), and (6)) and for ETGs members separately (Eqs. (2), (5), and (7)).
ETGs in Dorado are numerous and drive the SFR relations we derived. We suggest that the Dorado SFRHα versus SFRFUV.CaF2 relation marks the group’s evolutionary status. On the other hand, SF episodes in ETGs cannot support an underlying, constant SFR, as required by general calibrations (Kennicutt 1998), as shown by SPH-CPI simulations (Mazzei et al. 2022, and references therein).
Our analysis in the short wavelength range (FUV.CaF2) of Dorado galaxy members confirms the active evolutionary status of this group indicated by optical (Malin & Carter 1983), radio (Kilborn et al. 2005; Elagali et al. 2019), and Hα observations (Ram2020).
Acknowledgments
The UVIT project is collaboration between the following institutes from India: Indian Institute of Astrophysics (IIA), Bengaluru, Inter University Centre for Astronomy and Astrophysics (IUCAA), Pune, and National Centre for Radioastrophysics (NCRA) (TIFR), Pune, and the Canadian Space Agency (CSA). The detector systems are provided by the Canadian Space Agency. The mirrors are provided by LEOS, ISRO, Bengaluru and the filter-wheels drives are provided by IISU, ISRO, Trivandrum. Many departments from ISAC, ISRO, Bengaluru have provided direct support in design and implementation of the various sub-systems. Data from Extragalactic Database (NED) and NASA’s Astrophysics Data System (ADS) are also used in this paper. We acknowledge the usage of the HyperLeda database (http://leda.univ-lyon1.fr).
References
- Abadi, M. G., Moore, B., & Bower, R. G. 1999, MNRAS, 308, 947 [Google Scholar]
- Bai, Y., Zou, H., Liu, J., & Wang, S. 2015, ApJS, 220, 6 [Google Scholar]
- Bender, R., Doebereiner, S., & Moellenhoff, C. 1988, A&AS, 74, 385 [Google Scholar]
- Bianchi, L. 2011, Ap&SS, 335, 51 [Google Scholar]
- Bianchi, L., Shiao, B., & Thilker, D. 2017, ApJS, 230, 24 [Google Scholar]
- Bigiel, F., Leroy, A., Seibert, M., et al. 2010, ApJ, 720, L31 [NASA ADS] [CrossRef] [Google Scholar]
- Boselli, A., & Gavazzi, G. 2014, A&ARv, 22, 74 [Google Scholar]
- Bressan, A., Panuzzo, P., Buson, L., et al. 2006, ApJ, 639, L55 [NASA ADS] [CrossRef] [Google Scholar]
- Bureau, M., & Chung, A. 2006, MNRAS, 366, 182 [NASA ADS] [Google Scholar]
- Buta, R. J., Sheth, K., Athanassoula, E., et al. 2015, ApJS, 217, 32 [Google Scholar]
- Capaccioli, M., Spavone, M., Grado, A., et al. 2015, A&A, 581, A10 [NASA ADS] [CrossRef] [EDP Sciences] [Google Scholar]
- Cattapan, A., Spavone, M., Iodice, E., et al. 2019, ApJ, 874, 130 [Google Scholar]
- Chung, A., Koribalski, B., Bureau, M., & van Gorkom, J. H. 2006, MNRAS, 370, 1565 [NASA ADS] [CrossRef] [Google Scholar]
- Comerón, S., Salo, H., Laurikainen, E., et al. 2014, A&A, 562, A121 [Google Scholar]
- Davis, M., & Geller, M. J. 1976, ApJ, 208, 13 [NASA ADS] [CrossRef] [Google Scholar]
- de Vaucouleurs, G. 1953, AJ, 58, 30 [Google Scholar]
- de Vaucouleurs, A., Corwin, H. G., Buta, R. J., et al. 1992, Observatory, 112, 127 [NASA ADS] [Google Scholar]
- Diaferio, A., Geller, M. J., & Ramella, M. 1994, AJ, 107, 868 [NASA ADS] [CrossRef] [Google Scholar]
- Díaz-Giménez, E., Zandivarez, A., & Mamon, G. A. 2021, MNRAS, 503, 394 [Google Scholar]
- Dressler, A. 1980, ApJ, 236, 351 [Google Scholar]
- Ebeling, H., White, D. A., & Rangarajan, F. V. N. 2006, MNRAS, 368, 65 [NASA ADS] [Google Scholar]
- Elagali, A., Staveley-Smith, L., Rhee, J., et al. 2019, MNRAS, 487, 2797 [NASA ADS] [CrossRef] [Google Scholar]
- Eliche-Moral, M. C., Rodríguez-Pérez, C., Borlaff, A., Querejeta, M., & Tapia, T. 2018, A&A, 617, A113 [NASA ADS] [CrossRef] [EDP Sciences] [Google Scholar]
- Firth, P., Evstigneeva, E. A., Jones, J. B., et al. 2006, MNRAS, 372, 1856 [NASA ADS] [CrossRef] [Google Scholar]
- Freeman, K. C. 1970, ApJ, 160, 811 [Google Scholar]
- Gavazzi, G., Consolandi, G., Pedraglio, S., et al. 2018, A&A, 611, A28 [NASA ADS] [CrossRef] [EDP Sciences] [Google Scholar]
- George, K., Poggianti, B. M., Gullieuszik, M., et al. 2018, MNRAS, 479, 4126 [Google Scholar]
- Gil de Paz, A., Boissier, S., Madore, B. F., et al. 2007, ApJS, 173, 185 [Google Scholar]
- Gil de Paz, A., Thilker, D. A., Bianchi, L., et al. 2008, in Formation and Evolution of Galaxy Disks, eds. J. G. Funes, & E. M. Corsini, ASP Conf. Ser., 396, 197 [NASA ADS] [Google Scholar]
- Gunn, J. E., Gott, J., & Richard, I. 1972, ApJ, 176, 1 [Google Scholar]
- Hester, J. A., Seibert, M., Neill, J. D., et al. 2010, ApJ, 716, L14 [Google Scholar]
- Ho, L. C., Li, Z.-Y., Barth, A. J., Seigar, M. S., & Peng, C. Y. 2011, ApJS, 197, 21 [Google Scholar]
- Hota, A., Devaraj, A., Pradhan, A. C., et al. 2021, JApA, 42, 86 [NASA ADS] [Google Scholar]
- Iovino, A. 2002, AJ, 124, 2471 [NASA ADS] [CrossRef] [Google Scholar]
- James, P. A., Shane, N. S., Beckman, J. E., et al. 2004, A&A, 414, 23 [NASA ADS] [CrossRef] [EDP Sciences] [Google Scholar]
- Jedrzejewski, R. I. 1987, MNRAS, 226, 747 [Google Scholar]
- Jeong, H., Yi, S. K., Bureau, M., et al. 2009, MNRAS, 398, 2028 [NASA ADS] [CrossRef] [Google Scholar]
- Kaisina, E. I., Makarov, D. I., Karachentsev, I. D., & Kaisin, S. S. 2012, Astrophys. Bull., 67, 115 [NASA ADS] [CrossRef] [Google Scholar]
- Kantharia, N. G., Ananthakrishnan, S., Nityananda, R., & Hota, A. 2005, A&A, 435, 483 [NASA ADS] [CrossRef] [EDP Sciences] [Google Scholar]
- Karachentsev, I. D., & Kaisina, E. I. 2013, AJ, 146, 46 [NASA ADS] [CrossRef] [Google Scholar]
- Kendall, S., Clarke, C., & Kennicutt, R. C. 2015, MNRAS, 446, 4155 [NASA ADS] [CrossRef] [Google Scholar]
- Kennicutt, R. C., Jr 1998, ARA&A, 36, 189 [NASA ADS] [CrossRef] [Google Scholar]
- Kennicutt, R. C., Jr, & Evans, N. J. 2012, ARA&A, 50, 531 [NASA ADS] [CrossRef] [Google Scholar]
- Kennicutt, R. C., Jr, Hao, C.-N., Calzetti, D., et al. 2009, ApJ, 703, 1672 [NASA ADS] [CrossRef] [Google Scholar]
- Kilborn, V. A., Koribalski, B. S., Forbes, D. A., Barnes, D. G., & Musgrave, R. C. 2005, MNRAS, 356, 77 [CrossRef] [Google Scholar]
- Kilborn, V. A., Forbes, D. A., Barnes, D. G., et al. 2009, MNRAS, 400, 1962 [CrossRef] [Google Scholar]
- Kourkchi, E., & Tully, R. B. 2017, ApJ, 843, 16 [NASA ADS] [CrossRef] [Google Scholar]
- Kumar, A., Ghosh, S. K., Kamath, P. U., et al. 2012, in Space Telescopes and Instrumentation 2012: Ultraviolet to Gamma Ray, SPIE Conf. Ser., 8443, 84434R [NASA ADS] [CrossRef] [Google Scholar]
- Lee, J. C., Gil de Paz, A., Tremonti, C., et al. 2009, ApJ, 706, 599 [NASA ADS] [CrossRef] [Google Scholar]
- Lupton, R., Blanton, M. R., Fekete, G., et al. 2004, PASP, 116, 133 [NASA ADS] [CrossRef] [Google Scholar]
- Malin, D. F., & Carter, D. 1983, ApJ, 274, 534 [Google Scholar]
- Mamon, G. A. 1992, ApJ, 401, L3 [NASA ADS] [CrossRef] [Google Scholar]
- Marino, A., Bianchi, L., Rampazzo, R., Buson, L. M., & Bettoni, D. 2010, A&A, 511, A29 [NASA ADS] [CrossRef] [EDP Sciences] [Google Scholar]
- Marino, A., Bianchi, L., Rampazzo, R., et al. 2011a, Ap&SS, 335, 243 [NASA ADS] [CrossRef] [Google Scholar]
- Marino, A., Rampazzo, R., Bianchi, L., et al. 2011b, MNRAS, 411, 311 [CrossRef] [Google Scholar]
- Marino, A., Plana, H., Rampazzo, R., et al. 2013, MNRAS, 428, 476 [NASA ADS] [CrossRef] [Google Scholar]
- Marino, A., Bianchi, L., Mazzei, P., Rampazzo, R., & Galletta, G. 2014, AdSpR, 53, 920 [NASA ADS] [Google Scholar]
- Marino, A., Mazzei, P., Rampazzo, R., & Bianchi, L. 2016, MNRAS, 459, 2212 [NASA ADS] [CrossRef] [Google Scholar]
- Martin, D. C., Fanson, J., Schiminovich, D., et al. 2005, ApJ, 619, L1 [Google Scholar]
- Mazzei, P., Marino, A., Rampazzo, R., Galletta, G., & Bettoni, D. 2014a, AdSpR, 53, 950 [NASA ADS] [Google Scholar]
- Mazzei, P., Marino, A., & Rampazzo, R. 2014b, ApJ, 782, 53 [NASA ADS] [CrossRef] [Google Scholar]
- Mazzei, P., Marino, A., Rampazzo, R., et al. 2018, A&A, 610, A8 [NASA ADS] [CrossRef] [EDP Sciences] [Google Scholar]
- Mazzei, P., Rampazzo, R., Marino, A., et al. 2019, ApJ, 885, 165 [NASA ADS] [CrossRef] [Google Scholar]
- Mazzei, P., Rampazzo, R., Marino, A., et al. 2022, ApJ, 927, 124 [NASA ADS] [CrossRef] [Google Scholar]
- Meert, A., Vikram, V., & Bernardi, M. 2015, MNRAS, 446, 3943 [NASA ADS] [CrossRef] [Google Scholar]
- Morrissey, P., Conrow, T., Barlow, T. A., et al. 2007, ApJS, 173, 682 [Google Scholar]
- Oh, S. H., Kim, W.-T., & Lee, H. M. 2015, ApJ, 807, 73 [NASA ADS] [CrossRef] [Google Scholar]
- Poggianti, B. M., von der Linden, A., De Lucia, G., et al. 2006, ApJ, 642, 188 [NASA ADS] [CrossRef] [Google Scholar]
- Postma, J. E., & Lehay, D. 2017, PASP, 129, 115002 [NASA ADS] [CrossRef] [Google Scholar]
- Postma, J. E., & Lehay, D. 2020, PASP, 132, 54503 [Google Scholar]
- Postma, J., Hutchings, J. B., & Lehay, D. 2011, PASP, 123, 833 [NASA ADS] [CrossRef] [Google Scholar]
- Rampazzo, R., Marino, A., Tantalo, R., et al. 2007, MNRAS, 381, 245 [NASA ADS] [CrossRef] [Google Scholar]
- Rampazzo, R., Panuzzo, P., Vega, O., et al. 2013, MNRAS, 432, 374 [NASA ADS] [CrossRef] [Google Scholar]
- Rampazzo, R., Mazzei, P., Marino, A., et al. 2017, A&A, 602, A97 [NASA ADS] [CrossRef] [EDP Sciences] [Google Scholar]
- Rampazzo, R., Mazzei, P., Marino, A., et al. 2018, Ap&SS, 363, 80 [NASA ADS] [CrossRef] [Google Scholar]
- Rampazzo, R., Ciroi, S., Mazzei, P., et al. 2020, A&A, 643, A176 [NASA ADS] [CrossRef] [EDP Sciences] [Google Scholar]
- Rampazzo, R., Mazzei, P., Marino, A., et al. 2021, JApA, 42, 31 [NASA ADS] [Google Scholar]
- Ribeiro, A. L. B., de Carvalho, R. R., Capelato, H. V., & Zepf, S. E. 1998, ApJ, 497, 72 [Google Scholar]
- Roberts, I. D., van Weeren, R. J., McGee, S. L., et al. 2021, A&A, 652, A153 [NASA ADS] [CrossRef] [EDP Sciences] [Google Scholar]
- Rossa, J., & Dettmar, R. J. 2003, A&A, 406, 493 [NASA ADS] [CrossRef] [EDP Sciences] [Google Scholar]
- Ryan-Weber, E. V., Webster, R. L., & Staveley-Smith, L. 2003, MNRAS, 343, 1195 [CrossRef] [Google Scholar]
- Ryan-Weber, E. V., Meurer, G. R., Freeman, K. C., et al. 2004, AJ, 127, 1431 [NASA ADS] [CrossRef] [Google Scholar]
- Schipani, P., Noethe, L., Arcidiacono, C., et al. 2012, J. Opt. Soc. Am. A, 29, 1359 [Google Scholar]
- Schweizer, F., & Seitzer, P. 1992, AJ, 104, 1039 [Google Scholar]
- Sérsic, J. L. 1963, Boletin de la Asociacion Argentina de Astronomia, La Plata Argentina, 6, 41 [Google Scholar]
- Simonian, G. V.,& Martini, P. 2017, MNRAS, 464, 3920 [CrossRef] [Google Scholar]
- Smith, R. J., Lucey, J. R., Hammer, D., et al. 2010, MNRAS, 408, 1417 [Google Scholar]
- Spavone, M., Capaccioli, M., Napolitano, N. R., et al. 2017, A&A, 603, A38 [NASA ADS] [CrossRef] [EDP Sciences] [Google Scholar]
- Tandon, S. N., Subramaniam, A., Girish, V., et al. 2017, AJ, 154, 128 [NASA ADS] [CrossRef] [Google Scholar]
- Thilker, D. A., Bianchi, L., Meurer, G., et al. 2007, ApJS, 173, 538 [Google Scholar]
- Thilker, D. A., Bianchi, L., Schiminovich, D., et al. 2010, ApJ, 714, L171 [NASA ADS] [CrossRef] [Google Scholar]
- Vulcani, B., Poggianti, B. M., Moretti, A., et al. 2021, ApJ, 914, 27 [NASA ADS] [CrossRef] [Google Scholar]
- Werk, J. K., Putman, M. E., Meurer, G. R., et al. 2010, AJ, 139, 279 [NASA ADS] [CrossRef] [Google Scholar]
All Tables
All Figures
|
Fig. 1. Projected distribution of Dorado galaxy members according to Firth et al. (2006) and Kourkchi & Tully (2017). Members are labelled according to their morphology and B-Band magnitude provided by HyperLeda. UVIT FUV.CaF2 fields listed in Table 1 are enclosed by a light-green circle that has the diameter of the UVIT field (28′). Target galaxies within each field are also labelled. The morphological, photometric, and star-forming properties obtained from the UVIT FUV.CaF2 data set about NGC 1533, and IC 2038 and IC 2039, shown as dark-grey circles in the figure, have been presented and discussed in Ram2021. Ram2020 also observed NGC 1581 and NGC 1543 in Hα+[N II]. All galaxies except NGC 1596 and NGC 1602 have been already observed with GALEX at lower resolution and sensitivity (see e.g., Marino et al. 2011a,b). |
| In the text | |
|
Fig. 2. Comparison with the FUV GALEX magnitudes reported in Table 1. The comparison includes galaxies in Ram2021, namely NGC 1533, IC 2038, and IC 2039, whose magnitudes are corrected for foreground Galactic extinction as described in their Table 3. |
| In the text | |
|
Fig. 3. UVIT FUV.CaF2 luminosity profile of NGC 1553 (green squares) compared with that of Marino et al. (2011b) from FUV-GALEX observations. The UVIT image of NGC 1553 was binned into 4 × 4 pixel bins. |
| In the text | |
|
Fig. 4. Top left panel: UVIT FUV.CaF2 image of NGC 1536. The image size is 7′×7′. North is on the top, and east is to the left. Top right panel: UVIT FUV.CaF2 surface brightness profile (blue). The single Sérsic law is superposed (cyan) to fit the light profile. Bottom panel: colour composite RGB image of NGC 1536 using Hα+[N II] and nearby continuum images (from Ram2020) as red and green channels, and the FUV.CaF2 image as a blue channel. Both the Hα+[N II] and the continuum images have been re-sampled to the UVIT image resolution. |
| In the text | |
|
Fig. 5. As in Fig. 4 but for NGC 1546. The image size is 7′×7′. North is on the top and east is to the left. |
| In the text | |
|
Fig. 6. As in Fig. 4 but for NGC 1549. The image size is 8′×8′. North is on the top and east is to the left. |
| In the text | |
|
Fig. 7. As in Fig. 4 but for NGC 1553. The image size is 7′×7′. North is on the top and east is to the left. |
| In the text | |
|
Fig. 8. Left panel: UVIT FUV.CaF2 image of CMI2001 in the field of NGC 1553. The size of the figure is 7′×7′. Top panels: zoom on the [CMI2001]4136-01 FUV.CaF2 region, 2′×2′ wide, before and after smoothing with ASMOOTH, and with τmin = 1.5. Bottom panels: [CMI2001]4136-01 image in continuum and Hα+[N II] adapted from Ram2020. The red square encloses the CMI2001 region. Bottom right panel: RGB colour composite image obtained from the continuum, Hα+[N II], and FUV images used as the green, red, and blue channels, respectively. |
| In the text | |
|
Fig. 9. Top left panel: UVIT FUV.CaF2 image of IC 2058 and PGC 75125 at the centre of the frame and at the east side, respectively. The image size is 5′×5′. North is on the top and east is to the left. Top central panel: FUV.CaF2 surface brightness profile (blue) of IC 2058 and (top right panel) of PGC 75125. The single Sérsic law is superposed (cyan) to fit the light profile. Bottom left panel: colour composite RGB image of IC 2058 and PGC 75125 as in Fig. 4. Bottom right panel: FUV.CaF2 image smoothed using the AMOOTH task, with τmin = 1.5. |
| In the text | |
|
Fig. 10. As in Fig. 4 but for NGC 1566. The image size is 13′×13′. North is on the top and east is to the left. |
| In the text | |
|
Fig. 11. Top left panel: UVIT FUV.CaF2 image of NGC 1596 (north-west) and NGC 1602 (south-east). The image size is 7′×7′. North is on the top and east is to the left. Top right panels: FUV.CaF2 surface brightness profiles of NGC 1596 and NGC 1602 (blue solid lines). The fit of a single Sérsic law is overlaid to the luminosity profile (cyan squares). Bottom left panel: colour composite RGB image of NGC 1596 and NGC 1602 as in Fig. 4. Bottom right panel: FUV.CaF2 image smoothed using ASMOOTH task, with τmin = 1.5. |
| In the text | |
|
Fig. 12. Compact group SCG 0414−5559. Left panel: colour composite VST image of the Dorado group centre (north is on the top and east is to the left). The field of view is 51 |
| In the text | |
|
Fig. 13. NGC 1566 and NGC 1581. In the top panel is shown the VST image colour composite image (RGB as in Fig. 12) of NGC 1566 and NGC 1581 members (north is on the top and east is to the left, FoV = 60 |
| In the text | |
|
Fig. 14. The physical pair NGC 1596 and NGC 1602. In the redshift space these galaxies are separated by 230 km s−1, as shown by the bottom right panel. The VST colour composite image (RGB as in Fig. 12) of the pair (left panel, north on is the top and east is to the left, FoV = 17 |
| In the text | |
|
Fig. 15. Left panel: comparison between SFR derived from Hα and FUV.CaF2 luminosities. The Dorado sample is plotted with orange (ETG) and blue (LTG) squares. For comparison, we plot Lee et al. (2009, their Table 2) sample with red (ETG) and grey (LTG) dots. The magenta dot shows NGC 1533 as derived using SFR from Hα by Kaisina et al. (2012) and from FUV.CaF2 measured in this work. All measures account for Galactic extinction, but internal dust attenuation has not been modelled and accounted for. The solid and dashed black lines show the Lee et al. (2009) relation and the one-to-one correspondence, respectively. The solid green and dashed orange lines are the regression fit of the entire Dorado sample (Eq. (3)) and of the ETGs members (Eq. (2)), respectively. Right panel: ratio of SFR from Hα and FUV.CaF2 versus galaxy morphological type. |
| In the text | |
|
Fig. 16. Ratio between the SFR from Hα and FUV.CaF2 luminosities on a logarithmic scale versus the SFR from Hα (left panel) and the absolute B-band magnitude (right panel). The symbols used are the same as those in Fig. 15. The black dots are average values of the sample of Lee et al. (2009, their Table 2). The solid grey lines are the linear least squares fits by Lee et al. (2009). The solid green and dashed orange lines are the regression fit of the entire Dorado sample (Eq. (4) in the left panel and Eq. (6) in the right panel) and for the ETGs (Eq. (5) in the left panel and Eq. (7) in the right panel), respectively. |
| In the text | |
Current usage metrics show cumulative count of Article Views (full-text article views including HTML views, PDF and ePub downloads, according to the available data) and Abstracts Views on Vision4Press platform.
Data correspond to usage on the plateform after 2015. The current usage metrics is available 48-96 hours after online publication and is updated daily on week days.
Initial download of the metrics may take a while.