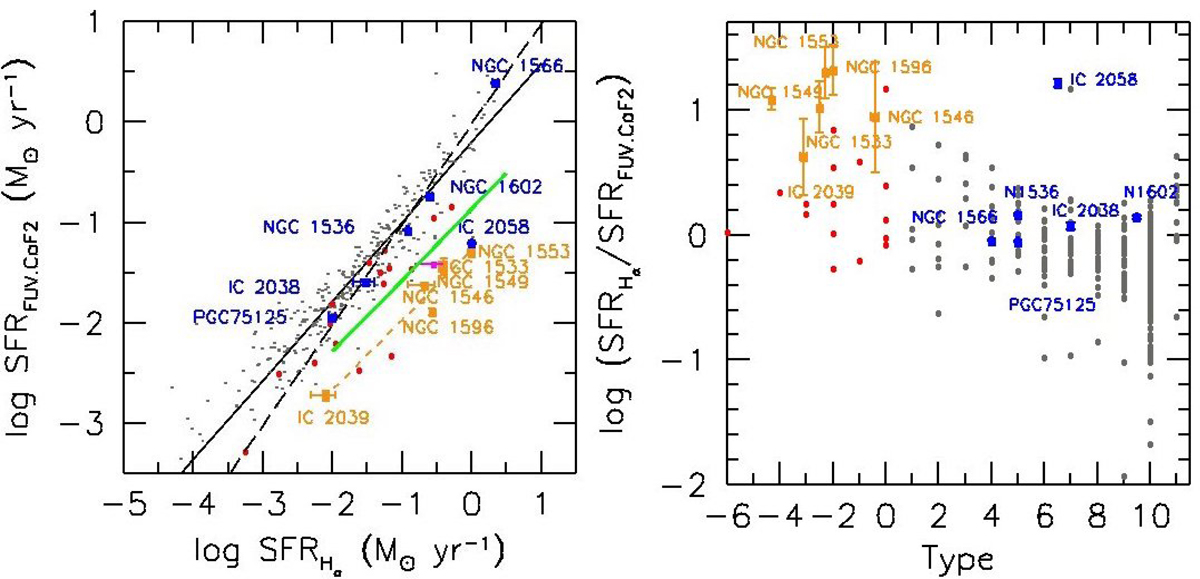
Fig. 15.
Download original image
Left panel: comparison between SFR derived from Hα and FUV.CaF2 luminosities. The Dorado sample is plotted with orange (ETG) and blue (LTG) squares. For comparison, we plot Lee et al. (2009, their Table 2) sample with red (ETG) and grey (LTG) dots. The magenta dot shows NGC 1533 as derived using SFR from Hα by Kaisina et al. (2012) and from FUV.CaF2 measured in this work. All measures account for Galactic extinction, but internal dust attenuation has not been modelled and accounted for. The solid and dashed black lines show the Lee et al. (2009) relation and the one-to-one correspondence, respectively. The solid green and dashed orange lines are the regression fit of the entire Dorado sample (Eq. (3)) and of the ETGs members (Eq. (2)), respectively. Right panel: ratio of SFR from Hα and FUV.CaF2 versus galaxy morphological type.
Current usage metrics show cumulative count of Article Views (full-text article views including HTML views, PDF and ePub downloads, according to the available data) and Abstracts Views on Vision4Press platform.
Data correspond to usage on the plateform after 2015. The current usage metrics is available 48-96 hours after online publication and is updated daily on week days.
Initial download of the metrics may take a while.