Fig. 16.
Download original image
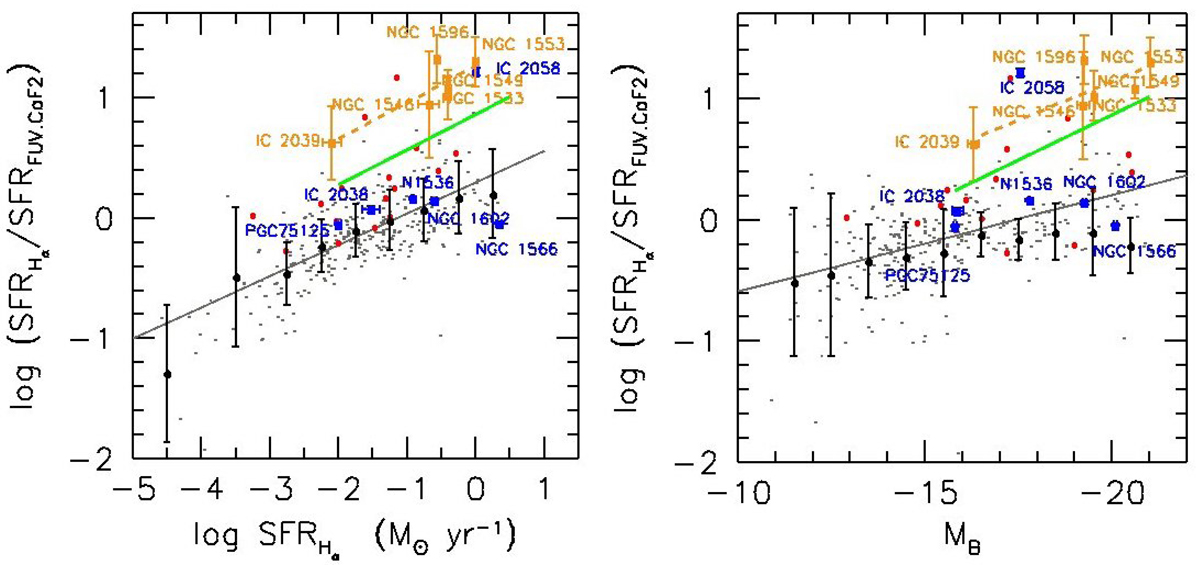
Ratio between the SFR from Hα and FUV.CaF2 luminosities on a logarithmic scale versus the SFR from Hα (left panel) and the absolute B-band magnitude (right panel). The symbols used are the same as those in Fig. 15. The black dots are average values of the sample of Lee et al. (2009, their Table 2). The solid grey lines are the linear least squares fits by Lee et al. (2009). The solid green and dashed orange lines are the regression fit of the entire Dorado sample (Eq. (4) in the left panel and Eq. (6) in the right panel) and for the ETGs (Eq. (5) in the left panel and Eq. (7) in the right panel), respectively.
Current usage metrics show cumulative count of Article Views (full-text article views including HTML views, PDF and ePub downloads, according to the available data) and Abstracts Views on Vision4Press platform.
Data correspond to usage on the plateform after 2015. The current usage metrics is available 48-96 hours after online publication and is updated daily on week days.
Initial download of the metrics may take a while.