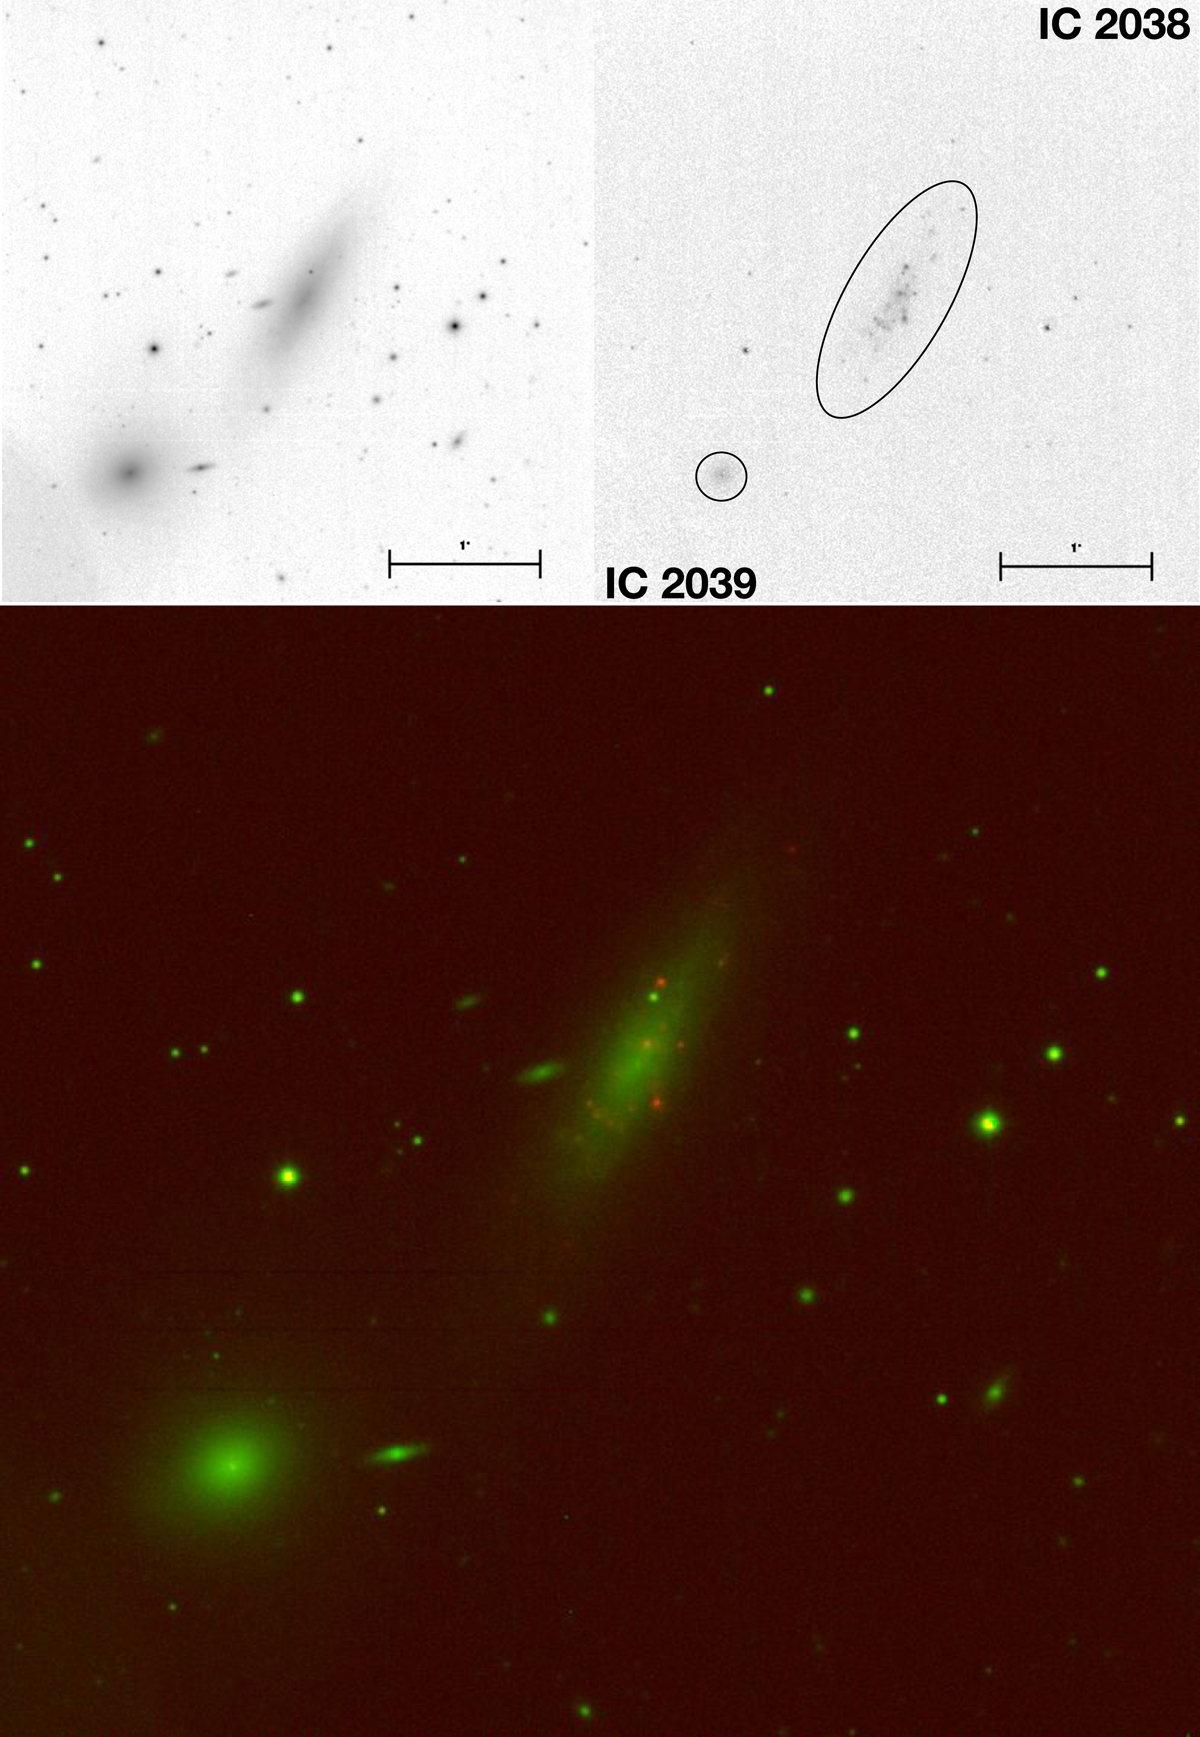
Fig. 3.

Pair IC2038 (NW) and IC2039 (SE) in continuum (top left panel) and in the Hα+[NII] light (top right panel). The image size is 4′×4′. North is towards the top, and east is to the left. Residuals of stars have been masked. The ellipse, whose parameters are given in Table 2, encloses the integration area. The bottom panel shows a two-colour image of the pair (continuum in green and Hα+[N II] in red) that highlights a large numbers of brights HII regions.
Current usage metrics show cumulative count of Article Views (full-text article views including HTML views, PDF and ePub downloads, according to the available data) and Abstracts Views on Vision4Press platform.
Data correspond to usage on the plateform after 2015. The current usage metrics is available 48-96 hours after online publication and is updated daily on week days.
Initial download of the metrics may take a while.


