Free Access
Fig. 8.
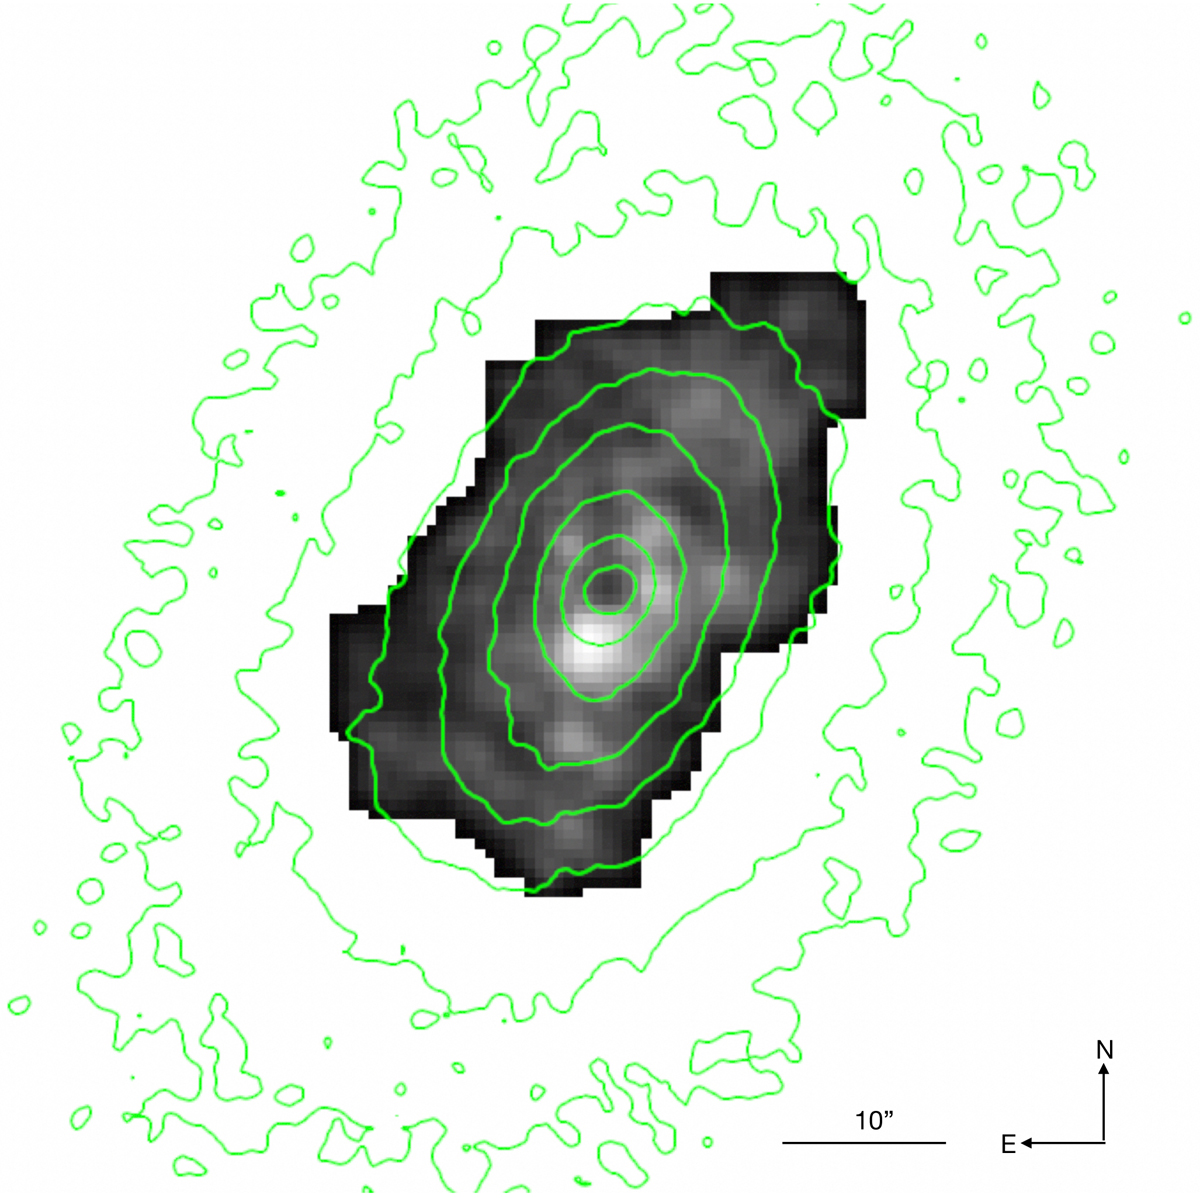
NGC 1553: Hα monochromatic map obtained from Fabry-Perot (Rampazzo et al. 2003) overplotted to the present Hα+[N II] contours. The Hα emission is clumpy and extends for about 30″. We note that the Hα peak is displaced from the Hα+[N II] centre and corresponds to the X-ray source Chandra CXOU J041610.5-554646.8.
Current usage metrics show cumulative count of Article Views (full-text article views including HTML views, PDF and ePub downloads, according to the available data) and Abstracts Views on Vision4Press platform.
Data correspond to usage on the plateform after 2015. The current usage metrics is available 48-96 hours after online publication and is updated daily on week days.
Initial download of the metrics may take a while.