| Issue |
A&A
Volume 641, September 2020
|
|
|---|---|---|
| Article Number | A167 | |
| Number of page(s) | 10 | |
| Section | Extragalactic astronomy | |
| DOI | https://doi.org/10.1051/0004-6361/202038575 | |
| Published online | 25 September 2020 | |
Possible mechanism for multiple changing-look phenomena in active galactic nuclei
1
Nicolaus Copernicus Astronomical Center (PAN), ul. Bartycka 18, 00-716 Warsaw, Poland
e-mail: This email address is being protected from spambots. You need JavaScript enabled to view it.
2
Center for Theoretical Physics, Polish Academy of Sciences, Al. Lotników 32/46, 02-668 Warsaw, Poland
e-mail: This email address is being protected from spambots. You need JavaScript enabled to view it.
3
Astronomical Observatory Belgrade, Volgina 7, 11060 Belgrade, Serbia
Received:
3
June
2020
Accepted:
3
July
2020
Abstract
Context. The changing-look phenomenon observed in a growing number of active galaxies challenges our understanding of the accretion process close to a black hole.
Aims. We propose a simple explanation for the sources where multiple semi-periodic outbursts are observed, and the sources are operating close to the Eddington limit.
Methods. The outburst are caused by the radiation pressure instability operating in the narrow ring between the standard gas-dominated outer disk and the hot optically thin inner advection-dominated accretion flow. The corresponding limit cycle is responsible for periodic outbursts, and the timescales are much shorter than the standard viscous timescale due to the narrowness of the unstable radial zone.
Results. Our toy model gives quantitative predictions and works well for multiple outbursts like those observed in NGC 1566, NGC 4151, NGC 5548, and GSN 069, although the shapes of the outbursts are not yet well modeled, and further development of the model is necessary.
Key words: accretion / accretion disks / galaxies: active
© ESO 2020
1. Introduction
Active galactic nuclei have been always known as strongly variable sources in most of their broadband spectra (e.g., IR: Edelson & Malkan 1987; Kozłowski et al. 2016; optical: Ulrich et al. 1997; Kawaguchi et al. 1998; Sesar et al. 2007; X-ray: Ulrich et al. 1997; Lawrence & Papadakis 1993). Most of the variability can be attributed to variations in the red noise, both in the optical and in the X-ray band (McHardy & Czerny 1987; Lehto et al. 1993; Czerny et al. 1999; Gaskell & Klimek 2003). However, some of the observed changes lead to far more dramatic changes than expected from the red noise trend. These changes are sometimes revealed in the temporary change of the source classification, and these sources are known as changing-look AGN (CL AGN; Matt et al. 2003). There is no well-established definition of what can or cannot be classified as a CL AGN, and we adopted the view that the name can be used for the broad class of objects, not necessarily showing confirmed changes in the optical flux. With progressing understanding of the mechanisms, proper classification will be certainly introduced.
The CL AGN phenomenon was once considered rather rare. The changes corresponded either to a drastic change in X-ray spectrum or in the optical/UV emission lines and continuum, depending on the studied wavelength range (Bianchi et al. 2005; Denney et al. 2014; Shappee et al. 2014). On the other hand, historical light curves of nearby sources, including well-studied AGN (e.g., Cohen et al. 1986; Iijima et al. 1992; Storchi-Bergmann et al. 1993; Bon et al. 2016; Oknyanskij et al. 2016; Shapovalova et al. 2019) indicated that such episodes do happen. With ever more optical and X-ray surveys, the number of CL AGN is rapidly growing (Ruan et al. 2016; Ross et al. 2018; Yang et al. 2018; Stern et al. 2018; Trakhtenbrot et al. 2019; MacLeod et al. 2019), and the question regarding the mechanism of the phenomenon must be addressed. The most extreme case of this phenomenon in the form of quasi-periodic eruptions (QPEs) has recently been discovered by Miniutti et al. (2019) and Giustini et al. (2020).
There is an ongoing discussion whether the phenomenon is intrinsic to the central engine of the active galaxy or just a result of a temporary obscuration or disappearance of such obscuration. While for some CL AGN phenomena the obscuration mechanism can work, for most of the sources there are strong arguments in favor of the intrinsic changes:
– complex multi-band recovery, inconsistent with obscuration (e.g., Mathur et al. 2018);
– strong changes seen in the IR where the obscuration should not play a role (Sheng et al. 2017; Stern et al. 2018);
– low level of polarization in CL AGN which argues against the scattering (and obscuration) scenario (Hutsemékers et al. 2019);
– different variability behaviors of the observed emission lines in spectra of CL AGN (e.g., Kynoch et al. 2019);
– regular QPE behavior cannot be due obscuration because of the characteristic spectral evolution during outbursts (Miniutti et al. 2019; Giustini et al. 2020).
Thus, in most sources the intrinsic change in the bolometric luminosity later affects the X-ray spectra and the appearance of the broad-line regions (BLR). These intrinsic changes can either be related to tidal disruption events (TDEs) or can be a result of the spontaneous unforced behavior of the accretion flow close to a black hole. In some cases perhaps TDEs provide the answer, but in sources with repeated events a TDE is statistically unlikely.
In the present paper we concentrate on the discussion of the plausible mechanism that can lead to regular or semi-regular repeating outbursts intrinsic to the nucleus. In such cases the source behavior might be related to some instabilities in the accretion flow. However, the radiation pressure instability expected to be operational in the innermost part of an AGN accretion disk does not provide the proper timescales (e.g., Gezari et al. 2017). Convenient formulae for the duration of such outbursts given in Grzȩdzielski et al. (2017) give timescales of hundreds of years for a black hole mass of 107 M⊙. Dexter & Begelman (2019) suggest that strong magnetization can shorten the estimated timescales. On the other hand, we can look for another mechanism related to the complexity of the innermost part of the flow, and Noda & Done (2018) propose that the CL behavior in the source Mrk 1018 is related to the temporary disappearance of the warm corona. The source NGC 1566 notable for numerous CL outbursts (e.g., Alloin et al. 1986; Baribaud et al. 1992; Oknyansky et al. 2019) does not show the presence of the warm corona component before the outburst (Parker et al. 2019). The present observations cannot resolve directly any of these issues since they show at best the presence of the gas reservoir at a distance of 60 pc from the black hole (Mkn 590; Raimundo et al. 2019). They only show that the phenomenon is complex; for example, the reappearance of broad lines in Mkn 590 is not accompanied by the full recovery of the continuum (Raimundo et al. 2019).
In this paper we propose a new mechanism that is suitable for explaining regular outbursts in sources that are not very close to the Eddington ratio. Using a highly simplified toy model we discuss whether the mechanism is likely to reproduce the observed timescales, and thus deserves the effort of more detailed description in the future.
2. Analytical estimates and the model geometry
The character of the accretion flow in AGN strongly depends on the Eddington ratio of the source. In sources where the Eddington ratio is above a few percent, the optically thick geometrically thin disk extends down to the innermost stable circular orbit (ISCO). Modeling of the optical/UV emission of quasars supports this view (e.g., Capellupo et al. 2015), although warm corona need to be invoked to explain the soft X-ray excess. However, low-luminosity AGN, showing low-ionization nuclear emission-line regions (LINERS) do not show this component in the optical/UV spectra, and it is generally accepted that in these sources the innermost part of the accretion flow proceeds in the form of an optically thin advection-dominated accretion flow (ADAF).
For simplicity, we introduce here a definition of the Eddington accretion rate based on Newtonian physics:
 (1)
(1)
Here MBH is the black hole mass, mp is the proton mass, and σT is the Thomson cross-section. We thus measure the ratio of the accretion rate to the Eddington accretion rate using ṁ = Ṁ/ṀEdd.
In these units, the transition between an inner ADAF flow and an outer standard accretion disk (Abramowicz et al. 1995; Czerny et al. 2019) takes place at
 (2)
(2)
where α0.1 is the viscosity parameter introduced by Shakura & Sunyaev (1973) in units of 0.1, and RSchw = 2GMBH/ c2 is the Schwarzschild radius of the black hole.
A standard accretion disk is unstable in the innermost part when the radiation pressure dominates (Lightman & Eardley 1974; Pringle et al. 1973; Shakura & Sunyaev 1976), and the transition from the outer stable to the inner unstable radius takes place at
 (3)
(3)
(Shakura & Sunyaev 1973). Here m is the black hole mass expressed in units of 107 M⊙. The two lines cross at the specific accretion rate, ṁst,
 (4)
(4)
where the dependence on the black hole mass is negligible, but the dependence on the viscosity coefficient is stronger than linear. The radius where it happens is given by
 (5)
(5)
If the accretion rate of the flow is lower than this limiting value, ṁst, the whole flow is stable since both the gas-dominated cold outer disk and the inner ADAF flow are stable solutions. On the other hand, if the accretion rate is higher that ṁst the disk range is dominated by the radiation pressure, which is unstable and could lead to a limit cycle behavior.
The timescale for these oscillations is generally set by the viscous timescale of the Shakura-Sunyaev disk,
 (6)
(6)
(Shakura & Sunyaev 1973; see, e.g., a review by Czerny 2006), which is hundreds of years for the case of AGN. However, if ṁ is just above the threshold defined by Eq. (4), then the radial extension of the unstable zone, δR, is much smaller than the radius R itself. We illustrate schematically this geometry in Fig. 1. In this case, the time needed to empty the zone is reduced, and the viscous evolution will happen on the following timescale:
 (7)
(7)
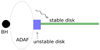 |
Fig. 1. Schematic view of the innermost part of the flow: outer cold stable disk (green), intermediate zone (disk part unstable due to radiation pressure instability), and inner hot ADAF which illuminates the outer disk. |
Thus, for sources at low Eddington accretion rates the radiation pressure instability, operating in a very narrow zone at the border between the outer standard disk and an inner ADAF flow, can provide a viable mechanism that explains repeating outbursts in some CL AGN on timescales of a few years. The schematic view of our new model of CL AGN is shown in Fig. 1.
The small radial extension of the instability zone reduces also the amount of variable radiation flux by the same factor. On the other hand, the zone regulates the accretion flow in the inner ADAF, and most of the radiation is actually produced there in the form of X-rays. The efficiency of the inner ADAF flow is not well known, but significant part of the energy goes directly to electrons, and subsequently to radiation (e.g., Bisnovatyi-Kogan & Lovelace 1997; Yuan & Narayan 2014; Marcel et al. 2018). The outburst should thus be clearly seen in X-rays; in addition, X-ray irradiation of the cold disk will lead to enhancement of the disk emission in optical/UV band.
3. One-zone time-dependent toy model
We construct a simple toy model in order to check whether the mechanism may indeed give repeated outbursts of the observationally required properties. We basically follow the 1D model of time evolution of accretion disk under radiation pressure instability Janiuk et al. (2002), but we simplify it further by concentrating on a single-zone approximation, thus reducing the numerical problem to ordinary differential equation in time. Instead of solving for vertically averaged disk structure as functions of both time and disk radius, we follow the time-dependent evolution of a single zone, representing the radiation pressure dominated region. It is a good approximation if the radial extension of the zone is small, i.e., if the zone is narrow and comparable to the disk thickness.
The evolution of the zone on thermal timescale is very similar to the one in the multi-radius approach as the thermal evolution results from the net effect of the heating, radiative cooling, and advection cooling. We assume that the disk is in hydrostatic equilibrium. However, the viscous evolution is now set simply by the boundary conditions: (i) between the zone and outer stationary disk and (ii) between the zone and inner ADAF:
– at the border between the zone and the outer disk, we assume a constant inflow rate of the material provided by the stable outer disk, Ṁ0;
– at the border between the zone and the inner ADAF, the material is removed from the disk at a rate Ṁ by evaporation due to the electron conduction.
Since this is a simple toy model, we do not use any advanced description of this process which would require the knowledge of the ADAF density or ion and electron temperature (e.g., Różańska & Czerny 2000; Liu et al. 2007; Qiao & Liu 2020). Instead, we postulate that the efficiency of the process should be proportional to the zone height since the hot inner ADAF is geometrically thick so the interacting surface is set by the cold disk state. We additionally assume that evaporation is more efficient when there is more mass in the unstable zone. If the zone and ADAF happen to be in equilibrium, then the outflow rate from the zone should be equal to the inflow rate. So introducing the equilibrium zone thickness, H0, and equilibrium surface density in the disk, Σ0, our approach allows us to specify the evaporation rate in general as
 (8)
(8)
where the quantities H and Σ describe the height and surface density of the evolving zone. We always start our time-dependent evolution from an equilibrium model, but if the solution corresponds to an unstable one, the disk will perform the limit cycle.
From the two assumptions above, we obtain the time evolution of the surface density in the zone
 (9)
(9)
meaning that it is given by the imbalance between a constant inflow rate into the zone, Ṁ0, and variable outflow rate, Ṁ, from the zone to inner ADAF flow.
The evolution of the zone in the thermal timescale, given by Eq. (33) in Janiuk et al. (2002), under our assumptions, for a narrow zone, reduces to the following equation for the equatorial disk temperature, T:
![Mathematical equation: $$ \begin{aligned}&{\mathrm{d} \log T \over \mathrm{d}t} = {(Q^+ - Q^{-} -Q_{\rm adv})(1 + \beta ) \over P H [(12 - 10.5 \beta )(1 + \beta ) + (4 - 3\beta )^2]} \nonumber \\&\qquad \qquad +2 {\mathrm{d} \log \Sigma \over \mathrm{d}t}{4 - 3\beta \over (12-10.5 \beta )(1+\beta ) + (4 - 3\beta )^2}. \end{aligned} $$](/articles/aa/full_html/2020/09/aa38575-20/aa38575-20-eq10.gif) (10)
(10)
Here the calculation of the derivatives of the disk thickness H are already included in the expression. The values of the disk thickness; total pressure, P; gas-to-total pressure ratio, β; viscous heating, Q+; and radiative cooling, Q−, are determined from the standard equations of the vertically averaged disk structure in hydrostatic equilibrium as in Janiuk et al. (2002), but here we do not introduce any additional correction coefficients related to the disk vertical structure (e.g., C1, C2) since the current model is very simple. The advection cooling term, Qadv, is determined as
 (11)
(11)
so we include only an advection term related to the inflow from the zone to inner ADAF, and we neglect the energy carried into the zone from the outer disk, which should be negligible. Thus, time-dependent partial differential equations (26) and (33) from Janiuk et al. (2002) reduce to ordinary differential equation for the time evolution of a surface density and temperature in the equatorial plane of a single zone.
The geometrically narrow instability zone evolves quickly, but the amount of energy dissipated in this zone is also correspondingly small. Therefore, the changes in the zone luminosity by itself do not change significantly the system luminosity. However, the zone acts as a regulator of the accretion flow in the innermost ADAF.
ADAF flow was frequently considered inefficient, but most estimates of the ion-electron coupling and of the Ohmic heating imply that actually ADAF flow is energetically quite efficient, at least when the accretion rate is not many orders of magnitude below the Eddington accretion rate. (e.g., Bisnovatyi-Kogan & Lovelace 1997; Ferreira & Petrucci 2011; Hirotani 2018). Therefore, the inner part of the flow generates more energy than the outer part of the disk and the transition zone (the exact number would depend on the black hole spin). This energy is emitted in X-rays, but part of the produced X-ray radiation will illuminate the disk and enhance the disk emission.
We thus assume the typical flow efficiency of 10% in ADAF and calculate the result of the disk irradiation. ADAF is an extended medium so in principle this is a complex 2D issue, but in our simple model we represent the ADAF emission by emission localized along the symmetry axes since that allows us to calculate the effect in a simple way: we used the method and the code developed in Loska et al. (2004). This irradiation is very important, strong illumination is observed in reverberation-studied sources like NGC 5548 (Edelson et al. 2015, 2017; De Rosa et al. 2015; Goad et al. 2016; Fausnaugh et al. 2016; Starkey et al. 2017; McHardy et al. 2018; Kriss et al. 2019) where the variable X-ray emission drives the accretion disk continuum variability, although the correlation is not always perfect.
In our toy model we assume, for simplicity, that the inner region luminosity is equal to the total (time-dependent) bolometric luminosity
 (12)
(12)
with the flow efficiency η equal to 0.1, as in radiatively efficient flow. The illumination of the outer disk is calculated semi-analytically, as in Loska et al. (2004), assuming that the emission is localized along the symmetry axis, otherwise 3D computations would be necessary. The emissivity is adopted as a power law with index β = 2.0, the maximum distance is equal to the transition radius Rtr, and the minimum distance along the axis is set at 1/3 of this value. We assume complete local thermalization of the incident flux by the cold disk.
In principle, the free parameters in our models are the black hole mass, the accretion rate, and the viscosity since the location of the transition and the extension of the unstable zone should results from the computations of the disk structure. However, our toy model does not have all the ingredients (such as proper description of the vertical structure, opacity, convection, irradiation; see, e.g., Różańska et al. 1999). So we additionally treat the radius and the zone width as independent parameters.
4. Results
We now use our toy model of radiation pressure instability in a narrow zone between the outer cold disk and an inner hot flow to model the repeating outbursts observed in some AGN. The model parameters are the external accretion rate, Ṁ0; the radius, R; the width of the unstable zone, ΔR; and the viscosity parameter, α, in the zone. The two remaining parameters, Σ0 and H0, are determined self-consistently from the equilibrium (unstable) solution located at the stability curve.
4.1. Stability curve
The stability curve is built of solutions to Eqs. (9) and (10), assuming that all time derivatives are equal to 0. They are conveniently plotted as a function of the external accretion rate, Ṁ. We express it in dimensionless units. In the case of the stationary solution, the accretion rate inside the zone is coupled to the zone properties
 (13)
(13)
as in the standard stationary disk of Shakura & Sunyaev (1973).
The result is shown in Fig. 2 (blue line). Here we adopt parameters appropriate for NGC 1566. For black hole mass we assume log M = 6.92 after Woo & Urry (2002), we adopt the viscosity paramater α0.1 = 0.2 (i.e., α = 0.02) after Grzȩdzielski et al. (2017), and we take 30RSchw for the radius. The zone width is assumed to be very narrow, 0.003R, comparable to the disk thickness.
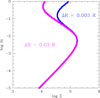 |
Fig. 2. Accretion rate vs. surface density in the transition zone between the cold SS outer disk and the inner ADAF in a stationary model in two cases ΔR = 0.003R (blue points), and ΔR = 0.03R (magenta points). Other parameters: log M = 6.92, R = 30RSchw, α = 0.02. |
Our stability curves in their high accretion rate parts depend on the adopted width of the zone since the advection term in our model explicitly contains it (see Eq. (11)). When the zone is narrow, the advection works very efficiently.
The negative slope of the stability curve implies that the solution is unstable. For the assumed radius and the black hole mass, the flow with accretion rate higher than ṁ ∼ 0.01 is unstable. The upper stable branch starts quite early for a narrow zone, so the instability is expected to operate for ṁ between 0.01 and 0.1 in this case. If the zone width increases, the branch stabilized by advection starts at higher accretion rates, and for ΔR on the order of R the stabilization would happen above the Eddington accretion rate, as in a standard slim disk (Abramowicz et al. 1988). However, our toy model is not expected to work for a geometrically broad zone.
4.2. Time evolution of the accretion rate through the zone
We compute the time evolution of the zone by assuming the value of the black hole mass, the radius, the radial width of the zone, and the viscosity parameter. We then choose the external accretion rate from the range corresponding to the unstable branch. The disk irradiation parameters are fixed, as described in Sect. 3.
Exemplary time evolution of the accretion rate regulated by the unstable zone is given in Fig. 3. We fixed the black hole mass there at the value corresponding to NGC 1566, but we varied the accretion rate, the viscosity parameters, and the radial size of the unstable zone. We see there that the timescales of outbursts and the outburst amplitudes are very sensitive to these parameters. The shape of the outbursts varies less, and in our model the duration of the bright phase (outburst) is always longer then the outburst separation because the accumulation phase is longer than the evaporation rate and the transfer through ADAF. Outbursts are regular since our toy model is very simple. More advanced models of disk instabilities, which include the wind, irradiation, magnetic field, or tidal interaction with a companion in a binary system frequently lead to much more complex outbursts (see, e.g., Hameury 2019, and the references therein). These models, however, do not consider the inner ADAF and narrow instability zone, so our toy model gives interesting estimates of the timescales, and further development may easily lead to more complex light curve shapes.
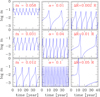 |
Fig. 3. Dependence of the time-dependent accretion rate on the external steady accretion rate, ṁ0; viscosity parameter, α; and the geometrical thickness of the unstable zone, ΔR. The parameters are labeled in each panel. The default parameters are ṁ = 0.0122, α = 0.02, ΔR = 0.003R. The fixed parameters are black hole mass log M = 6.92, inner radius of the disk R = 30RSchw. |
The evolution is significantly slower for more massive black holes. Therefore, in Fig. 4 we show a set of light curves for a black hole mass more appropriate for sources like NGC 5548. In order to model frequent outbursts we have to request values of the higher viscosity parameter.
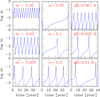 |
Fig. 4. Dependence of the time-dependent accretion rate on the external steady accretion rate, ṁ0; viscosity parameter, α; and the geometrical thickness of the unstable zone, ΔR. The parameters are labeled in each panel. The default parameters are ṁ = 0.006, α = 0.2, ΔR = 0.003R. The fixed parameters are black hole mass log M = 7.94, inner radius of the disk R = 20RSchw. |
4.3. Irradiation of the cold outer disk
As discussed in Sect. 3, the variable accretion rate in the unstable zone and in the innermost part of the flow strongly affects the outer disk. Thus, the variable accretion rate as shown in Fig. 3 must be used to receive the time evolution of the monochromatic flux and the line luminosity.
In Fig. 5 we show two extreme examples of the spectra from an illuminated disk: between the outburst and at the peak of the outburst. For the chosen parameters, given in the figure caption, the flux at V band changes by an order of magnitude and the spectrum becomes much bluer in the far UV. Parameters that were used in this case are ṁ = 0.012 and log M = 6.92, appropriate for NGC 1566.
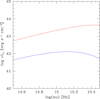 |
Fig. 5. Two extreme states of the accretion disk in the source: between outbursts (blue line) and during outburst (red line). Here we neglect the contribution from the starlight. |
We thus compare the bolometric light curve resulting from the instability to the corresponding monochromatic light curve. As explained in Sect. 3, we derive the monochromatic light curve taking into account the disk plus transition zone flux at V band for all the time steps of the evolution, always using the current value of Ṁ to calculate the disk illumination. The shape of the curve is similar, but not identical, to the shape of the accretion rate variability. An example is shown in Fig. 6. This light curve can be directly compared to the continuum light curve of a given source, but the observed light curve should be corrected for the starlight contamination.
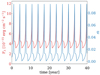 |
Fig. 6. Comparison of the modeled variations of the bolometric luminosity measured as the Eddington ration (blue line) with the modeled variations of the monochromatic disk luminosity in V band (red line), with irradiation included. |
If the line luminosity light curve is available, in principle we should compute the structure of the BLR, but in our toy model we can assume that the line follows the bolometric luminosity of the source, which is well represented by the varying accretion rate.
4.4. Comparison with the observational data
Our toy model is not yet ready for detailed fitting of the observed light curves. What is more, such a comparison would always be inherently difficult since the observed variability in AGN is never strictly periodic. Thus, our aim is to test if the model can roughly cover the characteristic variability timescales in the few exemplary sources. The physical parameters that we obtained for each object are shown in Table 2.
4.4.1. NGC 1566
This source, usually classified as a Seyfert 1.5 galaxy (z = 0.005017 after NED1) is a well-known CL AGN. Its semi-regular outbursts were already observed by Alloin et al. (1986). Later, in September 2017, the source started a spectacular brightening in optical band (Dai et al. 2018), and in X-rays Parker et al. (2019). The bolometric luminosity of the source thus strongly varies from log Lbol = 41.4 (Combes et al. 2019) to log Lbol = 44.45 (Woo & Urry 2002). Parker et al. (2019) reported an Eddington ratio of 0.05 during the outburst and 0.002 between the outbursts.
Mostly concentrating on the old data showing multiple outbursts (see Fig. 7) we assume that the characteristic timescale in this source is 5 years. For the black hole mass we assume the value log M = 6.92 from Woo & Urry (2002) (which is consistent with the value 6.8 ± 0.3 derived from molecular gas dynamics by Combes et al. 2019). We assume the mean accretion rate of ṁ = 0.012 in Eddington units, corresponding to the mean value.
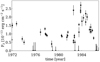 |
Fig. 7. Hβ line flux evolution in NGC 1566 from Alloin et al. (1986). |
We can find an example of the unstable solution for these input parameters assuming the value of 25RSchw for the radius. The zone width is assumed to be very narrow (0.002R, which is comparable to the disk thickness). The required value, α = 0.04, is a factor of 2 larger than the value of α = 0.02 used by Grzȩdzielski et al. (2017). The solution roughly corresponds to the middle panel of Fig. 3
The source behavior, however, is not regular; the last outburst appeared earlier than expected and had higher amplitude than the remaining three. The optical V-band light curve reported by Dai et al. (2018) shows a small outburst lasting about one year, at around 2014, thus shorter by a factor of a few than the outbursts observed by Alloin et al. (1986).
The duration of the outburst seems too short in comparison to the time separation. This is a characteristic property of the current version of the model, particularly for lower accretion rates, and large outburst amplitudes.
4.4.2. NGC 4151
For this source we assume mass from Woo & Urry (2002) (log(MBH/M⊙) = 7.12) and bolometric luminosity 43.73 from Kaspi et al. (2005), z = 0.003262 after NED. We estimate ṁ as 0.027. Guo et al. (2014) suggest three possible periodicities for that source (P1 = 4 ± 0.1, P2 = 7.5 ± 0.3, and P3 = 15.9 ± 0.3 yr). Bon et al. (2012) also derive P = 15.9 yr for that source. The same periodicity is also found in radial velocity curves of Hα broad line. Similar values were suggested by Kovačević et al. (2018) (∼5 and ∼8 years). Oknyanskij & Lyuty (2007) suggest a period of about 15.6 years obtained using power spectrum. However, as Czerny et al. (2003a) shows, changes are not strictly periodic, and the possible characteristic timescale is of order of 10 years.
The photometry continuum flux data set includes data from Bentz et al. (2006), Shapovalova et al. (2008), AGN Watch provided by Kaspi et al. (1996), and Malkov et al. (1997). To reduce the influence of the longest timescale systematic trend (which is probably due to various mechanisms), we rebin the data. The result is shown in Fig. 8.
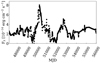 |
Fig. 8. Continuum flux evolution in NGC 4151 points. |
If we adopt the value of 10 years for a characteristic timescale in this source, we require values of the remaining parameters similar to those in the case of NGC 1566. For these parameters outbursts amplitudes are large, and outbursts rather short lasting.
4.4.3. NGC 5548
NGC 5548 is an object with long-term and dense data coverage in various wavelengths (Chiang & Blaes 2003; Mehdipour et al. 2015; Mathur et al. 2017). Optical reverberation campaigns determined the mass of its black hole (Peterson et al. 2004; Bentz & Katz 2015). This complex source is known by the changes of the BLR, which may not be linked with only one physical origin. NGC 5548 showed the obscuration in X-ray and UV range (Kriss et al. 2019), both the intrinsic continuum and the obscurer are variable (Di Gesu et al. 2015). Dehghanian et al. (2019a) and references therein suggest that cloud shadowing should be considered as an appropriate explanation for variability in observation.
We assume the physical parameters for this source as follows: LBOL = 44.45 from Ebrero et al. (2016) and  from Lu et al. (2016), Kovačević et al. (2018) suggest for that source period 13.3 ± 2.26 yr, accretion rate 0.01 from Papadakis et al. (2019); Bon et al. (2016) suggested slightly longer period of ∼5700 days. The continuum flux data set for NGC 5548 includes data from Bon et al. (2016) is shown in Fig. 9.
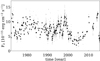 |
Fig. 9. Continuum flux evolution in NGC 5548. Gray points represent observational data, black points represent data rebinned to 300 bins in total. |
We decided to model outbursts with a period of around 13 years. In that case, for the adopted mass and accretion rate as described above we can find the proper representation of the outbursts assuming much higher viscosity and somewhat smaller radius since the timescale is similar to that in the two previous sources, while the black hole mass is an order of magnitude higher.
It is interesting to note that the location of the unstable zone in this source, at a distance of 0.23 light days from the center is nicely consistent with the location of the obscurer (below 0.5 light days) discussed by Dehghanian et al. (2019b).
4.4.4. GSN 069
This relatively low-mass Seyfert galaxy (MBH = 4.5 × 10⁵ M⊙, Miniutti et al. 2019) was inactive when measured by ROSAT. In 2010 it showed a spectacular rise in the nuclear luminosity, followed by a slow decay. During the late decay phase, in December 2018, the source showed spectacularly rapid large amplitude oscillations with a period of roughly 9 hours (Miniutti et al. 2019). The behavior was still observed in February 2019. The nature of these quasi-periodic eruptions (QPE) is not clear, but the spectral changes strongly suggest the coupling with the corona formation and likely the coronal inflow. The outbursts are shown in Fig. 10.
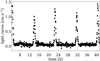 |
Fig. 10. GSN 069 disk contribution in 0.2–2 keV from Miniutti et al. (2019). |
We represented the variations in the disk luminosity using our toy model. We assumed the black hole mass of 4.5 × 10⁵ M⊙, after Miniutti et al. (2019), and we adjusted the remaining parameters to reproduce the timescale. QPE time separation can indeed be reproduced, although it requires a small radius and large value of the viscosity coefficient. The external accretion rate favored by our model (0.013 in Eddington units) is much lower than the bolometric luminosity 0.46 estimated by Miniutti et al. (2019). The low accretion rate was implied by the instability zone present very close to the black hole. Clearly the current toy model does not describe yet the source behavior, and most likely the source performed just disk–corona pulsations, as suggested by Miniutti et al. (2019). If so, more complex model with two-phase disk–corona medium is needed to accurately represent this source.
5. Discussion
The changing-look behavior, rapid large amplitude changes in active galaxies, is reported now with increasing frequency, but the mechanism is still unknown. Some of the phenomena can actually be related to tidal disruptions, particularly in the case of a single, long-lasting large-amplitude event. On the other hand, if multiple events takes place in a single source, particuarly in a semi-regular form, the TDE mechanism is ruled out. There is at least one source where we observe a combination of the two phenomena: a galaxy GSN 069. Classified as a Seyfert 2 galaxy, GSN 069 was undetected in ROSAT All Sky Survey, but in 2010 the source showed a spectacular brightening, and when the dimming continued, the source showed very regular outbursts (Miniutti et al. 2019).
In this paper we concentrate of modeling the repeating semi-regular outbursts observed in the sources radiating at a few percent of the Eddington ratio. We propose that the radiation pressure instability operating in the narrow zone between the outer gas-dominated stable accretion disk and an inner hot ADAF flow may be responsible for repeating outbursts in some CL AGN, such as NGC 1566. We show that the proposed mechanism can lead to outbursts on a timescale much shorter than the usual viscous timescale in a cold disk.
For this mechanism to operate we require that the mean accretion rate in the source be relatively low so the inner ADAF flow extends to a radius that is not much smaller than the radius where the radiation pressure in a standard Keplerian disk dominates. The amplitudes of the outbursts in the optical band are large, due to the irradiation of the outer disk by the enhanced inner hot flow.
The generic prediction of the model is that the spectrum of the nucleus should become much bluer during outburst, and the outbursts in X-ray band should have comparable or larger amplitude. On the other hand, the current model does not give an outburst shape consistent with the observational data. Our toy model relies only on the viscous timescale in the unstable ring close to ADAF, without addressing the full complexity of the standard disk–ADAF transition.
The model predicts strong semi-periodic variations in the emitted flux for sources at a few percent of the Eddington ratio but these changes may, or may not be revealed in the properties of the BLR. If the variability timescale is long in comparison to the time required for the adjustment of the BLR structure to the change of the nuclear emission, then the BLR will follow the changes in the nucleus in a quasi-stationary way, and we should see the classical CL AGN phenomenon. On the other hand, if the nuclear changes do not last long enough, then the BLR may not fully adjust. For example, in sources like GSN 069 the eruption lasts about an hour, while the distance to the BLR is likely a few hours, like in another low-mass Seyfert galaxy NGC 4395 (Peterson et al. 2005). What is more, the light travel time describes just a change in irradiation, while the BLR structure adjusts more slowly (see, e.g., Hryniewicz et al. 2010).
Ross et al. (2018) considered a possibility that the behavior of the quasar J1100-0053 is related to instability in a cold disk–ADAF transition zone, but argues against it since in other objects (e.g., NGC 1097) the transition zone is stable. The position of the transition radius determined by balancing the cold disk evaporation rate and the inner hot flow depends on the global accretion rate (e.g., Różańska & Czerny 2000; Spruit & Deufel 2002; Taam et al. 2012) and seems rather stable. Our solution to the problem comes from introducing the radiation pressure instability. It also implies that for lower Eddington ratio objects the instability would not operate, while for higher Eddington ratio objects this mechanism would lead to outbursts of a much larger part of the disk and it would operate on a timescale of thousands of years, as typically predicted for the radiation pressure instability (Janiuk et al. 2002; Czerny et al. 2009; Wu et al. 2016; Grzȩdzielski et al. 2017). However, if the evolution includes the time-dependent coronal flow (e.g., Janiuk & Czerny 2007) or time-dependent vertical stratification of the disk into cold standard disk and the warm corona (e.g., Czerny et al. 2003b; Gronkiewicz & Różańska 2020; Petrucci et al. 2020), the timescales will be strongly affected by quadratic dependence of the viscous timescale on the ratio of the local medium geometrical thickness to the local radius.
In most cases the outbursts we model are not clearly quasi-periodic (the behavior of the source GSN 069 discovered by Miniutti et al. 2019 is a nice exception) so there is a danger that we try to model the source behavior using a dedicated mechanism, while in reality all AGN show a stochastic variability, and this stochastic variability may lead sometimes, with certain statistical probability, to a behavior that looks quasi-periodic (Vaughan et al. 2016). However, stochastic variability has a well-defined power spectrum shape and normalization, both in X-rays (McHardy et al. 2004) and in the optical band (e.g., Czerny et al. 1999, 2003a). Thus, the amplitude for a given time span is limited. For the studied sources we thus report the observed variability amplitude for a given time period and we compare it to the amplitude expected from the stochastic behavior of AGN. For NGC 1566, NGC 4151, and NGC 5548 this stochastic amplitude was predicted assuming the power spectrum from the recent work of Breedt et al. (2010), including the scaling by a factor of 100 between the optical and the X-ray power spectrum, and the break in the X-ray spectrum for each source was estimated following McHardy et al. (2006). Knowing the optical power spectrum we could predict the source variance expected from the standard stochastic variability. For GSN 069 we estimated the expected X-ray variability from the typical X-ray variability level of AGN Uttley et al. (2002) by averaging the provided σ values for four sources on timescales on the order of 106 s. The dispersion in those values was small, and we took the timescales longer than the length of the used GSN 069 light curve since the level of X-ray variability at a given timescale scales with the black hole mass (e.g., Nikolajuk et al. 2004). All values are reported in Table 1. We see that the observed dispersion is much larger than expected from the stochastic variations. Therefore, invoking a separate mechanism to explain this phenomenon is justified.
Information about sources.
Summary of the results for each object.
The presented toy model is still too simplistic to account quantitatively for the observed outbursts. The comparison shows that the duration of the outburst in some models is far too short in comparison with the rising phase, while is some cases (e.g., GSN 069) they are too long. This is partially because the model does not account properly for the evaporation mechanism of the zone. In a realistic model Eq. (8) should be replaced with the physically motivated equation containing the additional timescale for the process. However, this is not simple. The spectral changes observed in GSN 069 during outbursts (Miniutti et al. 2019) suggest that a Comptonizing corona forms above the disk, and it may be that the real mechanism is actually a two-step mechanism, with corona formation as a stage one, and then the corona inflow as a stage two, finishing outbursts. Thus the future model should have both radial and vertical stratification, perhaps actually a full 2D since the height of the zone is comparable to its radial extension, and it should include full time-dependence of the outer disk since the irradiation would couple to the stability properties. However, such a model is far beyond the aim of the current project.
The second equally important aspect is the time delay in the signal propagation. The current model assumes that the change in the irradiation patters happens without any time delay, while actually the outer parts of the disk react with significant time delay of days, as is well known from reverberation studies of AGN continua (e.g., Collier et al. 1998; Sergeev et al. 2005; Cackett et al. 2007, 2020; Edelson et al. 2015, and the references therein). The response of the emission lines is delayed even more strongly as shown by numerous campaigns (e.g., Liutyi 1977; Collier et al. 1998; Kaspi et al. 2000; Peterson et al. 2004; Grier et al. 2017; Du et al. 2018), thus the final model has to include these effects, particularly in the case of relatively fast variations in the source.
Acknowledgments
We thank Alex Markowitz for helpful discussion and Giovanni Miniutti for providing the data for the source GSN 069 and very helpful comments to the manuscript. The project was partially supported by National Science Centre, Poland, Grant No. 2017/26/A/ST9/00756 (Maestro 9), and by the MNiSW grant DIR/WK/2018/12. Part of the work was done when BC was supported by a Durham Senior Research Fellowship COFUNDed between Durham University and the European Union under Grant agreement number 609412. E.B. and N.B. acknowledge the support of Serbian Ministry of Education, Science and Technological Development, contract number 451-03-68/2020/14/20002. The binned values were generated for this paper was generated using R Core Team (2019).
References
- Abramowicz, M. A., Czerny, B., Lasota, J. P., & Szuszkiewicz, E. 1988, ApJ, 332, 646 [NASA ADS] [CrossRef] [Google Scholar]
- Abramowicz, M. A., Chen, X., Kato, S., Lasota, J.-P., & Regev, O. 1995, ApJ, 438, L37 [NASA ADS] [CrossRef] [Google Scholar]
- Alloin, D., Pelat, D., Phillips, M. M., Fosbury, R. A. E., & Freeman, K. 1986, ApJ, 308, 23 [NASA ADS] [CrossRef] [Google Scholar]
- Baribaud, T., Alloin, D., Glass, I., & Pelat, D. 1992, A&A, 256, 375 [NASA ADS] [Google Scholar]
- Bentz, M. C., & Katz, S. 2015, PASP, 127, 67 [NASA ADS] [CrossRef] [Google Scholar]
- Bentz, M. C., Denney, K. D., Cackett, E. M., et al. 2006, ApJ, 651, 775 [NASA ADS] [CrossRef] [Google Scholar]
- Bianchi, S., Guainazzi, M., Matt, G., et al. 2005, A&A, 442, 185 [NASA ADS] [CrossRef] [EDP Sciences] [Google Scholar]
- Bisnovatyi-Kogan, G. S., & Lovelace, R. V. E. 1997, ApJ, 486, L43 [NASA ADS] [CrossRef] [Google Scholar]
- Bon, E., Jovanović, P., Marziani, P., et al. 2012, ApJ, 759, 118 [NASA ADS] [CrossRef] [Google Scholar]
- Bon, E., Zucker, S., Netzer, H., et al. 2016, ApJS, 225, 29 [NASA ADS] [CrossRef] [EDP Sciences] [Google Scholar]
- Breedt, E., McHardy, I. M., Arévalo, P., et al. 2010, MNRAS, 403, 605 [NASA ADS] [CrossRef] [Google Scholar]
- Cackett, E. M., Horne, K., & Winkler, H. 2007, MNRAS, 380, 669 [NASA ADS] [CrossRef] [Google Scholar]
- Cackett, E. M., Gelbord, J., Li, Y.-R., et al. 2020, ApJ, 896, 1 [CrossRef] [Google Scholar]
- Capellupo, D. M., Netzer, H., Lira, P., Trakhtenbrot, B., & Mejía-Restrepo, J. 2015, MNRAS, 446, 3427 [NASA ADS] [CrossRef] [Google Scholar]
- Chiang, J., & Blaes, O. 2003, ApJ, 586, 97 [NASA ADS] [CrossRef] [Google Scholar]
- Cohen, R. D., Rudy, R. J., Puetter, R. C., Ake, T. B., & Foltz, C. B. 1986, ApJ, 311, 135 [NASA ADS] [CrossRef] [Google Scholar]
- Collier, S. J., Horne, K., Kaspi, S., et al. 1998, ApJ, 500, 162 [NASA ADS] [CrossRef] [Google Scholar]
- Combes, F., García-Burillo, S., Audibert, A., et al. 2019, A&A, 623, A79 [NASA ADS] [CrossRef] [EDP Sciences] [Google Scholar]
- Czerny, B. 2006, in AGN Variability from X-Rays to Radio Waves, IAU Symp., 360 [Google Scholar]
- Czerny, B., Schwarzenberg-Czerny, A., & Loska, Z. 1999, MNRAS, 303, 148 [NASA ADS] [CrossRef] [Google Scholar]
- Czerny, B., Doroshenko, V. T., Nikołajuk, M., et al. 2003a, MNRAS, 342, 1222 [NASA ADS] [CrossRef] [Google Scholar]
- Czerny, B., Nikołajuk, M., Różańska, A., et al. 2003b, A&A, 412, 317 [NASA ADS] [CrossRef] [EDP Sciences] [Google Scholar]
- Czerny, B., Siemiginowska, A., Janiuk, A., Nikiel-Wroczyński, B., & Stawarz, Ł. 2009, ApJ, 698, 840 [NASA ADS] [CrossRef] [Google Scholar]
- Czerny, B., Wang, J.-M., Du, P., et al. 2019, ApJ, 870, 84 [CrossRef] [Google Scholar]
- Dai, X., Stanek, K. Z., Kochanek, C. S., Shappee, B. J., & ASAS-SN Collaboration 2018, ATel, 11893, 1 [Google Scholar]
- De Rosa, G., Peterson, B. M., Ely, J., et al. 2015, ApJ, 806, 128 [NASA ADS] [CrossRef] [Google Scholar]
- Dehghanian, M., Ferland, G. J., Kriss, G. A., et al. 2019a, ApJ, 877, 119 [CrossRef] [Google Scholar]
- Dehghanian, M., Ferland, G. J., Peterson, B. M., et al. 2019b, ApJ, 882, L30 [NASA ADS] [CrossRef] [Google Scholar]
- Denney, K. D., De Rosa, G., Croxall, K., et al. 2014, ApJ, 796, 134 [NASA ADS] [CrossRef] [Google Scholar]
- Dexter, J., & Begelman, M. C. 2019, MNRAS, 483, L17 [NASA ADS] [CrossRef] [Google Scholar]
- Di Gesu, L., Costantini, E., Ebrero, J., et al. 2015, A&A, 579, A42 [NASA ADS] [CrossRef] [EDP Sciences] [Google Scholar]
- Du, P., Zhang, Z.-X., Wang, K., et al. 2018, ApJ, 856, 6 [NASA ADS] [CrossRef] [Google Scholar]
- Ebrero, J., Kaastra, J. S., Kriss, G. A., et al. 2016, A&A, 587, A129 [NASA ADS] [CrossRef] [EDP Sciences] [Google Scholar]
- Edelson, R. A., & Malkan, M. A. 1987, ApJ, 323, 516 [NASA ADS] [CrossRef] [Google Scholar]
- Edelson, R., Gelbord, J. M., Horne, K., et al. 2015, ApJ, 806, 129 [NASA ADS] [CrossRef] [Google Scholar]
- Edelson, R., Gelbord, J., Cackett, E., et al. 2017, ApJ, 840, 41 [NASA ADS] [CrossRef] [Google Scholar]
- Fausnaugh, M. M., Denney, K. D., Barth, A. J., et al. 2016, ApJ, 821, 56 [NASA ADS] [CrossRef] [Google Scholar]
- Ferreira, J., & Petrucci, P. O. 2011, in Jets at All Scales, eds. G. E. Romero, R. A. Sunyaev, & T. Belloni, IAU Symp., 275, 260 [Google Scholar]
- Gaskell, C. M., & Klimek, E. S. 2003, Astron. Astrophys. Trans., 22, 661 [NASA ADS] [CrossRef] [Google Scholar]
- Gezari, S., Hung, T., Cenko, S. B., et al. 2017, ApJ, 835, 144 [NASA ADS] [CrossRef] [Google Scholar]
- Giustini, M., Miniutti, G., & Saxton, R. D. 2020, A&A, 636, L2 [CrossRef] [EDP Sciences] [Google Scholar]
- Goad, M. R., Korista, K. T., De Rosa, G., et al. 2016, ApJ, 824, 11 [NASA ADS] [CrossRef] [Google Scholar]
- Grier, C. J., Trump, J. R., Shen, Y., et al. 2017, ApJ, 851, 21 [CrossRef] [Google Scholar]
- Gronkiewicz, D., & Różańska, A. 2020, A&A, 633, A35 [NASA ADS] [CrossRef] [EDP Sciences] [Google Scholar]
- Grzȩdzielski, M., Janiuk, A., Czerny, B., & Wu, Q. 2017, A&A, 603, A110 [NASA ADS] [CrossRef] [EDP Sciences] [Google Scholar]
- Guo, D. F., Hu, S. M., Tao, J., et al. 2014, Res. Astron. Astrophys., 14, 923 [CrossRef] [Google Scholar]
- Hameury, J. M. 2019, Adv. Space Res., 66, 1004 [Google Scholar]
- Hirotani, K. 2018, Galaxies, 6, 122 [CrossRef] [Google Scholar]
- Hryniewicz, K., Czerny, B., Nikołajuk, M., & Kuraszkiewicz, J. 2010, MNRAS, 404, 2028 [NASA ADS] [Google Scholar]
- Hutsemékers, D., González, B. A., Marin, F., et al. 2019, A&A, 625, A54 [NASA ADS] [CrossRef] [EDP Sciences] [Google Scholar]
- Iijima, T., Rafanelli, P., & Bianchini, A. 1992, A&A, 265, L25 [Google Scholar]
- Janiuk, A., & Czerny, B. 2007, A&A, 466, 793 [NASA ADS] [CrossRef] [EDP Sciences] [Google Scholar]
- Janiuk, A., Czerny, B., & Siemiginowska, A. 2002, ApJ, 576, 908 [NASA ADS] [CrossRef] [Google Scholar]
- Kaspi, S., Maoz, D., Netzer, H., et al. 1996, ApJ, 470, 336 [NASA ADS] [CrossRef] [Google Scholar]
- Kaspi, S., Smith, P. S., Netzer, H., et al. 2000, ApJ, 533, 631 [NASA ADS] [CrossRef] [Google Scholar]
- Kaspi, S., Maoz, D., Netzer, H., et al. 2005, ApJ, 629, 61 [NASA ADS] [CrossRef] [Google Scholar]
- Kawaguchi, T., Mineshige, S., Umemura, M., & Turner, E. L. 1998, ApJ, 504, 671 [NASA ADS] [CrossRef] [Google Scholar]
- Kovačević, A. B., Pérez-Hernández, E., Popović, L. Č., et al. 2018, MNRAS, 475, 2051 [NASA ADS] [CrossRef] [Google Scholar]
- Kozłowski, S., Kochanek, C. S., Ashby, M. L. N., et al. 2016, ApJ, 817, 119 [CrossRef] [Google Scholar]
- Kriss, G. A., De Rosa, G., Ely, J., et al. 2019, ApJ, 881, 153 [CrossRef] [Google Scholar]
- Kynoch, D., Ward, M. J., Lawrence, A., et al. 2019, MNRAS, 485, 2573 [CrossRef] [Google Scholar]
- Lawrence, A., & Papadakis, I. 1993, ApJ, 414, L85 [NASA ADS] [CrossRef] [Google Scholar]
- Lehto, H. J., Czerny, B., & McHardy, I. M. 1993, MNRAS, 261, 125 [NASA ADS] [CrossRef] [Google Scholar]
- Lightman, A. P., & Eardley, D. M. 1974, ApJ, 187, L1 [NASA ADS] [CrossRef] [Google Scholar]
- Liu, B. F., Taam, R. E., Meyer-Hofmeister, E., & Meyer, F. 2007, ApJ, 671, 695 [NASA ADS] [CrossRef] [Google Scholar]
- Liutyi, V. M. 1977, Sov. Astron., 21, 655 [Google Scholar]
- Loska, Z., Czerny, B., & Szczerba, R. 2004, MNRAS, 355, 1080 [NASA ADS] [CrossRef] [Google Scholar]
- Lu, K.-X., Du, P., Hu, C., et al. 2016, ApJ, 827, 118 [CrossRef] [Google Scholar]
- MacLeod, C. L., Green, P. J., Anderson, S. F., et al. 2019, ApJ, 874, 8 [NASA ADS] [CrossRef] [Google Scholar]
- Malkov, Y. F., Pronik, V. I., & Sergeev, S. G. 1997, A&A, 324, 904 [Google Scholar]
- Marcel, G., Ferreira, J., Petrucci, P. O., et al. 2018, A&A, 617, A46 [NASA ADS] [CrossRef] [EDP Sciences] [Google Scholar]
- Mathur, S., Gupta, A., Page, K., et al. 2017, ApJ, 846, 55 [NASA ADS] [CrossRef] [Google Scholar]
- Mathur, S., Denney, K. D., Gupta, A., et al. 2018, ApJ, 866, 123 [NASA ADS] [CrossRef] [Google Scholar]
- Matt, G., Guainazzi, M., & Maiolino, R. 2003, MNRAS, 342, 422 [NASA ADS] [CrossRef] [Google Scholar]
- McHardy, I., & Czerny, B. 1987, Nature, 325, 696 [NASA ADS] [CrossRef] [Google Scholar]
- McHardy, I. M., Papadakis, I. E., Uttley, P., Page, M. J., & Mason, K. O. 2004, MNRAS, 348, 783 [NASA ADS] [CrossRef] [Google Scholar]
- McHardy, I. M., Koerding, E., Knigge, C., Uttley, P., & Fender, R. P. 2006, Nature, 444, 730 [NASA ADS] [CrossRef] [PubMed] [Google Scholar]
- McHardy, I. M., Connolly, S. D., Horne, K., et al. 2018, MNRAS, 480, 2881 [NASA ADS] [CrossRef] [Google Scholar]
- Mehdipour, M., Kaastra, J. S., Kriss, G. A., et al. 2015, A&A, 575, A22 [NASA ADS] [CrossRef] [EDP Sciences] [Google Scholar]
- Miniutti, G., Saxton, R. D., Giustini, M., et al. 2019, Nature, 573, 381 [NASA ADS] [CrossRef] [Google Scholar]
- Nikolajuk, M., Papadakis, I. E., & Czerny, B. 2004, MNRAS, 350, L26 [NASA ADS] [CrossRef] [Google Scholar]
- Noda, H., & Done, C. 2018, MNRAS, 480, 3898 [NASA ADS] [CrossRef] [Google Scholar]
- Oknyanskij, V., & Lyuty, V. 2007, Peremennye Zvezdy Prilozhenie, 7, 28 [Google Scholar]
- Oknyanskij, V. L., Metlova, N. V., Huseynov, N. A., Guo, D.-F., & Lyuty, V. M. 2016, Odessa Astron. Publ., 29, 95 [CrossRef] [Google Scholar]
- Oknyansky, V. L., Winkler, H., Tsygankov, S. S., et al. 2019, MNRAS, 483, 558 [NASA ADS] [CrossRef] [Google Scholar]
- Papadakis, I., Kammoun, E., & Dovciak, M. 2019, Proceedings, 17, 12 [CrossRef] [Google Scholar]
- Parker, M. L., Schartel, N., Grupe, D., et al. 2019, MNRAS, 483, L88 [CrossRef] [Google Scholar]
- Peterson, B. M., Ferrarese, L., Gilbert, K. M., et al. 2004, ApJ, 613, 682 [NASA ADS] [CrossRef] [Google Scholar]
- Peterson, B. M., Bentz, M. C., Desroches, L.-B., et al. 2005, ApJ, 632, 799 [NASA ADS] [CrossRef] [Google Scholar]
- Petrucci, P. O., Gronkiewicz, D., Rozanska, A., et al. 2020, A&A, 634, A85 [CrossRef] [EDP Sciences] [Google Scholar]
- Planck Collaboration I. 2014, A&A, 571, A1 [NASA ADS] [CrossRef] [EDP Sciences] [Google Scholar]
- Pringle, J. E., Rees, M. J., & Pacholczyk, A. G. 1973, A&A, 29, 179 [NASA ADS] [Google Scholar]
- Qiao, E., & Liu, B. F. 2020, MNRAS, 492, 615 [CrossRef] [Google Scholar]
- R Core Team 2019, R: A Language and Environment for Statistical Computing, R Foundation for Statistical Computing, Vienna, Austria [Google Scholar]
- Raimundo, S. I., Vestergaard, M., Koay, J. Y., et al. 2019, MNRAS, 486, 123 [CrossRef] [Google Scholar]
- Ross, N. P., Ford, K. E. S., Graham, M., et al. 2018, MNRAS, 480, 4468 [CrossRef] [Google Scholar]
- Różańska, A., & Czerny, B. 2000, MNRAS, 316, 473 [NASA ADS] [CrossRef] [Google Scholar]
- Różańska, A., Czerny, B., Życki, P. T., & Pojmański, G. 1999, MNRAS, 305, 481 [NASA ADS] [CrossRef] [Google Scholar]
- Ruan, J. J., Anderson, S. F., Cales, S. L., et al. 2016, ApJ, 826, 188 [NASA ADS] [CrossRef] [Google Scholar]
- Sergeev, S. G., Doroshenko, V. T., Golubinskiy, Y. V., Merkulova, N. I., & Sergeeva, E. A. 2005, ApJ, 622, 129 [NASA ADS] [CrossRef] [Google Scholar]
- Sesar, B., Ivezić, Ž., Lupton, R. H., et al. 2007, AJ, 134, 2236 [NASA ADS] [CrossRef] [Google Scholar]
- Shakura, N. I., & Sunyaev, R. A. 1973, A&A, 24, 337 [NASA ADS] [Google Scholar]
- Shakura, N. I., & Sunyaev, R. A. 1976, MNRAS, 175, 613 [NASA ADS] [CrossRef] [Google Scholar]
- Shapovalova, A. I., Popović, L. Č., Collin, S., et al. 2008, A&A, 486, 99 [NASA ADS] [CrossRef] [EDP Sciences] [Google Scholar]
- Shapovalova, A. I., Popović, L. Č., et al. 2019, MNRAS, 485, 4790 [NASA ADS] [CrossRef] [Google Scholar]
- Shappee, B. J., Prieto, J. L., Grupe, D., et al. 2014, ApJ, 788, 48 [NASA ADS] [CrossRef] [Google Scholar]
- Sheng, Z., Wang, T., Jiang, N., et al. 2017, ApJ, 846, L7 [NASA ADS] [CrossRef] [Google Scholar]
- Spruit, H. C., & Deufel, B. 2002, A&A, 387, 918 [NASA ADS] [CrossRef] [EDP Sciences] [Google Scholar]
- Starkey, D., Horne, K., Fausnaugh, M. M., et al. 2017, ApJ, 835, 65 [NASA ADS] [CrossRef] [Google Scholar]
- Stern, D., McKernan, B., Graham, M. J., et al. 2018, ApJ, 864, 27 [NASA ADS] [CrossRef] [Google Scholar]
- Storchi-Bergmann, T., Baldwin, J. A., & Wilson, A. S. 1993, ApJ, 410, L11 [NASA ADS] [CrossRef] [Google Scholar]
- Taam, R. E., Liu, B. F., Yuan, W., & Qiao, E. 2012, ApJ, 759, 65 [CrossRef] [Google Scholar]
- Trakhtenbrot, B., Arcavi, I., MacLeod, C. L., et al. 2019, ApJ, 883, 94 [CrossRef] [Google Scholar]
- Ulrich, M.-H., Maraschi, L., & Urry, C. M. 1997, ARA&A, 35, 445 [NASA ADS] [CrossRef] [Google Scholar]
- Uttley, P., McHardy, I. M., & Papadakis, I. E. 2002, MNRAS, 332, 231 [NASA ADS] [CrossRef] [Google Scholar]
- Vaughan, S., Uttley, P., Markowitz, A. G., et al. 2016, MNRAS, 461, 3145 [NASA ADS] [CrossRef] [Google Scholar]
- Woo, J.-H., & Urry, C. M. 2002, ApJ, 579, 530 [NASA ADS] [CrossRef] [Google Scholar]
- Wu, Q., Czerny, B., Grzedzielski, M., et al. 2016, ApJ, 833, 79 [NASA ADS] [CrossRef] [Google Scholar]
- Yang, Q., Wu, X.-B., Fan, X., et al. 2018, ApJ, 862, 109 [NASA ADS] [CrossRef] [Google Scholar]
- Yuan, F., & Narayan, R. 2014, ARA&A, 52, 529 [NASA ADS] [CrossRef] [Google Scholar]
All Tables
All Figures
|
Fig. 1. Schematic view of the innermost part of the flow: outer cold stable disk (green), intermediate zone (disk part unstable due to radiation pressure instability), and inner hot ADAF which illuminates the outer disk. |
| In the text | |
|
Fig. 2. Accretion rate vs. surface density in the transition zone between the cold SS outer disk and the inner ADAF in a stationary model in two cases ΔR = 0.003R (blue points), and ΔR = 0.03R (magenta points). Other parameters: log M = 6.92, R = 30RSchw, α = 0.02. |
| In the text | |
|
Fig. 3. Dependence of the time-dependent accretion rate on the external steady accretion rate, ṁ0; viscosity parameter, α; and the geometrical thickness of the unstable zone, ΔR. The parameters are labeled in each panel. The default parameters are ṁ = 0.0122, α = 0.02, ΔR = 0.003R. The fixed parameters are black hole mass log M = 6.92, inner radius of the disk R = 30RSchw. |
| In the text | |
|
Fig. 4. Dependence of the time-dependent accretion rate on the external steady accretion rate, ṁ0; viscosity parameter, α; and the geometrical thickness of the unstable zone, ΔR. The parameters are labeled in each panel. The default parameters are ṁ = 0.006, α = 0.2, ΔR = 0.003R. The fixed parameters are black hole mass log M = 7.94, inner radius of the disk R = 20RSchw. |
| In the text | |
|
Fig. 5. Two extreme states of the accretion disk in the source: between outbursts (blue line) and during outburst (red line). Here we neglect the contribution from the starlight. |
| In the text | |
|
Fig. 6. Comparison of the modeled variations of the bolometric luminosity measured as the Eddington ration (blue line) with the modeled variations of the monochromatic disk luminosity in V band (red line), with irradiation included. |
| In the text | |
|
Fig. 7. Hβ line flux evolution in NGC 1566 from Alloin et al. (1986). |
| In the text | |
|
Fig. 8. Continuum flux evolution in NGC 4151 points. |
| In the text | |
|
Fig. 9. Continuum flux evolution in NGC 5548. Gray points represent observational data, black points represent data rebinned to 300 bins in total. |
| In the text | |
|
Fig. 10. GSN 069 disk contribution in 0.2–2 keV from Miniutti et al. (2019). |
| In the text | |
Current usage metrics show cumulative count of Article Views (full-text article views including HTML views, PDF and ePub downloads, according to the available data) and Abstracts Views on Vision4Press platform.
Data correspond to usage on the plateform after 2015. The current usage metrics is available 48-96 hours after online publication and is updated daily on week days.
Initial download of the metrics may take a while.