| Issue |
A&A
Volume 641, September 2020
|
|
|---|---|---|
| Article Number | A154 | |
| Number of page(s) | 13 | |
| Section | Planets and planetary systems | |
| DOI | https://doi.org/10.1051/0004-6361/201935477 | |
| Published online | 24 September 2020 | |
Vacuum ultraviolet photoabsorption spectroscopy of space-related ices: 1 keV electron irradiation of nitrogen- and oxygen-rich ices
1
School of Electronic Engineering and Computer Science, Queen Mary University of London,
Mile End Road,
London
E1 4NS, UK
e-mail: This email address is being protected from spambots. You need JavaScript enabled to view it.
2
Astronomical Institute of Slovak Academy of Sciences,
059 60
Tatranská Lomnica, Slovakia
3
School of Physical Sciences, The Open University,
Walton Hall,
Milton Keynes
MK7 6AA, UK
4
ISA, Department of Physics and Astronomy, Aarhus University,
Ny Munkegade 120,
8000
Aarhus C, Denmark
5
School of Physical Sciences, University of Kent,
Park Wood Rd,
Canterbury
CT2 7NH, UK
6
INAF – Osservatorio Astrofisico di Catania,
Via Santa Sofia 78,
Catania
95123, Italy
Received:
15
March
2019
Accepted:
24
July
2020
Abstract
Context. Molecular oxygen, nitrogen, and ozone have been detected on some satellites of Saturn and Jupiter, as well as on comets. They are also expected to be present in ice-grain mantles within star-forming regions. The continuous energetic processing of icy objects in the Solar System induces physical and chemical changes within the ice. Laboratory experiments that simulate energetic processing (ions, photons, and electrons) of ices are therefore essential for interpreting and directing future astronomical observations.
Aims. We provide vacuum ultraviolet (VUV) photoabsorption spectroscopic data of energetically processed nitrogen- and oxygen-rich ices that will help to identify absorption bands and/or spectral slopes observed on icy objects in the Solar System and on ice-grain mantles of the interstellar medium.
Methods. We present VUV photoabsorption spectra of frozen O2 and N2, a 1:1 mixture of both, and a new systematic set of pure and mixed nitrogen oxide ices. Spectra were obtained at 22 K before and after 1 keV electron bombardment of the ice sample. Ices were then annealed to higher temperatures to study their thermal evolution. In addition, Fourier-transform infrared spectroscopy was used as a secondary probe of molecular synthesis to better identify the physical and chemical processes at play.
Results. Our VUV data show that ozone and the azide radical (N3) are observed in our experiments after electron irradiation of pure O2 and N2 ices, respectively. Energetic processing of an O2:N2 = 1:1 ice mixture leads to the formation of ozone along with a series of nitrogen oxides. The electron irradiation of solid nitrogen oxides, pure and in mixtures, induces the formation of new species such as O2, N2, and other nitrogen oxides not present in the initial ice. Results are discussed here in light of their relevance to various astrophysical environments. Finally, we show that VUV spectra of solid NO2 and water can reproduce the observational VUV profile of the cold surface of Enceladus, Dione, and Rhea, strongly suggesting the presence of nitrogen oxides on the surface of the icy Saturn moons.
Key words: astrochemistry / molecular processes / methods: laboratory: molecular / techniques: spectroscopic / planets and satellites: surfaces / ultraviolet: planetary systems
© ESO 2020
1 Introduction
It is well known that ices in different astrophysical environments are continuously exposed to energetic processing by photons, electrons, and ions that in some circumstances are particularly intense, for instance, in the magnetospheres of giant planets, within which many icy satellites are embedded. As a result, a variety of new chemical species are formed upon irradiation of icy dust mantles in the interstellar medium (ISM) and ice surfaces of the Solar System. On board the upcoming NASA James Webb Space Telescope (JWST) space mission, four instruments of unprecedented sensitivity (signal-to-noise ratio, S∕N ~ 100−300) and spectral resolution (R ~ 1500−3000) over a wide wavelength range from the optical to the infrared (0.6−28.3 μm, called NIRISS, NiRCam, NIRSpec, and MIRI) will systematically map ices across the sky by tracing many different evolutionary stages of star formation in space. A systematic set of vacuum ultraviolet-visible (VUV-vis) and near-infrared (NIR) laboratory spectra of the main interstellar ice species at appropriate temperatures will be particularly useful to aid radiative transfer modeling of protostars and disks observed by the JWST to better account for the amount of stellar radiation absorbed in the UV-vis and NIR by ices in the midplane of the disk (McClure 2019). Furthermore, a future ESA mission, the Jupiter ICy moons Explorer (JUICE), is set to make detailed observations of the giant gaseous planet Jupiter and three of its largest moons, Ganymede, Callisto, and Europa (Banks 2012). On board the spacecraft, two instruments will cover the VUV-vis range: the UV imaging Spectrograph (UVS, 55− 210 nm with spectral resolution ≤ 0.6 nm), and the Moons and Jupiter Imaging Spectrometer (MAJIS, 400−5400 nm with spectral resolution 3−7 nm). This mission will be pivotal to our understanding of the Jovian system and can potentially unravel its history.
Because the two spectrometers on board the JUICE spacecraft will not cover the spectral region around 300 nm, a correct interpretation of the observational data can only be achieved by comparing these data to systematic VUV-UV-vis studies of laboratory analog materials in the full spectral range (100−700 nm). However, to date, laboratory studies of energetically processed ices are mostly carried out in the mid-infrared (MIR) spectral range by means of Fourier-transform infrared (FT-IR) spectroscopy (e.g., Robert Wu et al. 2002; Palumbo et al. 2008; Martin-Domenech et al. 2016; Hudson 2018), and only a few are in the UV-vis (Jones et al. 2014b; Bouwman et al. 2008). Laboratory results on astrophysically relevant ices obtained in the VUV spectral range are equally sparse. To our knowledge, most VUV spectroscopic studies of ices have explored pure molecules or simple mixtures (e.g., Mason et al. 2006; Sivaraman et al. 2014; Cruz-Diaz et al. 2014a,b; Wu et al. 2012; Lo et al. 2018, 2019; Chou et al. 2020), and there have been only a few VUV photoabsorption studies of electron-irradiated ices in the spectral range 100− 200 nm (Wu et al. 2013a,b).
Previous work has shown that molecules such as sulfur dioxide (SO2) and ozone (O3) can be potentially identified in Solar System objects in the VUV-UV-vis spectral range by comparing laboratory VUV-UV-vis data with available observational databases from previous missions such as Galileo, the Hubble Space Telescope, and Cassini (e.g., Boduch et al. 2016). Here we present the first results of an ongoing experimental program aimed at systematically measuring VUV-UV-vis photoabsorption spectra in the range 115− 700 nm of ices irradiated with energetic (1 keV) electrons under conditions relevant to the icy bodies of the Solar System and ice mantles of interstellar grains. Complementary FT-IR spectra of the same ices are also acquired to aid in the interpretation of the results. Our ultimate goal is to provide systematic VUV data that will help to identify spectral features such as absorption bands and/or spectral slopes as observed on icy objects in the Solar System by previous space-borne missions and the upcoming JUICE spacecraft. Our data will also help interpret JWST observations of star-forming regions in the ISM by providing valuable information on the VUV photoabsorption spectra of pure and mixed molecular ices as a function of temperature and exposure dose to 1 keV electrons. Finally, VUV photoabsortion spectra of pure molecules will aid in the interpretation of photodesorption studies of the same species under space conditions.
This first study focuses on the VUV photoabsorption spectra of nitrogen oxides (Nx Oy) both deposited and formed upon 1 keV electron irradiation of mixed homonuclear species, that is, the simplest astronomically relevant ice analogs. We present VUV-UV spectra (115−340 nm) of molecular oxygen (O2), nitrogen (N2), and a 1:1 mixture over the temperature range 22−50 K before and after 1 keV electron bombardment. VUV absorption spectra of electron-irradiated ices of nitrogen oxide species, pure and combined in binary mixtures, are also presented for the first time. The choice of studying nonpolar homonuclear molecules was made because N2 and O2 are the most abundant gas-phase species in the Earth’s atmosphere and are relevant to life. Moreover, they are observed in various environments in space (e.g., Elsila et al. 1997; Caselli et al. 2002; Bieler et al. 2015), and their surface chemistry can potentially play an important role in the formation of nitrogen oxides as well as other more complex species (e.g., Boduch et al. 2012; Sicilia et al. 2012; Vasconcelos et al. 2017).
Although molecular oxygen and nitrogen are abundantly present in the Solar System, their elusive presence in the ISM can be explained by the fact that both species are symmetric diatomic molecules with no allowed rotational or vibrational dipole transitions. Unlike most of the observed species in the ISM, molecular oxygen and nitrogen can therefore not be directly detected through either millimeter-wavelength observations of rotational emission lines or infrared spectroscopic detection of absorption or emission vibrational bands. Molecular nitrogen has been detected in diffuse interstellar clouds through its spectral lines, however, which are created by electronic transitions in the molecule at far-ultraviolet wavelengths toward the star HD 124314 by the Far Ultraviolet Spectroscopic Explorer (FUSE) mission (Knauth et al. 2004). Upper limits for molecular O2 in the ISM were found by a deep search toward low-mass protostars, NGC 1333-IRAS 4A (O2 /H2 < 6 × 10⁻⁹), by means of the Herschel Space Observatory (Yildiz et al. 2013).
In the ISM, gaseous O2 and N2 are thoughtto form primarily through the barrierless neutral-neutral reactions O + OH →O2 + H and N + NH →N2 + H (alternatively, N + OH →NO + H followed by N + NO →N2 + O), respectively,in cold and warm environments (Pineau des Forets et al. 1990; Hincelin et al. 2011). However, “nonenergetic” O2 and N2 surface formation reaction pathways on cold interstellar grains in dark clouds are also possible at low temperatures (10− 20 K; Tielens & Hagen 1982). Laboratory and modeling work have shown that the chemistry involving O2 - and N2 -rich ices leads to the formation of O- and N-bearing inorganic and organic species throughout the star formation process (e.g., Herbst & van Dishoeck 2009; van Dishoeck et al. 2013). Although N2 is mostly inert to nonenergetic atom addition reactions, the surface hydrogenation of O2 ice forms solid water, the most abundant species detected on interstellar ice grains (e.g., Ioppolo et al. 2008, 2010; Miyauchi et al. 2008; Matar et al. 2008; Boogert et al. 2015). It is still debated, however, whether solid O2 and N2 observed in the Solar System have an interstellar origin.
Among the many important results obtained by the Rosetta Orbiter mass Spectrometer for Ion and Neutral Analysis (ROSINA) was the measurement of very high ratios of O2 /H2O in the coma of comet 67P/Churyumov-Gerasimenko. This ratio fluctuates from 1 to 10% and has a mean value of 3.8 ± 0.85% (Bieler et al. 2015). In addition, Rubin et al. (2015) reanalyzed old measurements obtained for 1P/Halley by the Neutral Mass Spectrometer on board Giotto and found a value of 3.7 ± 1.7% for the same ratio. A high abundance of O2 therefore seems to be common in comets.
This result raised the question of the origin of molecular oxygen observed in cometary comae. Three scenarios have so far been considered. Mousis et al. (2016) suggested that the high abundance of molecular oxygen is primordial and that a post-formation processing of cometary materials (e.g., see Strazzulla & Johnson 1991) is not considered relevant. Along the same line of thought are the results obtained by Taquet et al. (2016), who developed models of interstellar gas-grain chemistry that favor a primordial origin for O2 in comets, but for dark clouds, which are denser than the clouds that are usually considered as Solar System progenitors. The third scenario, by Dulieu et al. (2017), is different and suggests that molecular oxygen observed in the cometary comae is a daughter molecule being produced by the dismutation of hydrogen peroxide (H2O2).
Laboratory experiments show that irradiation of molecular oxygen-rich ice produces a large amount of solid ozone (e.g., Cooper et al. 2008; Jones et al. 2014a). However, only an upper limit for ozone detection was found in the coma of comet 67P/Churyumov-Gerasimenko (≤ 2.5 × 10⁻⁵ with respect to O2; Taquet et al. 2016). This result can be explained either when we assume that the comet ice is largely unprocessed, preserving its pristine content of molecular oxygen, or when we consider that ozone can react, for example, by thermal processing with other surrounding molecules, and is then destroyed (Strazzulla et al. 2005; Loeffler & Hudson 2016).
N2 has also been detected in the coma of comet 67P/Churyumov-Gerasimenko, but its abundance with respect to water is much lower, with a N2 -to-H2O ratio of ~0.1% (Rubin et al. 2015). This value implies that nitrogen is depleted by a factor of about 25 with respect to the pre-solar level. Rubin et al. (2015) suggested that this is due to inefficient trapping of N2 in amorphous water ice and implies a formation temperature of 24−30 K (i.e., below 24 K, the efficiency of nitrogen trapping would increase, and above 30 K it is no longer trapped), as evidenced by laboratory experiments using mass spectrometry after thermal desorption of appropriate mixtures (Bar-Nun et al. 2007). The same authors (Rubin et al. 2015) did not exclude that the measured ratio may reflect in whole or in part the cometary post-formation evolution, however. In this scenario, comets could be formed in the trans-Neptunian region at temperatures lower than 24 K, and they would have trapped much more nitrogen (e.g., as is observed to be the case for Pluto and Triton; Owen et al. 1993; Schmitt et al. 2017) that decreased with time due to the radiogenic decay of nuclides (or to post-accretion energetic processing, e.g., see Strazzulla & Johnson 1991) and thermal cycles during their transit near the Sun.
Mixed with methane, molecular nitrogen is also present in aerosols in the upper atmosphere of the Saturn moon Titan (Samuelson et al. 1997; Niemann et al. 2005). N2 has been detected at the surface of Triton, Pluto, and several Kuiper belt objects (KBOs) such as Eris and Makemake (Cruikshank et al. 1993, 2015; Owen et al. 1993; Licandro et al. 2006; Grundy et al. 2016). N2 is further observed along with other nitrogen-bearing molecules such as ammonia and HCN in the gas phase in the plumes of Enceladus with an abundance of about 1% with respectto water (Waite et al. 2009). Plumes have also been detected on Europa through observations of water-molecule ejection, and it is assumed they might have a composition similar to that of Enceladus (Teolis et al. 2017). Laboratory results from different independent groups corroborate the hypothesis that if molecular nitrogen is a component of the ice surfaces of the Solar System satellites and comets, then the products of its radiolysis in an oxygen-rich environment, that is, nitrogen oxides, should be searched for in space (Jamieson et al. 2005; Sicilia et al. 2012; de Barros 2015; Vasconcelos et al. 2017; Hudson 2018).
The unambiguous detection, or nondetection, of solid Nx Oy species in space could give insights into the chemical processes occurring at the surfaces of Pluto, Triton, and 67P/Churyumov-Gerasimenko. If nitrogen oxides are observed on Pluto, it might be indirect proof of the presence of molecular oxygen. The lack of abundant oxygen and of nitrogen oxides currently favors the permanence of a high nitrogen abundance. The putative presence of Nx Oy molecules incomets might also help to understand the fate of nitrogen and contribute to the debate of its original abundance. To date, a comprehensive selection of VUV laboratory spectra of nitrogen oxides, deposited and formed upon energetic processing of their parent species, in support of their future observations in the Solar System in the VUV-UV-vis spectral range is still lacking.
In this work, we present the first systematic set of VUV data of 1 keV electron-irradiated oxygen- and nitrogen-bearing ices starting from pure O2 and N2 ices, followed by the irradiation of the binary O2:N2 = 1:1 mixture. We furthermore investigate the 1 keV electron exposure of pure and mixed nitrogen oxides to study their formation and destruction pathways and their specific chemical stability upon energetic processing to inform future observations. In the next section we present the experimental apparatus in detail. Results and discussion first focus on VUV spectra of pure ices and then shift to ice mixtures before and after 1 keV electron irradiation and thermal heating. Infrared spectra of selected ices are shown to retrieve complementary information. Astrophysical implications highlight the importance of a deep search for nitrogen oxide ices in space.
2 Experimental setup
Experiments were performed at two different sites using a custom-made Portable Astrochemistry Chamber (PAC), which has a base pressure of 10−9 mbar. VUV photoabsorption spectra were measured on the AU-UV beam line at the ASTRID2 synchrotron light source at Aarhus University in Denmark (Fig. 1a; see Eden et al. 2006; Palmer et al. 2015). The beam line can produce monochromatized light over the wavelength range 115 to 700 nm using two gratings. The high-energy grating used for the measurements presented here has a typical flux of 1010 photons/s/100 mA and a photon resolution of 0.08 nm. FT-IR spectra of ices produced using the same PAC were measured at the Molecular Astrophysics Laboratory of The Open University (OU), UK (Fig. 1b; see Dawes et al. 2016). The advantage of using the same chamber for both types of measurements is that experimental conditions and preparation of ices can be accurately reproduced. Moreover, combining VUV and FT-IR spectroscopy of homonuclear species that are generally infrared transparent allows for their detection in the VUV, while their electron irradiation products can be monitored in the VUV and MIR.
The PAC consists of a conflat (CF40) flange spherical cube (Kimball Physics) connected to a 300 l s−1 turbo molecular pump (Leybold), a closed cycle helium cryostat (Sumitomo) with a base temperature 20 K, and a 1 keV electron gun (Kimball Physics). For measurements at ASTRID2, the chamber is mounted on the exit port of the AU-UV beam line and is enclosed with magnesium fluoride (MgF2, Crystran) windows to allow transmission of the VUV synchrotron light through the substrate and chamber; the transmitted light intensity is measured using a photomultiplier tube (PMT, ET enterprises 9406B). VUV photoabsorption spectra are acquired in transmission mode and at 1 nm intervals in the spectral range 115− 340 nm. During VUV photoabsorption measurements, the space between the MgF2 exit windowand the PMT is evacuated to remove atmospheric gas signatures at low wavelengths (< 200 nm), while at longer wavelengths, the atmospheric O2 prevents the transmission of second-order light. Ices are prepared on a 25 mm diameter MgF2 window (Crystran); this substrate is mounted in a holder made of oxygen-free high-conductivity copper (OFHC, Goodfellow), which has been machined to give good thermal contact between the substrate and the cryostat. The temperatureof the substrate is measured with a DT-670 silicon diode (Lakeshore) and can be controlled in the range 20− 300 K by means of a Kapton tape heater (Omega) connected to the OFHC block and regulated with a temperature controller system (Oxford Instruments). For FT-IR measurements carried out at the OU, the MgF2 windows are replaced with zinc selenide (ZnSe, Crystran), which are ~90% transparent in the MIR. The FT-IR spectrometer used is a Nicolet Nexus 670, with the light transmitted through the system detected using a mercury cadmium telluride (MCT) detector. FT-IR spectra are acquired in transmission mode, with absorbance spectra collected at 1 cm−1 resolution with an average of 128 scans in the range 4000−600 cm−1. Purge boxes visible in Fig. 1b are connected to a dry compressed air system and are used to remove atmospheric gas-phase signatures along the MIR beam path outside the high-vacuum chamber.
During a standard experiment, the substrate is first cooled down to 20 K, flash-heated to 200 K, and then cooled back to 20 K to remove possible contaminants from the surface. When the substrate is at its selected temperature for the experiment, a background spectrum is acquired and used as a reference for sample spectra taken afterward. Pure or mixed (≥ 99.999% N2, ≥ 99.998% O2, 98.5% NO, 99% N2O, and 99% NO2; CANgas by Sigma-Aldrich) gases are prepared using a dedicated gas line, with ratios determined through partial pressures measured with a mass-independent baratron (MKS) prior to deposition. Gases are then admitted from the mixing gas line to the main chamber through an all-metal needle valve. During deposition, the pressure is controlled and regulated between 1 × 10⁻⁸ and 1 × 10⁻⁷ mbar by means of a mass-dependent ion gauge (Leybold IONIVAC ITR 90), which gives deposition rates of between 0.02 and 0.2 nm s−1. Deposition is carried out at normal incidence with respect to the substrate. A rotary stage mounted in between the main chamber and the cryostat head allows for the rotation of the substrate so that it can be positioned with its surface normal to either (1) the incident light, when a spectrum is acquired; (2) the inlet tube of the gas deposition line during deposition of gases; or (3) the electron beam during irradiation (see Fig. 1). It should be noted that nitrogen dioxide (NO2) is always deposited in both its monomeric and dimeric (N2O4) forms. Whenwe refer to NO2 ice, we therefore imply an NO2:N2O4 ice mixture.
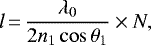
The thickness of the deposited ice samples is determined using a laser-interference technique described in detail elsewhere (e.g., Born & Wolf 1970; Goodman 1978; Baratta & Palumbo 1998). The technique is based on monitoring the intensity variations of a Ne-He laser beam reflected off the sample surface with an angle of incidence of 20° from the normal to the surface during ice-film growth. The intensity of reflected laser light is measured using a silicon photodiode (ThorLabs).As the ice layer is growing, a sinusoidal variation in intensity is detected due to the interference of laser light reflected from the icesurface-vacuum and the sample-substrate interface. The thickness of the ice layer is then calculated using Eq. (1),
 (1)
(1)
where λ0 is the wavelength of the Ne-He laser beam in vacuum (632.8 nm), θ1 is the angle of the laser within the ice, n1 is the refractive index of the ice film, and N is the number of constructive pattern repetitions during the deposition time. The refractive index n1 at 632.8 nm is estimated from the ratio of the maxima and minima of the laser-interference pattern (Born & Wolf 1970; Berland et al. 1994; Westley et al. 1998). The refractive indices of pure ices and their mixtures are estimated to be 1.33 for both pure molecular oxygen and nitrogen, and 1.34 for the O2:N2 = 1:1 mixture (see Table 1). The value of refractive index of the MgF2 substrate (1.38) is taken from Dodge (1984). The ices presented in this work are in the range 0.11−1.35 μm thick.
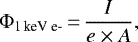
After deposition, measurements are carried out to provide an absorbance spectrum of the unirradiated sample. Samples are then irradiated using a 1 keV electron gun. The electron-beam current of the 1 keV gun was measured at the center of the chamber with a Faraday cup placed instead of the substrate holder, and the flux of electrons is derived to be 2 × 10¹³ e− cm−2 s−1 through the following equation:
 (2)
(2)
where Φ1 keV e- is the 1 keV electron flux [e− cm−2 s−1], I is the electron beam current (~11 μA) measured by the Faraday cup, e is the elementary charge (~1.60 × 10⁻¹⁹ C), and A is the surface area of the substrate exposed to the electron beam (~ 3.14 cm2).
The penetration depth of 1 keV electrons is estimated using the CASINO software (Monte Carlo simulation of electron trajectory in solids; Drouin et al. 2007)to be 0.045 μm in the case of pure O2, 0.07 μm for pure N2, and 0.06 μm for pure nitrogen monoxide (NO), nitrous oxide (N2O), and NO2 ices (see Fig. 2). The penetration depth for the O2:N2 = 1:1 mixture is 0.05 μm, assuming an intermediatedensity between those of O2 and N2. For all mixtures involving NO, N2O, and NO2 molecules, a penetration depth of 0.07 μm is assumed. We further verified experimentally an upper limit for the penetration depth of 1 keV electrons in O2 ice by performing a control experiment in which we first deposited 0.7 μm N2 ice at 22 K and then 0.14 μm O2 ice on top of it at the same temperature. Further electron exposure of this layered ice produced O3 only, which is an O2 irradiation product. Except for N2, no traces of other N-bearing species were observed. This confirms that the values of the penetration depth of 1 keV electrons in O2 ice as calculated by CASINO are reliable. Thus, since all the ice thicknesses of pure and mixed O2 and N2 presented in this study are between 0.1 and 1.3 μm all impinging electrons are implanted in the ice upon irradiation. For an overview of the experimental parameters, see Table 1.
When electron irradiation is completed and a spectrum is measured, the sample temperature is then increased to 30, 35, 50, 80, and 100 K, recording a new absorbance spectrum at each temperature. Experiments measuring the VUV absorption cross section of pure NO, N2O, and NO2 ices deposited at 22 K are also performed to aid the spectral identification of nitrogen oxides in the VUV range upon 1 keV electron exposure of N- and O-rich ices.
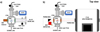 |
Fig. 1 Schematic top view of the Portable Astrochemistry Chamber (PAC) used to measure VUV and MIR spectra of astrochemical ices at (a) ASTRID2 synchrotron light source at Aarhus University in Denmark, and (b) the Molecular Astrophysics Laboratory at The Open University, UK, respectively. |
Main experimental parameters, i.e., density of material, refractive index n1 at 632.8 nm, ice thickness d, maximum fluence, and dose.
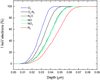 |
Fig. 2 Results from CASINO simulations of 1 keV electrons trajectories in N- and O-rich ices. For each simulation 1000 trajectories were calculated. All electrons impinging normal to the O2 ice surface are stopped at 0.045 μm (blue line), while only about 50, 70, and 90% of electrons are stopped in solid N2 (red line), nitrogen oxides (light and dark green and light blue lines) and the O2:N2 = 1:1 ice mixture (black line) at this depth. |
3 Results and discussion
Very much in line with other laboratory work on radiation-driven oxidation of nitrogen-bearing ices (e.g., Hudson 2018), our laboratory results confirm that upon irradiation of oxygen- and nitrogen-bearing ices, new species are formed, such as O3, azide (N3), NO, N2O, and NO2. We discuss the results for irradiation of each ice in turn. Table 1 lists all new species observed in the VUV range upon 1 keV electron irradiation of N- and O-rich ices.
3.1 Pure O2 ice
The left panel of Fig. 3 shows the VUV photoabsorption spectrum of 0.25 μm thick pure O2 deposited at 22 K (black curve). Mason et al. (2006) showed a similar absorption spectrum of solid O2 and identified the 140 nm feature to be the Schumann-Runge band (S-R,  transition from the ground state) assigned from gas-phase data. In their work the second and less intense solid O2 band at 180 nm was suggested to be due to the oxygen dimer (O2)2. In the O2 spectrum of Fig. 3 these bands appear to be slightly redshifted, most likely because the spectrum is saturated by the excessive thickness of the ice in combination with a high absorption cross section of O2 ice in the VUV. Thick ices were deposited to ensure that the penetration depth of the impinging electrons would not exceed the thickness of the ice.
In the left panel of Fig. 3 we show along with the spectrum of pure O2 two spectra of the same ice obtained after 1 keV electron irradiation at two different fluences (3.6 and 7.2 × 10¹⁶ e− cm−2). When a density of 1.54 g cm−3 (Fulvio et al. 2009) is considered for the O2 ice, the average stopping power of an impinging electron, that is, the energy released by 1 keV electrons into O2 ice, is 2.22 × 10⁴ eV μm−1, or in other units, 3.9 × 10⁻¹⁵ eV cm2/16u, where u is the unified atomic mass unit defined as 1/12 of the mass of an isolated atom of 12 C. Because the sample was irradiated for a maximum of 7.2 × 10¹⁶ e− cm−2, the total energetic dose is 277.6 eV/16u.
As shown in Fig. 3, the 1 keV electron irradiation of the pure O2 layer causes several modifications in the ice, highlighted by changes in the VUV spectral profile at 22 K. First, the O2 absorption bands decrease in intensity because the desorption of the ice induced by the impinging electrons is efficient. Another mechanism that leads to O2 consumption is the formation of solid ozone (Bennett & Kaiser 2005). Second, the O2 band peaks shift to higher energies. The peak shifts are a sign that the spectra of the irradiated ice are no longer saturated because the ice is now thinner than immediately after deposition. The O2 band profiles and peak positions of the irradiated ice correspond to those published in Mason et al. (2006) and Sivaraman et al. (2014). Third, a new absorption band appears at 257 nm. This is the Hartley band of solid ozone (O3) formed upon the reaction  , where atomic oxygen is liberated in the ice upon the interaction of 1 keV electrons with O2 molecules (Bennett & Kaiser 2005; Sivaraman et al. 2014).
The right panel of Fig. 3 shows the spectrum of the final irradiation of the O2 ice at 22 K scaled to one-third of its original absorbance for clarity (solid blue line) and compared to the spectra of the same ice annealed to 35 K (solid red line), 50 K (solid magenta line), and then cooled again down to 22 K (dash-dotted black line). At 35 K, most of the O2 has left the ice through thermal desorption, leaving a layer of more or less pure O3 ice, with peaks at 140and 257 nm. Sivaraman et al. (2014) assigned these peaks to ozone ice. However, the 140 nm peak could also be assigned to O2 molecules trapped in an O3 ice matrix (see Fig. 3). There is also a clear underlying slope in the VUV photoabsorption spectra of irradiated and annealed ices most likely due to Rayleigh scattering off the rough surface of the ice as a result of irradiation, e.g., sputtering and/or desorption of top material. Following Dawes et al. (2018), the scattering tails in the absorbance spectra of the irradiated and annealed O2 ice were fit with a function of the form
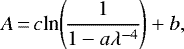 (3)
(3)
where the absorbance (A) Equation, which is first derived using the rearranged form of the Beer-Lambert Law, is then modified by introducing the term aλ−4 in the denominator corresponding to loss in the transmitted intensity due to scattering. Here a is proportional to r6, where r is the scattering particle size and c is proportional to the number density of the scatterers in the beam path. The dotted green line in the right panel of Fig. 3 is the fit of the VUV photoabsorption spectrum at 35 K using Eq. (3). The good agreement of the fit with the spectrum at 35 K in the spectral regions around 180 and 320 nm suggests that at least part of the observed slope is due to Rayleigh scattering. On the other hand, the large discrepancies between the fit and the VUV spectrum, especially around 257 nm, indicate that there are real absorption bands due to O3 (e.g., at 257 nm) and possibly also to O2 at 140 nm.
Furthermore, it appears that the ozone band profile changed at 35 K when it is compared to its profile after electron irradiation at 22 K. A possible reason for band profile changes is that the VUV spectrum of pure ozone presents a slightly different absorption cross section than when O3 is diluted in an O2 ice matrix. Bennett & Kaiser (2005) showed that the ozone-oxygen complex [O3...O] is formed upon exposure of O2 ice to 5 keV electron irradiation at low temperatures (11−30 K). They verified experimentally that in the warm-up phase, the oxygen atoms from the [O3...O] complex react with a neighboring oxygen molecule to form an O3 dimer. Similarly, during warm-up, oxygen atoms trapped in the molecular oxygen matrix react with oxygen molecules to form the ozone monomer. Thus, further formation of ozone can also contribute to the observed changes in the profile of the 257 nm band at 35 K. At 50 K, the 257 nm ozone band changes again, which is a sign of crystallization, as pointed out by Sivaraman et al. (2014). It is worth noting that there are no major differences between the spectra at 50 K and the one acquired after cooling of the ice again at 22 K, which indicates the irreversibility of the phase transition.
Figure 4 shows the infrared spectra of O2 at 22 K beforeand after exposure to 1 keV electrons for the same total dose as we used in the experiments carried out at ASTRID2 and discussed above. After irradiation, the previously featureless MIR spectrum of pure molecular oxygen now shows an absorption band due to ozone formed in the ice at 22 K (Bennett & Kaiser 2005). The peak position and profile change when the irradiated ice is annealed to 30, 35, and 50 K and then cooled again to 22 K. As discussed before, spectral changes arise because heating allows molecular oxygen to desorb, leaving a layer of pure ozone. The blueshift of the ozonepeak position seen in the MIR spectrum at 30 K is likely due to the formation of a pure layer of O3 ice. However, at 50 K, the spectrum of ozone is now redshifted. Changes in the peak position and band profile at 50 K can be due to a restructuring of the ice layer. Sivaraman et al. (2007) showed that a phase transition from α (amorphous) to β (crystalline) ozone occurs when O3 ice is heated to 47 K. At 50 K, O3 is therefore crystalline, while its desorption occurs at about 60 K (Jones et al. 2014a).
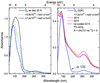 |
Fig. 3 Left panel: VUV absorbance spectrum (120−340 nm) of frozen oxygen as deposited at 22 K (solid black curve) and after 1 keV electron irradiation at two different fluences (dashed green and solid blue lines). Right panel: VUV absorbance spectrum (120− 340 nm) of electron-irradiated frozen oxygen (22 K; solid blue line) is shown along with the spectra obtained after heating to 35 K (solid red line), 50 K (solid magenta line), and then cooling down to 22 K (dot-dashed black line). The dotted green line isa fit of the 35 K spectrum by means of Eq. (3) to highlight the Rayleigh-scattering tail in the spectrum. |
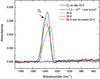 |
Fig. 4 FT-IR spectrum in absorbance of an O2 ice as deposited at 22 K (solid black line), after 1 keV electron bombardment (solid blue line), and annealed to 30 K (solid green line), 35 K (solid red line), and 50 K, then cooled to 22 K (dot-dashed black line) in the spectral region around the antisymmetric stretching mode of solid O3. |
3.2 Pure N2 ice
The absorbance spectrum (115−150 nm) of a ~1 μm thick N2 frozen layer deposited at22 K is shown in Fig. 5 along with the spectrum obtained after 1 keV electron irradiation with a fluence of 1.8 × 10¹⁶ e− cm−2. To highlight the sharp features of N2 in the VUV, the step size used here is 0.05 nm for the large panel of Fig. 5, while the inset is at a step of 0.2 nm. The spectrum of solid molecular nitrogen shows a series of intense absorption features in the range 115−150 nm associated with the Lyman-Birge-Hopfield (LBH,  ) and Tanaka absorption (TA,
  ) systems (Mason et al. 2006; Wu et al. 2012). It should be noted that to obtain the spectra shown in Fig. 5 we deposited a much thicker ice layer than for the case of molecular oxygen because photoabsorption cross section for solid N2 is much smaller. Moreover, with the exception of one single line at about 117 nm, which increases in intensity after exposure to 1 keV electrons, there are no major changes in the spectrum of solid N2 in the range 115−150 nm upon irradiation. Unlike for the case of pure O2, 1 keV electron exposure of a pure N2 ice thereforeleads to a negligible desorption of the ice. However, the origin of the band increase at 117 nm is unclear at this stage.
Formation of the N3 (azide) radical is confirmed by the appearance of the peak at ~272.4 nm (transition  ) (e.g., Douglas & Jones 1965; Wu et al. 2013b), as highlighted in the inset of Fig. 5, where a spectrum of deposited N2 ice and another spectrum after irradiation of 4.3 × 10¹⁷ e− cm−2 are shown. Because the average stopping power of a 1 keV electron impinging N2 ice with a density of 0.94 g cm−3 (Satorre et al. 2008) is estimated to be 4.05 × 10⁻¹⁵ eV cm2/16u (1.42 × 10⁴ eV μm−1), a total fluence of 4.3 × 10¹⁷ e−/cm2 translates into a dose of 1746.1 eV/16u. The laboratory formation of the N3 radical initiated by the direct dissociation of molecular nitrogen upon electron exposure of the ice and the consequent recombination of an electronically excited (and/or suprathermal) nitrogen atom with molecular nitrogen [
 )] has been extensively investigated by different groups by means of energetic processing of N2 -rich ices (e.g., Hudson & Moore 2002; Moore & Hudson 2003; Baratta et al. 2003; Jamieson & Kaiser 2007; Wu et al. 2012, 2013a,b; Cruz-Diaz et al. 2014b; Lo et al. 2015, 2019; Mencos et al. 2017; Hudson & Gerakines 2019). Unlike Wu et al. (2013a,b), in our experiments, neither N
 nor N
nor N are detected after irradiation. Moreover, the intensity increase of the 117 nm band is apparently not linked to the formation of N3 or N
 because it is clearly visible at low doses, whereas N3 is only detectable at higher doses. Finally, our corresponding infrared data did not show any clear sign of formation products from irradiation of N2. Clearly, the newly formed N3 was below the detection limit of our FT-IR system.
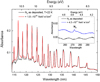 |
Fig. 5 VUV absorbance spectrum (115−150 nm) of frozen nitrogen as deposited at 22 K (solid black line) and after 1 keV electron irradiation at given fluences (solid red and blue lines). Formation of N3 is highlighted in the inset of the figure (solid blue line). |
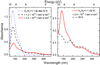 |
Fig. 6 Left panel: VUV absorbance spectrum (120−340 nm) of a frozen mixture O2:N2 = 1:1 as deposited at 22 K (dotted blue line) and after 1 keV electron irradiation at two different fluences (dashed black and solid red lines). Right panel: irradiated mixture is shown again (solid red line) on a different scale, along with the spectra obtained after annealing the ice to 50 K (dashed black line). |
3.3 O2:N2 = 1:1 mixed ice
The VUV absorbance spectrum of a 0.24 μm thick frozen O2:N2 = 1:1 mixture deposited at 22 K is shown in the left panel of Fig. 6 (dotted blue line) along with those obtained after 1 keV electron irradiation at two different fluences (1.2 and 2.4 × 10¹⁶ e− cm−2, dashed black and solid red lines, respectively). The average stopping power of a 1 keV electron impinging a mixture of O2:N2 = 1:1 with an estimated density of 1.24 g cm−3 is 4.34 × 10⁻¹⁵ eV cm2/16u, while a total fluence of 2.4 ×10¹⁶ e− cm−2 corresponds to a dose of 104.3 eV/16u. As mentioned before, because of the different VUV photoabsorption cross sections for O2 and N2, the VUV spectrum of the deposited mixture exhibits a typical profile characteristic of pure O2 ice (see Fig. 3), that is, nitrogen molecules are almost not detectable in the mixture. Upon electron bombardment, the spectrum profile changes in a similar way as seen for pure O2 ice, that is, the molecular oxygen bands decrease, while ozone ice is detected at 257 nm. Major differences between the 1 keV electron irradiated pure O2 and the O2:N2 = 1:1 mixture appear when the ice is warmed up to 50 K. At 50 K, O2 and N2 are expected to be fully desorbed, leaving the most refractory reaction products in the ice. The right panel of Fig. 3 shows a spectrum that exhibits the features of ozone at 50 K (solid magenta line, see 120, 140, and 257 nm bands), while the corresponding panel in Fig. 6 shows a spectrum of all the formation products of the reaction O2:N2 + e−→products at 50 K (dashed black line, see 120, 140, 185, and 257 nm bands).
Laboratory work shows that Nx Oy species form in the ice upon UV photon, electron, and ion irradiation of N- and O-rich ices (e.g., Jamieson et al. 2005; Sicilia et al. 2012; Boduch et al. 2012; Vasconcelos et al. 2017; Hudson 2018; Carrascosa et al. 2019). Further energetic and “nonenergetic”, that is, thermal surface atom addition reactions, processing of simple nitrogen oxides (e.g., NO, N2O, and NO2) leads to the formation of other nitrogen oxides, as discussed elsewhere (e.g., Minissale et al. 2014; Ioppolo et al. 2014; Almeida et al. 2017). To aid in the identification of nitrogen oxides in the laboratory VUV spectrum of the irradiated and annealed O2:N2 mixture, we have acquired VUV photoabsorption spectra of pure NO, N2O, and NO2 deposited at 22 K. Figure 7 compares the profile of the spectrum of the O2:N2 mixture irradiated at 22 K and further warmed up to 50 K with spectra of ozone formed after irradiation of pure O2 and annealed to 50 K (magenta squares), pure N2O at 22 K (blue diamonds), and pure NO2 at 22 K (red circles). The peak positions of bands from O3, N2O, and NO2 are all in good agreement with those observed in the processed O2:N2 mixture. NO is not included in Fig. 7 because even if it were formed at 22 K upon 1 keV electron irradiation of the O2:N2 mixture, it would have desorbed at 50 K, that is, during annealing of the ice (Minissale et al. 2014). The comparison of VUV spectral components with the VUV spectrum of an O2:N2 mixture irradiated at 22 K and annealed to 50 K confirms that O3, N2O, and NO2 are among the main electron irradiation products in the ice. Moreover, although O3, N2O, and NO2 bands present broad profiles in the VUV spectral range, their peaks do not overlap. Therefore the identification of similar slopes in astronomical observations of Solar System icy objects can potentially trace both nitrogen oxides and ozone in such ices.
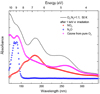 |
Fig. 7 VUV absorbance spectrum (120−340 nm) of a frozen mixture O2:N2 = 1:1 obtained after electron bombardment and annealing to 50 K (solid black line) is compared to VUV spectra of O3 at 50 K formed after electron irradiation of pure O2 at 22 K (magenta squares), pure deposited NO2 (red circles), and N2O ices at 22 K(blue diamonds). |
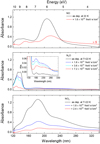 |
Fig. 8 VUV absorbance spectra (120−340 nm) of pure NO (top panel), N2O (middle panel), and NO2 (bottom panel) ices as deposited at 22 K (solid black lines) and after exposure to 1 keV electrons. |
VUV photoabsorption features detected after deposition of pure nitrogen oxide ices at 22 K and compared to band peak positions of a VUV spectrum of 1 keV irradiated O2:N2 = 1:1 mixture heated to 50 K.
3.4 Pure NO, N2O, and NO2 ices
To the best of our knowledge, Lu et al. (2008) published the only available VUV absorption spectra of NO and N2O ice deposited at 10 K in the spectral range 110−250 nm. There are no data in the literature of VUV spectra of NO2 in the condensed phase. We present the first systematic VUV photoabsorption spectra of pure and mixed nitrogen oxides before and after 1 keV electron exposure in the spectral range 120−340 nm. Figure 8 shows VUV photoabsorption spectra of pure deposited NO (top panel), N2O (mid-panel), and NO2 (bottom panel) ices at 22 K. Lu et al. (2008) identified two VUV absorption broad features at 149 and 208 nm for solid NO, with another potential band below 100 nm. They also presented four broad features at 112, 128, 139, and 178 nm for N2O ice. Table 2 lists all the absorption features identified in our VUV photoabsorption spectra of pure deposited nitrogen oxides. Our VUV spectrum of pure NO deposited at 22 K does not suggest any indication for a broad feature below 100 nm, while it highlights several broad bands at 136 (not observed by Lu et al. 2008), 147, and 206 nm, with the latter being also the strongest in intensity by a factor of ~3 with respect to the others. The VUV absorption cross sections of NO molecules in the gas phase consist of band structure superposed on ionization and dissociation continua in the range 50− 235 nm, with the first ionization limit at 135 nm corresponding to the band observed in our VUV spectra of solid NO (Hudson 1971). The slope observed by Lu et al. (2008) at low wavelengths could be due to Rayleigh scattering off islands of material, that is, a rough ice surface. The VUV absorption spectrum of solid N2O deposited at 22 K presents two strong broad absorption peaks at 133 and 139 nm and two bands at 183 and 225 nm that are ~2 orders of magnitude weaker than those at lower wavelength (see Fig. 8). Lu et al. (2008) did not identify the 225 nm band due to its weakness in intensity and the fact that it extends beyond their measured spectral range, that is, between 200 and 300 nm. Finally, the VUV absorption spectrum of solid NO2 deposited at 22 K shows a band shoulder at 132 nm and several other broad intense absorption bands at 163, 183, and 230 nm, with the 183 nm feature being the most intense.
The top panel of Fig. 8 shows a VUV photoabsorption spectrum of pure NO (red line) exposed to 1 keV electron irradiation at 22 K. After a 1 keV electron dose of 80.2 eV/16u, the strongest NO absorption peak at 206 nm decreases in intensity by a factor of nearly 13 and shifts to 216 nm. The VUV photoabsorption feature at 136 nm disappeared and the 147 nm band shifted to 152 nm. However, it is also possible that the VUV band at 147 nm disappeared as well and that the new 152 nm feature is due to molecular oxygen formed in the ice. Pure molecular oxygen has its strongest band peak position at 154 nm (see Fig. 3). However, it should be noted that the 154 nm band of pure O2 is wider than the new 152 nm band observed after irradiation of NO ice. Hence the identification of molecular oxygen is only tentative. Moreover, the large wavelength step size (1 nm) used during the acquisition of all the VUV spectra of nitrogen oxides recorded in this study does not allow for the unambiguous identification of newly formed N2 in the ice. Hence it is not clear whether in the range 115−150 nm there are any weak features superimposed on the continuum that could be associated with the Lyman-Birge-Hopfield and Tanaka absorption systems of solid N2. A VUV spectrum of pure N2 ice acquired with the same step size used for nitrogen oxides reveals that only the broader features in the range 130−145 nm are detectable in this configuration. We should also point out that N2 has a very low VUV absorption cross section compared to O2 and other Nx Oy species, complicating its identification in the ice. Finally, the VUV spectrum of processed NO presents a new feature at 179 nm that can be attributed to the strongest band of pure NO2 molecules (see Table 2). Although the detection of new species should be considered only tentative, their presence in the ice is expected when their chemical formation pathway is considered. Nitric oxide is indeed dissociated by 1 keV electrons into atomic nitrogen and oxygen that can then recombine reforming NO or react with the surrounding NO molecules or with other atoms to form new species. It is likely that atoms formed upon electron exposure of the ice are electronically excited and/or suprathermal. Therefore directional diffusion should occur and a direct recombination to reform NO is less likely than the formation of other species. This can also explain the fast decrease of NO as a function of electron dose. O2 and N2 form through the recombination of O and N atoms, respectively. Nitrogen dioxide is formed through the reaction NO + O →NO2. Similarly, nitrous oxide should form through the reaction NO + N →N2O. However, as discussed below, N2O is destroyedupon electron exposure at very low doses compared to other Nx Oy molecules. Therefore it is likely that, if formed, N2O is already entirely consumed in the NO experiment at a total dose of 80.2 eV/16u, explaining its nondetection in the VUV spectrum of irradiated NO ice.
The middle panel of Fig. 8 presents three VUV spectra of electron irradiation of solid N2O at 22 K with a total dose of 27.6 eV/16u. At such low doses compared to other experiments shown in this work, N2O is already nearly entirely destroyed, that is, the VUV band at 133 nm decreases by a factor of 5. Upon electron exposure, the two main band peaks of N2O gradually shift to 129 and 137 nm, respectively. Unfortunately, for the aforementioned reasons it is not clear whether any weak feature superimposed on the continuum are due to solid N2. However, N2 is expected to be formed in the ice because it forms when 1 keV electrons remove an oxygen from N2O. It is interesting to note that two bands at 181 and 230 nm associated with NO2 ice appear at lower doses and then decrease at higher electron exposures. To form solid NO2, 1 keV electrons need to break the N2O molecules from both the N and O sides, that is, N2O + e−→N + NO and N2O + e−→O + N2, respectively. The further oxidation of NO leads to the formation of NO2. The detection of NO2 also suggests the presence of N2, O2, and NO in the ice.
In the bottom panel of Fig. 8, VUV photoabsorption spectra of frozen NO2 exposed to 1 keV electrons are displayed. Solid NO2 is perhaps the most stable species among the nitrogen oxides studied here when exposed to electron irradiation. Under the same electron doses discussed for solid NO (80.2 eV/16u), the main VUV absorption band of NO2 decreases only by a factor of 3. Upon irradiation, the absorption feature at 132 nm disappears, while the 163, 183, and 230 nm bands shift to 153, 187, and 226 nm, respectively. As for the case of NO, the band at 153 nm could potentially be, at least in part, due to O2 molecules because its shape changes more than other bands in the same spectrum. Although NO is expected to be the most likely first species formed after electron irradiation of frozen NO2 (NO2 + e−→O + NO), its detection is not possible in the VUV spectra of processed ice. One possible reason is the broad nature and intensity of the VUV NO2 features, which cover almost the full 120−300 nm spectral range.
3.5 Binary ice mixtures containing NO, N2O, and NO2
The VUV photoabsorption spectrum of the NO:NO2 = 1:1 mixture deposited at 22 K shows a unique profile with absorption bands at 123, 184, and 217 nm (see the top panel of Fig. 9 and Table 3). The mathematical addition of pure NO and NO2 VUV spectra leads to a completely different spectral profile with peaks at 133 (weak), 160 (medium), and 199 nm (very strong), not shown in Fig. 9. The relative intensity and peak position differences between the mathematically added spectrum of the pure components and the experimentally measured ice mixture indicate that there is a strong molecular interaction between the two ice components in the mixture. This is further confirmed by the fact that 1 keV electron irradiation of the ice mixture causes the destruction of the ice, that is, decrease of absorption band intensities, without the appearance of any other clear absorption band due to newly formed species. However, we should point out that the nondetection of newly formed species can be due to the broad nature of the absorption bands of the investigated mixture that can cover signals from other absorption species.
The middle panel of Fig. 9 shows VUV photoabsorption spectra of a mixture NO:N2O = 2:1 at 22 K before and after 1 keV electron irradiation. The choice of depositing a 2:1 mixture is due to the higher absorption cross section of solid N2O compared to NO ice when the two components are mixed. Table 3 lists all the absorption bands visible upon deposition. There is little shift of all bands compared to the respective ones of pure ice components. However, the N2O band at 126 nm is now much stronger than the other band at 135 nm. This is the case when solid N2O is also mixed with other nitrogen oxides. In pure N2O ice the corresponding bands at 133 and 139 nm are of equal strength, see Fig. 8 and Table 2. Interestingly, the wide 154 nm band disappears at a fluence higher than 1 × 10¹⁶ e− cm−2 and a new narrower feature appears at the same wavelength, resembling the band observed upon electron irradiation of pure NO. As for pure NO, we tentatively assigned this band to pure oxygen. The inset of the middle panel of Fig. 9 shows the specific spectral region where several bands of pure N2 at 136, 139, and 142 nm, and pure NO2 at 181 nm are visible. Solid NO2 was detected in the irradiation experiments of pure NO and N2O ices. Therefore its detection is expected. However, this is the only case where absorption features of N2 ice are visible in the VUV spectra of irradiated nitrogen oxide ices. We would like to mention that identification of newly formed N2 ice in the MIR is in general not possible. Hence VUV photoabsorption data of irradiated nitrogen oxide ices can provide further complementary information on the surface reaction network at play.
The VUV photoabsorption spectrum of the NO2:N2O = 1:1 mixture deposited at 22 K presents absorptions that are similar in peak position and band shape to those due to N2O mixed with NO and those of pure NO2 ice. Upon irradiation, the 163 nm band decreases more rapidly than the rest and the 222 nm band increases first before decreasing as the ice likely becomes thinner as a function of the dose. No new molecules are clearly seen during this experiment. However, it is worth noting that each single ice component is more resistent to electron irradiation when deposited in an ice mixture. Particularly, N2O is still largely present in the ice at all investigated doses, which exceed those used for the irradiation of pure N2O ice.
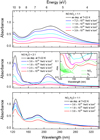 |
Fig. 9 VUV absorbance spectra (120−340 nm) of NO:NO2 = 1:1 (top panel), NO:N2O = 2:1 (mid-panel),and NO2:N2O = 1:1 (bottom panel) ice mixtures as deposited at 22 K (solid black lines) and after exposure to 1 keV electrons. |
VUV photoabsorption features detected after deposition of nitrogen oxide ice mixtures at 22 K.
4 Astrophysical implications
4.1 Energetic processing of ices in space
Most of the icy moons belonging to the giant planets of the Solar System are embedded in the magnetospheres of their respective planets and consequently are exposed to a very intense bombardment by energetic ions (e.g., 20 keV–100 MeV in the Jupiter magnetosphere) and electrons (e.g., 20−700 keV in the Jupiter magnetosphere). For instance, the Jupiter moons are embedded in the magnetosphere of the gas giant, and their surfaces are continuously bombarded by energetic ions (mainly H+, Sn+, and On+) accelerated by the magnetic field of Jupiter. As a consequence, the mean energy flux (keV cm−2s−1) for Europa, Ganymede, and Callisto are estimated to be 8 × 10¹⁰, 5 × 10⁹, and 2 × 10⁸, respectively (Cooper et al. 2001). As pointed out by Cooper et al. (2001), the assumed ages (i.e., the time necessary for a complete resurfacing) of the Jovian satellite surfaces are between 107 −109 yr, therefore all the irradiation fluences selected in our work are well within the mean energy fluences that surfaces of Jupiter satellites are exposed to during their lifetimes.
In addition, the surfaces of objects beyond Neptune, which includes the several families of trans-Neptunian objects (TNOs) andKBOs such as Pluto, and comets in the Oort cloud are exposed to galactic cosmic rays and solar wind ion bombardment for billions of years, and therefore there is sufficient accumulation of induced physical and chemical effects (i.e., doses between a few and some hundred eV/16u; Strazzulla et al. 2003). These estimates also agree well with our selected laboratory irradiation doses. Finally, in star-forming regions, interstellar ice grains are exposed to X-rays, UV photons, electrons, and cosmic ions, which induce a complex chemistry within ice layers and the ice-grain interface. The lifetimes of pre- and protostellar phases have been estimated to be about 105 −107 yr (Caselli & Ceccarelli 2012), thus interstellar grains may accumulate doses of about at least a few eV/16u before ice desorption (Kaňuchová et al. 2016). In comparison to our experiments, all the maximum doses used in our experimental work are greater than the estimated values shown in Kaňuchová et al. (2016). However, our experiments show that with the exception of N3, reaction products are clearly formed even at lower doses and can be detected in the VUV and MIR spectral range. Therefore, the N- and O-rich ice chemistry discussed here is also relevant to the ISM. Furthermore, it is relevant to say that we assumed here that the effects induced by energetic processing of ices depend on the deposited dose and not on the specific agent (ions versus electrons). This is justified by the fact that most of the effects produced by ions are due to the secondary electrons produced along the ion track in the irradiated ice (e.g., Baratta et al. 2002).
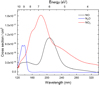 |
Fig. 10 VUVphotoabsorption cross sections for pure NO, NO2, and N2O ices deposited at 22 K. |
4.2 Photodesorption of nitrogen oxide-containing ices
The photodesorption rates of small molecules such as O2, N2, and CO ice measured at different photon energies (Fayolle et al. 2011) are clearly correlated to the VUV photoabsorption spectrum of the same material (Lu et al. 2008; Muñoz Caro et al. 2016) for the same photon energies. This indicates that photodesorption of some simple ice species is mainly driven by a desorption induced by electronic transition (DIET) process (Fayolle et al. 2011, 2013). Recently, the photodesorption of solid NO from pure NO ices was found to be as efficient as the photodesorption of CO from pure CO ices, that is, with a yield being around 102 molecules per incident photon for UV fields relevant to the diffuse and dense ISM (Dupuy et al. 2017). VUV photoabsorption data from Lu et al. (2008) and this work show that the photodesorption of NO follows its VUV photoabsorption spectrum acquired at low temperatures. To the best of our knowledge, photodesorption studies of other pure and mixed nitrogen oxides are not available in the literature. VUV absorption cross-section data obtained in the laboratory allow for a more quantitative study of photon absorption in ice mantles. Figure 10 shows the cross-section data obtained from our experimental work on deposited nitrogen oxide ices. Based on our VUV spectroscopic data presented here, the VUV light that reaches an interstellar ice mantle must have an energy higher than 5.5, 6.0, and 8.5 eV to be efficiently absorbed by solid NO, NO2, and N2O, respectively. Furthermore, we also showed that mixtures containing NO:NO2 present unique features that start to peak around 5 eV and that cannot be reproduced by mathematically adding VUV spectra of pure ice components. This highlights the importance of performing dedicated systematic VUV photoabsorption spectroscopic studies of ices relevant to the Solar System and the ISM in support of future frequency-dependent photodesorption studies of the same ice material.
4.3 Future observations of nitrogen oxide ices
In star-forming regions, the exposure of ice grains to energetic processing such as galactic cosmic rays, electrons, UV photons produced by field stars and forming protostars, cosmic-ray-induced UV photons within dark clouds, and thermal heating can all contribute to the formation of larger complex solid species. Here we showed that 1 keV electron irradiation of an O2:N2 ice leads to the formation of ozone and nitrogen oxides. Further 1 keV electron irradiation of Nx Oy species, pure and in mixtures, causes the formation of simpler and more complex N- and O-bearing species. The energetic and nonenergetic surface chemistry involving nitrogen oxides can lead to the formation of a variety of frozen species, including potential precursors to amino acids such as hydroxylamine (NH2OH; Hudson 2018; Congiu et al. 2012; Minissale et al. 2014; Ioppolo et al. 2014). Recently, the Rosetta mission highlighted the link between prestellar O2 -containing ices and O2-rich cometary ices (Bieler et al. 2015). Hence, understanding the chemical evolution of molecular oxygen and nitrogen in space can potentially shed light on the formation of complex organic species and possibly life-related species throughout the star formation process. Our work adds to the laboratory investigation of O- and N-bearing species exposed to energetic processing by providing highly needed VUV photoabsorption spectra of pure and mixed ices that can be used to understand nonthermal photodesorption of N- and O-bearing molecules from ice grains in cold regions of the ISM as well as protostar photoattenuation effects due to ice material in the midplane of accretion disks in a forming solar-like system. Our results also support the need for a deep search for nitrogen oxides in interstellar ices by means of the MIRI instrument on board the JWST towards different environments in the ISM.
Our work is relevant to the Solar System as well. The reflectance spectrum of the Saturn moons, such as Enceladus, was recently measured in the VUV (115−190 nm) by the Cassini UltraViolet Imaging Spectrograph (UVIS). In the visible and near-infrared, the Enceladus reflectance spectrum is bright, with a surface composed primarily of H2O ice. However, the corresponding VUV spectrum of the surface of the moon is darker than would be expected for pure water ice. Hendrix et al. (2010) explained this surprising finding by the presence of small amounts of NH3 and tholin in addition to H2O ice on the surface. We note that the observational spectrum is fully saturated below 160 nm. Similar VUV spectral profiles were observed on other icy moons of Saturn, for example, Rhea and Dione (e.g., Royer & Hendrix 2014). In Fig. 11 the VUV reflectance spectra of the ice surfaces of Enceladus, Rhea, and Dione observed by the Cassini spacecraft (square black and gray symbols) are compared to a two-component fit of VUV transmittance spectra of solid amorphous water and NO2 ice. In our fit, frozen nitrogen dioxide is needed to reproduce the slope at 180 nm observed on the surface of the Saturn moons. Our VUV set of data shows that a strong absorption band at 180 nm is visible in the spectra only when NO2 molecules are present in the ice. This is also the case for the irradiated O2:N2 ice mixture. Hendrix et al. (2010) fit the same slope at 180 nm using NH3 ice in combination with tholin and water because the VUV spectrum of ammonia ice presents a band at 180 nm of medium relative intensity, and observations of Enceladus plumes showed NH3 in the lunar ice (0.8% with respectto water ice, Waite et al. 2006, 2009; Pavithraa et al. 2018). However, the same observations suggested molecular nitrogen in the ice (1% with respectto water ice, Waite et al. 2009). Therefore, as shown in this work, it is likely that nitrogen oxides are formed through processing of N- and O-bearing ice species on the surface of the Saturn ice moons.
Figure 11 suggests that 1.4% of the total fit of Enceladus is due to NO2, while double that contribution is needed to fit the slopes of Rhea and Dione. For completeness, we fit the 160−200 nm slope of Enceladus with other nitrogen- and oxygen-rich ice-fit components. For instance, the addition of a contribution of > 30% of N2O ice, not shown in the figure, reduces the NO2 and water components while still fitting the slope profile well. However, an N2O contribution larger than 30% to the fit is not supported by observational evidence. We also used the VUV spectrum of the O2:N2 = 1:1 ice mixture irradiated and heated to 50 K as a fit component together with water, not shown in the figure, and found that the observed profile of Enceladus is well reproduced by a < 10% contribution of the irradiated ice mixture combined with water ice. We note that our VUV spectrum of O2:N2 = 1:1 irradiated and heated to 50 K presents a broad band due to O3 at 250 nm. No such absorption is visible in observational data of Enceladus (Zastrow et al. 2012) and is not expected either due to the desorption temperature of ozone (60 K) and the surface temperature of the moon (72 K). Unfortunately, we do not have a VUV spectrum of the same ice at 70 K. We therefore decided to use the 50 K annealed-ice component. Finally, we stress that the outcome of our fit shown in Fig. 11 does not correspond to the real abundance of the relative species. To carefully quantify the amount of nitrogen oxides in the observed data, we would need optical constants of all materials at the correct temperatures, we should also include other molecules in the fit such as ammonia, and use an appropriate model. Our fit presented in Fig. 11 is performed to show that the simple addition of a small amount of nitrogen dioxide in the fit can reproduce the slope observed on Enceladus, Rhea, and Dione. Hence a two-component fit, including nitrogen oxides, is qualitatively as good as or better than the three-component fit used by Hendrix et al. (2010). The possible presence of nitrogen oxides on the icy moons of Saturn based on a combined laboratory and observational evidence strongly suggests the need for a deep search of nitrogen oxides on the ice surface of the moon of the giant gaseous planets and the outer Solar System objects.
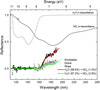 |
Fig. 11 VUV(115−190 nm) Cassini UVIS data of the surface of Enceladus (square black symbols), Dione (square dark gray symbols), and Rhea (square light gray symbols) compared to a two-fit components (solid red and green lines) of the VUV photoabsorption spectra of solid water and nitrogen dioxide deposited at 22 K (solid light and dark gray lines, respectively). The laboratory ice components are normalized and scaled in the figure for clarity. |
5 Conclusions
We presented new VUV absorption spectra of pure and mixed nitrogen- and oxygen-bearing ices exposed to 1 keV electron irradiation under conditions relevant to the ISM and the Solar System. Below we list the main findings of this work.
The 1 keV electron irradiation of solid pure molecular oxygen and nitrogen leads to the formation of frozen ozone and the azide radical, respectively. The analogous irradiation of a O2:N2 = 1:1 ice mixture shows the formation of ozone together with nitrogen oxides, such as N2O, NO2, and most likely NO.
A systematic VUV photoabsorption study of solid nitrogen oxides is presented for the first time. VUV photoabsorption spectra of pure deposited NO, N2O, and NO2 ices were discussed first. VUV spectra of binary mixtures of nitrogen oxides show unique peaks indicating a strong molecular interaction within the mixed material. This cannot be reproduced by simply adding pure ice components to a spectral fit.
Pure and mixed nitrogen oxide ices were further exposed to 1 keV electron irradiation to study the energetic chemistry induced by electrons in the ices and the durability of such materials as a function of the electron dose. In addition to the formation and destruction of nitrogen oxides, molecular oxygen and nitrogen are also observed in the VUV spectral range upon electron irradiation. The observation of homonuclear species in the VUV spectral range complements literature laboratory data in the MIR.
VUV photoabsorption spectra and cross sections of pure deposited NO, N2O, and NO2 ices can be used to understand nonthermal photodesorption of N- and O-bearing molecules from ice grains in cold regions of the ISM as well as protostar photoattenuation effects due to ice material in the midplane of accretion disks in a forming solar-like system.
We reproduce the reflectance spectral profiles of Enceladus, Rhea, and Dione in the 115−190 nm range with a binary H2O and NO2 component fit. Irradiated O2:N2 mixtures can also qualitatively reproduce the observed profile, indicating that nitrogen oxides are likely present on the surface of the icy Saturn moons. Previous studies never considered nitrogen oxides as possible candidates for the observed darkening of the reflectance spectra of the icy Saturn moon in the VUV range.
Hence our results support the need for a deep search for nitrogen oxides in interstellar ices in the MIR by means of JWST observations toward different environments in the ISM as well as in the Solar System in the VUV spectral range by the JUICE mission.
Acknowledgements
The authors thank Dr. Amanda R. Hendrix for providing observational Cassini’s UVIS data and an anonymous reviewer whose suggestions helped improve and clarify this manuscript. The research presented in this work has been supported by the Royal Society University Research Fellowship (UF130409), the Royal Society Research Fellow Enhancement Award (RGF/EA/180306), and the project CALIPSOplus under the Grant Agreement 730872 from the EU Framework Programme for Research and Innovation HORIZON 2020. Furthermore, S.I. recognizes the Royal Society for financial support. The research of Z.K. was supported by VEGA – the Slovak Grant Agency for Science (grant No. 2/0023/18) and COST Action TD 1308. R.L.J. acknowledges the STFC for her Ph.D. Studentship under grant no. ST/N50421X/1. A.D. acknowledges the Daphne Jackson Trust and Leverhulme Trust (grant no. ECF/2016-842) for her Fellowships. R.L.J. and A.D. also acknowledge the Open University for financial support. N.J.M. acknowledges support from the Europlanet 2020 RI from the European Union’s Horizon 2020 research and innovation programme under grant agreement No 654208. G.S. was supported by the Italian Space Agency (ASI 2013-056 JUICE Partecipazione Italiana alla fase A/B1) and by the European COST Action TD1308-Origins and evolution of life on Earth and in the Universe (ORIGINS).
References
- Almeida, G. C., Pilling, S., de Barros, A. L. F., et al. 2017, MNRAS, 471, 1330 [CrossRef] [Google Scholar]
- Banks, M. 2012, Phys. World, 25, 06 [Google Scholar]
- Baratta, G. A., & Palumbo, M. E. 1998, JOSAA, 15, 3076 [NASA ADS] [CrossRef] [Google Scholar]
- Baratta, G. A., Leto, G., & Palumbo, M. E. 2002, A&A, 384, 343 [NASA ADS] [CrossRef] [EDP Sciences] [Google Scholar]
- Baratta, G. A., Domingo, M., Ferini, G., et al. 2003, Nucl. Instrum. Methods Phys. Res. B, 209, 283 [NASA ADS] [CrossRef] [Google Scholar]
- Bar-Nun, A., Notesco, G., & Owen, T. 2007, Icarus, 190, 655 [NASA ADS] [CrossRef] [Google Scholar]
- Bennett, C. J., & Kaiser, R. I. 2005, ApJ, 635, 1362 [NASA ADS] [CrossRef] [Google Scholar]
- Berland, B. S., Haynes, D. R., Foster, K. L., et al. 1994, J. Phys. Chem., 98, 4358 [CrossRef] [Google Scholar]
- Bieler, A., Altwegg, K., Balsiger, H., et al. 2015, Nature, 526, 678 [Google Scholar]
- Boduch, P., Domaracka, A., Fulvio, D., et al. 2012, A&A, 544, A30 [NASA ADS] [CrossRef] [EDP Sciences] [Google Scholar]
- Boduch, P., Brunetto, R., Ding, J. J., et al. 2016, Icarus, 277, 424 [NASA ADS] [CrossRef] [Google Scholar]
- Born, M., & Wolf, E. 1970, Principles of optics, 4th ed. (London: Pergamon Press Ltd) [Google Scholar]
- Bouwman, J., Paardekooper, D. M., Cuppen, H. M., Linnartz, H., & Allamandola, L. J. 2009, ApJ, 700, 56 [NASA ADS] [CrossRef] [Google Scholar]
- Boogert, A. C. A., Gerakines, P. A., & Whittet, D. C. B. 2015, ARA&A, 53, 541 [Google Scholar]
- Brosset, P., Dahoo, R., Gauthierroy, B., Abouafmarguin, L., & Lakhlifi, A. 1993, Chem. Phys., 172, 315. [CrossRef] [Google Scholar]
- Carrascosa, H., Hsiao, L.-C., Sie, N.-E., Muñoz Caro, G. M., & Chen, Y.-J. 2019, MNRAS, 486, 1985 [CrossRef] [Google Scholar]
- Caselli, P., & Ceccarelli, C. 2012, A&ARv, 20, 56 [Google Scholar]
- Caselli, P., Walmsley, C. M., Zucconi, A., et al. 2002, ApJ, 565, 331 [NASA ADS] [CrossRef] [Google Scholar]
- Chou, S.-L., Lin, M.-Y., Huang, T.-P., & Wu, Y.-J. 2020, J. Mater. Sci., 1209, 127954 [Google Scholar]
- Congiu, E., Fedoseev, G., Ioppolo, S., et al. 2012, ApJ, 750, L12 [NASA ADS] [CrossRef] [Google Scholar]
- Cooper, J. F., Johnson, R. E., Mauk, B. H., Garrett, H. B., & Gehrels, N. 2001, Icarus, 149, 133 [NASA ADS] [CrossRef] [Google Scholar]
- Cooper, P. D., Moore, M. H., & Hudson, R. L. 2008, Icarus, 194, 379 [NASA ADS] [CrossRef] [Google Scholar]
- Cooper, P. D., Moore, M. H., & Hudson, R. L. 2010, J. Geophys. Res., 115, E10013 [CrossRef] [Google Scholar]
- Cruikshank, D. P., Roush, T. L., Owen, T. C., et al. 1993, Science, 261, 742 [NASA ADS] [CrossRef] [PubMed] [Google Scholar]
- Cruikshank, D. P., Grundy, W. M., DeMeo, F. E., et al. 2015, Icarus, 246, 82 [NASA ADS] [CrossRef] [Google Scholar]
- Cruz-Diaz, G. A., Muñoz Caro, G. M., Chen, Y.-J., & Yih, T.-S. 2014a, A&A, 562, A119 [NASA ADS] [CrossRef] [EDP Sciences] [Google Scholar]
- Cruz-Diaz, G. A., Muñoz Caro, G. M., Chen, Y.-J., & Yih, T.-S. 2014b, A&A, 562, A120 [NASA ADS] [CrossRef] [EDP Sciences] [Google Scholar]
- Dalton, J. B., Cruikshank, D., Stephan, K., et al. 2010, SSR, 153, 113 [Google Scholar]
- Dawes, A., Mason, N. J., & Fraser, H. J. 2016, Phys. Chem. Chem. Phys., 18, 1245 [NASA ADS] [CrossRef] [Google Scholar]
- Dawes, A., Pascual, N., Mason, N. J., et al. 2018, Phys. Chem. Chem. Phys., 20, 15273 [CrossRef] [Google Scholar]
- de Barros, A. L. F., da Silveira, E. F., Bergantini, A., Rothard, H., & Boduch, P. 2015, ApJ, 810, 156 [NASA ADS] [CrossRef] [Google Scholar]
- Dodge, M. J. 1984, Appl. Optics, 23, 1980 [CrossRef] [PubMed] [Google Scholar]
- Douglas, A. E., & Jones, W. J. 1965, Can. J. Phys., 43, 2216 [CrossRef] [Google Scholar]
- Dows, D. A., 1957, J. Chem. Phys., 26, 745 [CrossRef] [Google Scholar]
- Drouin, D., Couture, A. R., Joly, D., et al. 2007, Scanning, 29, 92 [CrossRef] [PubMed] [Google Scholar]
- Dulieu, F., Minissale, M., & Bockelee-Morvan, D. 2017, A&A, 597, A56 [NASA ADS] [CrossRef] [EDP Sciences] [Google Scholar]
- Dupuy, R., Féraud, G., Bertin, M., et al. 2017, A&A, 606, L9 [CrossRef] [EDP Sciences] [Google Scholar]
- Eden, S., Limão-Vieira, P., Hoffmann, S. V., & Mason, N. J. 2006, Chem. Phys., 323, 313 [CrossRef] [Google Scholar]
- Eistrup, C., & Walsh, C. 2019, A&A, 621, A75 [CrossRef] [EDP Sciences] [Google Scholar]
- Elsila, J., Allamandola, L. J., & Sandford, S. A. 1997, ApJ, 479, 818 [NASA ADS] [CrossRef] [PubMed] [Google Scholar]
- Fayolle, E. C., Bertin, M., Romanzin, C., et al. 2011, ApJ, 739, L36 [NASA ADS] [CrossRef] [Google Scholar]
- Fayolle, E. C., Bertin, M., Romanzin, C., et al. 2013, A&A, 556, A122 [NASA ADS] [CrossRef] [EDP Sciences] [Google Scholar]
- Fateley, W. G., Bent, H. A., & Crawford Jr., B. 1959, J. Chem. Phys., 31, 204 [CrossRef] [Google Scholar]
- Fulvio, D., Sivaraman, B., Baratta, G. A., Palumbo, M. E., & Mason, N. J. 2009, Spectrochim. Acta A, 72, 1007 [NASA ADS] [CrossRef] [Google Scholar]
- Goodman, A. M. 1978, Appl. Optics, 17, 2779 [NASA ADS] [CrossRef] [Google Scholar]
- Grundy, W. M., Binzel, R. P., Buratti, B. J., et al. 2016, Science, 351, aad9189 [NASA ADS] [CrossRef] [Google Scholar]
- Hendrix, A. R., Hansen, C. J., & Holsclaw, G. M. 2010, Icarus, 206, 608 [NASA ADS] [CrossRef] [EDP Sciences] [Google Scholar]
- Herbst, E., & van Dishoeck, E. F. 2009, ARA&A, 47, 427 [NASA ADS] [CrossRef] [Google Scholar]
- Hincelin, U., Wakelam, V., Hersant, F., et al. 2011, A&A, 530, A61 [NASA ADS] [CrossRef] [EDP Sciences] [Google Scholar]
- Holland, R. F., & Maier II, W. B. 1983, J. Chem. Phys., 78, 2928 [CrossRef] [Google Scholar]
- Hudson, R. D. 1971, Rev. Geophys., 9, 305 [NASA ADS] [CrossRef] [Google Scholar]
- Hudson, R. L. 2018, ApJ, 867, 160 [CrossRef] [Google Scholar]
- Hudson, R. L., & Gerakines, P. A. 2019, MNRAS, 485, 861 [CrossRef] [Google Scholar]
- Hudson, R. L., & Moore, M. 2002, ApJ, 568, 1095 [NASA ADS] [CrossRef] [Google Scholar]
- Hudson, R. L., Palumbo, M. E., Strazzulla, G., et al. 2008, The Solar System Beyond Neptune, eds. M. A. Barucci, H. Boehnhardt, D. P. Cruikshank, & A. Morbidelli (Tucson, AZ: University of Arizona Press), 507 [Google Scholar]
- Ioppolo, S., Cuppen, H. M., Romanzin, C., van Dishoeck, E. F., & Linnartz, H. 2008, ApJ, 686, 1474 [NASA ADS] [CrossRef] [Google Scholar]
- Ioppolo, S., Cuppen, H. M., Romanzin, C., van Dishoeck, E. F., & Linnartz, H. 2010, Phys. Chem. Chem. Phys., 12, 12065 [NASA ADS] [CrossRef] [Google Scholar]
- Ioppolo, S., Fedoseev, G., Minissale, M., et al. 2014, Phys. Chem. Chem. Phys., 16, 8270 [Google Scholar]
- Jamieson, C. S., & Kaiser, R. I. 2007, Chem. Phys. Lett., 440, 98 [NASA ADS] [CrossRef] [Google Scholar]
- Jamieson, C. S., Bennett, C. J., Mebel, A. M., & Kaiser, R. I. 2005, ApJ, 624, 436 [NASA ADS] [CrossRef] [Google Scholar]
- Jones, B. M., Kaiser, R. I., & Strazzulla, G. 2014a, ApJ, 781, 85 [NASA ADS] [CrossRef] [Google Scholar]
- Jones, B. M., Kaiser, R. I., & Strazzulla, G. 2014b, ApJ, 788, 170 [NASA ADS] [CrossRef] [Google Scholar]
- Johnson, R. E., Oza, A. V., Leblanc, F., et al. 2019, SSR, 215, 20 [Google Scholar]
- Kaňuchová, Z., Urso, R. G., Baratta, G. A., et al. 2016, A&A, 585, A155 [NASA ADS] [CrossRef] [EDP Sciences] [Google Scholar]
- Knauth, D. C., Andersson, B.-G., McCandliss, S. R., & Moos, H. W. 2004, Nature, 429, 636 [NASA ADS] [CrossRef] [Google Scholar]
- Licandro, J., Pinilla-Alonso, N., Pedani, M., et al. 2006, A&A, 445, L35 [NASA ADS] [CrossRef] [EDP Sciences] [Google Scholar]
- Lo, J.-I., Chou, S.-L., Peng, Y.-C., et al. 2015, ApJSS, 221, 20 [NASA ADS] [CrossRef] [Google Scholar]
- Lo, J.-I., Chou, S.-L., Peng, Y.-C., et al. 2018, ApJ, 864, 95 [CrossRef] [Google Scholar]
- Lo, J.-I., Chou, S.-L., Peng, Y.-C., Lu, H.-C., & Cheng, B.-M. 2019, ApJ, 877, 27 [CrossRef] [Google Scholar]
- Loeffler, M. J., & Hudson, R. L. 2016, ApJ, 833, L9 [CrossRef] [Google Scholar]
- Lu, H.-C., Chen, H.-K., Cheng, B.-M., & Ogilvie, J. F. 2008, Spectrochim. Acta A, 71, 1485 [NASA ADS] [CrossRef] [Google Scholar]
- Luspay-Kuti, A., Mousis, O., Lunine, J. I., et al. 2018, SSR, 214, 115 [Google Scholar]
- Martin-Domanech, R., Muñoz Caro, G. M., & Cruz-Diaz, G. A. 2016, A&A, 589, A107 [NASA ADS] [CrossRef] [EDP Sciences] [Google Scholar]
- Mason, N. J., Dawes, A., Holtom, P. D., et al. 2006, Faraday Discuss., 133, 311 [NASA ADS] [CrossRef] [Google Scholar]
- Matar, E., Congiu, E., Dulieu, F., Momeni, A., & Lemaire, J. L. 2008, A&A, 492, L17 [NASA ADS] [CrossRef] [EDP Sciences] [Google Scholar]
- McClure, M. K. 2019, A&A, 632, A32 [NASA ADS] [CrossRef] [EDP Sciences] [Google Scholar]
- Minissale, M., Fedoseev, G., Congiu, E., et al. 2014, Phys. Chem. Chem. Phys., 16, 8257 [Google Scholar]
- Mencos, A., Nourry, S., & Krim, L. 2017, MNRAS, 467, 2150 [CrossRef] [Google Scholar]
- Miyauchi, N., Hidaka, H., Chigai, T., et al. 2008, Chem. Phys. Lett., 456, 27 [NASA ADS] [CrossRef] [Google Scholar]
- Moore, M. H., & Hudson, R. L. 2003, Icarus, 161, 486 [NASA ADS] [CrossRef] [Google Scholar]
- Mousis, O., Ronnet, T., Brugger, B., et al. 2016, ApJ, 823, L41 [NASA ADS] [CrossRef] [Google Scholar]
- Muñoz Caro, G. M., Chen, Y.-J., Aparicio, S., et al. 2016, A&A, 589, A19 [NASA ADS] [CrossRef] [EDP Sciences] [Google Scholar]
- Niemann, H. B., Atreya, S. K., Bauer, S. J., et al. 2005, Nature, 438, 779 [NASA ADS] [CrossRef] [PubMed] [Google Scholar]
- Nour, E. M., Chen, L. H., & Laane, J. 1983, J. Phys. Chem., 87, 1113 [CrossRef] [Google Scholar]
- Owen, T. C., Roush, T. L., Cruikshank, D. P., et al. 1993, Science, 261, 745 [NASA ADS] [CrossRef] [PubMed] [Google Scholar]
- Palmer, M. H., Ridley, T., Hoffmann, S. V., et al. 2015, J. Chem. Phys., 142, 134302 [CrossRef] [Google Scholar]
- Palumbo, M. E., Baratta, G. A., Fulvio, D., et al. 2008, J. Phys. Chem. Sci., 101, 1012002 [Google Scholar]
- Pavithraaa, S., Lo, J.-I., Rahul, K., et al. 2018, Spectrochim. Acta A, 190, 172 [CrossRef] [Google Scholar]
- Pineau des Forets, G., Roueff, E., & Flower, D. R. 1990, MNRAS, 244, 668 [Google Scholar]
- Robert Wu, C. Y., Judge, D. L., Cheng, B.-M., et al. 2002, Icarus, 156, 456 [NASA ADS] [CrossRef] [Google Scholar]
- Royer, E. M., & Hendrix, A. R. 2014, Icarus, 242, 158 [CrossRef] [Google Scholar]
- Rubin, M., Altwegg, K., van Dishoeck, E. F., & Schwehm, G. 2015, ApJ, 815, L11 [NASA ADS] [CrossRef] [Google Scholar]
- Samuelson, R. E., Nath, N. R., & Borysow, A. 1997, Planet Space Sci., 45, 959 [NASA ADS] [CrossRef] [Google Scholar]
- Satorre, M. A., Domingo, M., Millan, C., et al. 2008, Planet Space Sci., 56, 1748 [CrossRef] [Google Scholar]
- Schmitt, B., Philippe, S., Grundy, W. M., & the New Horizons Science Team 2017, Icarus, 287, 229 [NASA ADS] [CrossRef] [Google Scholar]
- Sicilia, D., Ioppolo, S., Vindigni, T., Baratta, G. A., & Palumbo, M. E. 2012, A&A, 543, A155 [NASA ADS] [CrossRef] [EDP Sciences] [Google Scholar]
- Sivaraman, B., Jamieson, C. S., Mason, N. J., & Kaiser, R. I. 2007, ApJ, 669, 1414 [CrossRef] [Google Scholar]
- Sivaraman, B., Mebel, A. M., Mason, N. J., Babikov, D., & Kaiser, R. I. 2011, Phys. Chem. Chem. Phys., 13, 421 [CrossRef] [Google Scholar]
- Sivaraman, B., Nair, B. G., Raja Sekhar, B. N., et al. 2014, Chem. Phys. Lett., 603, 33 [CrossRef] [Google Scholar]
- Stirling, A., Papai, I., Mink, J., & Salahub, D., R. 1994, J. Chem. Phys., 100, 2910 [CrossRef] [Google Scholar]
- Strazzulla, G.,& Johnson, R. E. 1991, Comets in the Post-Halley Era R. Jr Newburn, eds. M. Neugebauer, & J. Rahe (Dordrecht: Kluwer), 243 [NASA ADS] [CrossRef] [Google Scholar]
- Strazzulla, G., Cooper, J. F., Christian, E. R., & Johnson, R. E. 2003, C. R. Phys., 4, 791 [Google Scholar]
- Strazzulla, G., Leto, G., Spinella, F., & Gomis, O. 2005, Astrobiology, 5, 612 [NASA ADS] [CrossRef] [PubMed] [Google Scholar]
- Taquet, V., Furuya, K., Walsh, C., & van Dishoeck, E. F. 2016, MNRAS, 462, S99 [NASA ADS] [CrossRef] [Google Scholar]
- Teolis, B. D., Loeffler, M. J., Raut, U., Fama, M., & Baragiola, R. A. 2006, ApJ, 644, L141 [NASA ADS] [CrossRef] [Google Scholar]
- Teolis, B. D., Wyrick, D. Y., Bouquet, A., Magee, B. A., Waite Jr., J. H. 2017, Icarus, 284, 18 [CrossRef] [Google Scholar]
- Tielens, A. G. G. M., & Hagen, W. 1982, A&A, 114, 245 [Google Scholar]
- van Dishoeck, E. F., Herbst, E., & Neufeld, D. A. 2013, Chem. Rev., 113, 9043 [NASA ADS] [CrossRef] [PubMed] [Google Scholar]
- Vasconcelos, F. A., Pilling, S., Rocha, W. R. M., Rothard, H., & Boduch, P. 2017, Phys. Chem. Chem. Phys., 19, 24154 [CrossRef] [Google Scholar]
- Waite Jr., J. H., Combi, M. R., Ip, W.-H., et al. 2006, Science, 311, 1419 [NASA ADS] [CrossRef] [PubMed] [Google Scholar]
- Waite Jr., J. H., Lewis, W. S., & Magee, B. A. 2009, Nature, 460, 487 [NASA ADS] [CrossRef] [Google Scholar]
- Westley, M. S., Baratta, G. A., & Baragiola, R. A. 1998, J. Chem. Phys., 108, 3321 [NASA ADS] [CrossRef] [Google Scholar]
- Wu, Y.-J., Robert Wu, C. Y., Chou, S.-L., et al. 2012, ApJ, 746, 175 [NASA ADS] [CrossRef] [Google Scholar]
- Wu, Y.-J., Chen, H.-F., Chuang, S.-J., & Huang, T.-P. 2013a, ApJ, 768, 83 [NASA ADS] [CrossRef] [Google Scholar]
- Wu, Y.-J., Chen, H.-F., Chuang, S.-J., & Huang, T.-P. 2013b, ApJ, 779, 40 [CrossRef] [Google Scholar]
- Yildiz, U. A., Acharyya, K., Goldsmith, P. F., et al. 2013, A&A, 558, A58 [NASA ADS] [CrossRef] [EDP Sciences] [Google Scholar]
- Zastrow, M., Clarke, J. T., Hendrix, A. R., & Noll, K. S. 2012, Icarus, 220, 29 [CrossRef] [Google Scholar]
All Tables
Main experimental parameters, i.e., density of material, refractive index n1 at 632.8 nm, ice thickness d, maximum fluence, and dose.
VUV photoabsorption features detected after deposition of pure nitrogen oxide ices at 22 K and compared to band peak positions of a VUV spectrum of 1 keV irradiated O2:N2 = 1:1 mixture heated to 50 K.
VUV photoabsorption features detected after deposition of nitrogen oxide ice mixtures at 22 K.
All Figures
|
Fig. 1 Schematic top view of the Portable Astrochemistry Chamber (PAC) used to measure VUV and MIR spectra of astrochemical ices at (a) ASTRID2 synchrotron light source at Aarhus University in Denmark, and (b) the Molecular Astrophysics Laboratory at The Open University, UK, respectively. |
| In the text | |
|
Fig. 2 Results from CASINO simulations of 1 keV electrons trajectories in N- and O-rich ices. For each simulation 1000 trajectories were calculated. All electrons impinging normal to the O2 ice surface are stopped at 0.045 μm (blue line), while only about 50, 70, and 90% of electrons are stopped in solid N2 (red line), nitrogen oxides (light and dark green and light blue lines) and the O2:N2 = 1:1 ice mixture (black line) at this depth. |
| In the text | |
|
Fig. 3 Left panel: VUV absorbance spectrum (120−340 nm) of frozen oxygen as deposited at 22 K (solid black curve) and after 1 keV electron irradiation at two different fluences (dashed green and solid blue lines). Right panel: VUV absorbance spectrum (120− 340 nm) of electron-irradiated frozen oxygen (22 K; solid blue line) is shown along with the spectra obtained after heating to 35 K (solid red line), 50 K (solid magenta line), and then cooling down to 22 K (dot-dashed black line). The dotted green line isa fit of the 35 K spectrum by means of Eq. (3) to highlight the Rayleigh-scattering tail in the spectrum. |
| In the text | |
|
Fig. 4 FT-IR spectrum in absorbance of an O2 ice as deposited at 22 K (solid black line), after 1 keV electron bombardment (solid blue line), and annealed to 30 K (solid green line), 35 K (solid red line), and 50 K, then cooled to 22 K (dot-dashed black line) in the spectral region around the antisymmetric stretching mode of solid O3. |
| In the text | |
|
Fig. 5 VUV absorbance spectrum (115−150 nm) of frozen nitrogen as deposited at 22 K (solid black line) and after 1 keV electron irradiation at given fluences (solid red and blue lines). Formation of N3 is highlighted in the inset of the figure (solid blue line). |
| In the text | |
|
Fig. 6 Left panel: VUV absorbance spectrum (120−340 nm) of a frozen mixture O2:N2 = 1:1 as deposited at 22 K (dotted blue line) and after 1 keV electron irradiation at two different fluences (dashed black and solid red lines). Right panel: irradiated mixture is shown again (solid red line) on a different scale, along with the spectra obtained after annealing the ice to 50 K (dashed black line). |
| In the text | |
|
Fig. 7 VUV absorbance spectrum (120−340 nm) of a frozen mixture O2:N2 = 1:1 obtained after electron bombardment and annealing to 50 K (solid black line) is compared to VUV spectra of O3 at 50 K formed after electron irradiation of pure O2 at 22 K (magenta squares), pure deposited NO2 (red circles), and N2O ices at 22 K(blue diamonds). |
| In the text | |
|
Fig. 8 VUV absorbance spectra (120−340 nm) of pure NO (top panel), N2O (middle panel), and NO2 (bottom panel) ices as deposited at 22 K (solid black lines) and after exposure to 1 keV electrons. |
| In the text | |
|
Fig. 9 VUV absorbance spectra (120−340 nm) of NO:NO2 = 1:1 (top panel), NO:N2O = 2:1 (mid-panel),and NO2:N2O = 1:1 (bottom panel) ice mixtures as deposited at 22 K (solid black lines) and after exposure to 1 keV electrons. |
| In the text | |
|
Fig. 10 VUVphotoabsorption cross sections for pure NO, NO2, and N2O ices deposited at 22 K. |
| In the text | |
|
Fig. 11 VUV(115−190 nm) Cassini UVIS data of the surface of Enceladus (square black symbols), Dione (square dark gray symbols), and Rhea (square light gray symbols) compared to a two-fit components (solid red and green lines) of the VUV photoabsorption spectra of solid water and nitrogen dioxide deposited at 22 K (solid light and dark gray lines, respectively). The laboratory ice components are normalized and scaled in the figure for clarity. |
| In the text | |
Current usage metrics show cumulative count of Article Views (full-text article views including HTML views, PDF and ePub downloads, according to the available data) and Abstracts Views on Vision4Press platform.
Data correspond to usage on the plateform after 2015. The current usage metrics is available 48-96 hours after online publication and is updated daily on week days.
Initial download of the metrics may take a while.