Fig. 3
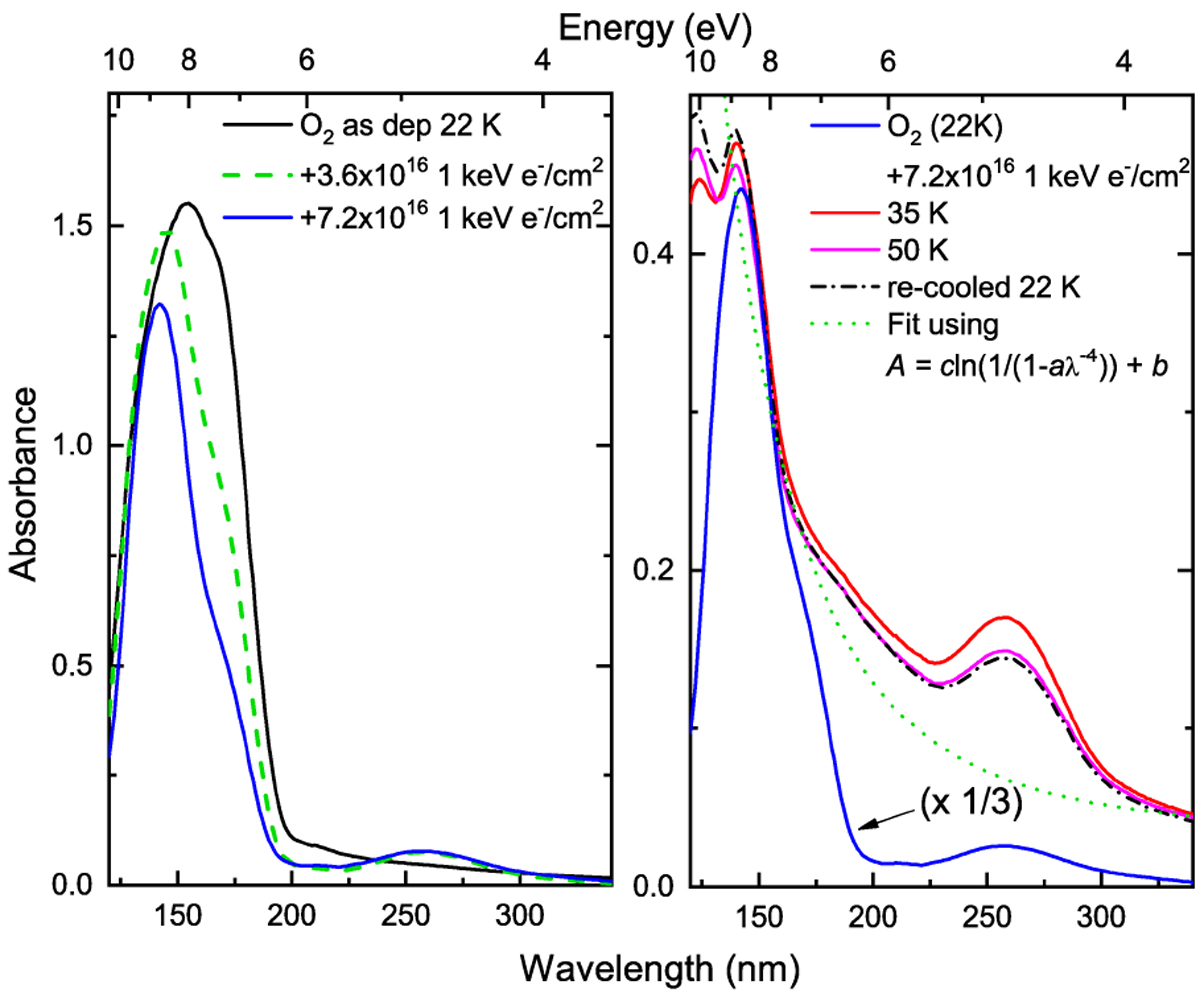
Left panel: VUV absorbance spectrum (120−340 nm) of frozen oxygen as deposited at 22 K (solid black curve) and after 1 keV electron irradiation at two different fluences (dashed green and solid blue lines). Right panel: VUV absorbance spectrum (120− 340 nm) of electron-irradiated frozen oxygen (22 K; solid blue line) is shown along with the spectra obtained after heating to 35 K (solid red line), 50 K (solid magenta line), and then cooling down to 22 K (dot-dashed black line). The dotted green line isa fit of the 35 K spectrum by means of Eq. (3) to highlight the Rayleigh-scattering tail in the spectrum.
Current usage metrics show cumulative count of Article Views (full-text article views including HTML views, PDF and ePub downloads, according to the available data) and Abstracts Views on Vision4Press platform.
Data correspond to usage on the plateform after 2015. The current usage metrics is available 48-96 hours after online publication and is updated daily on week days.
Initial download of the metrics may take a while.