Fig. 7
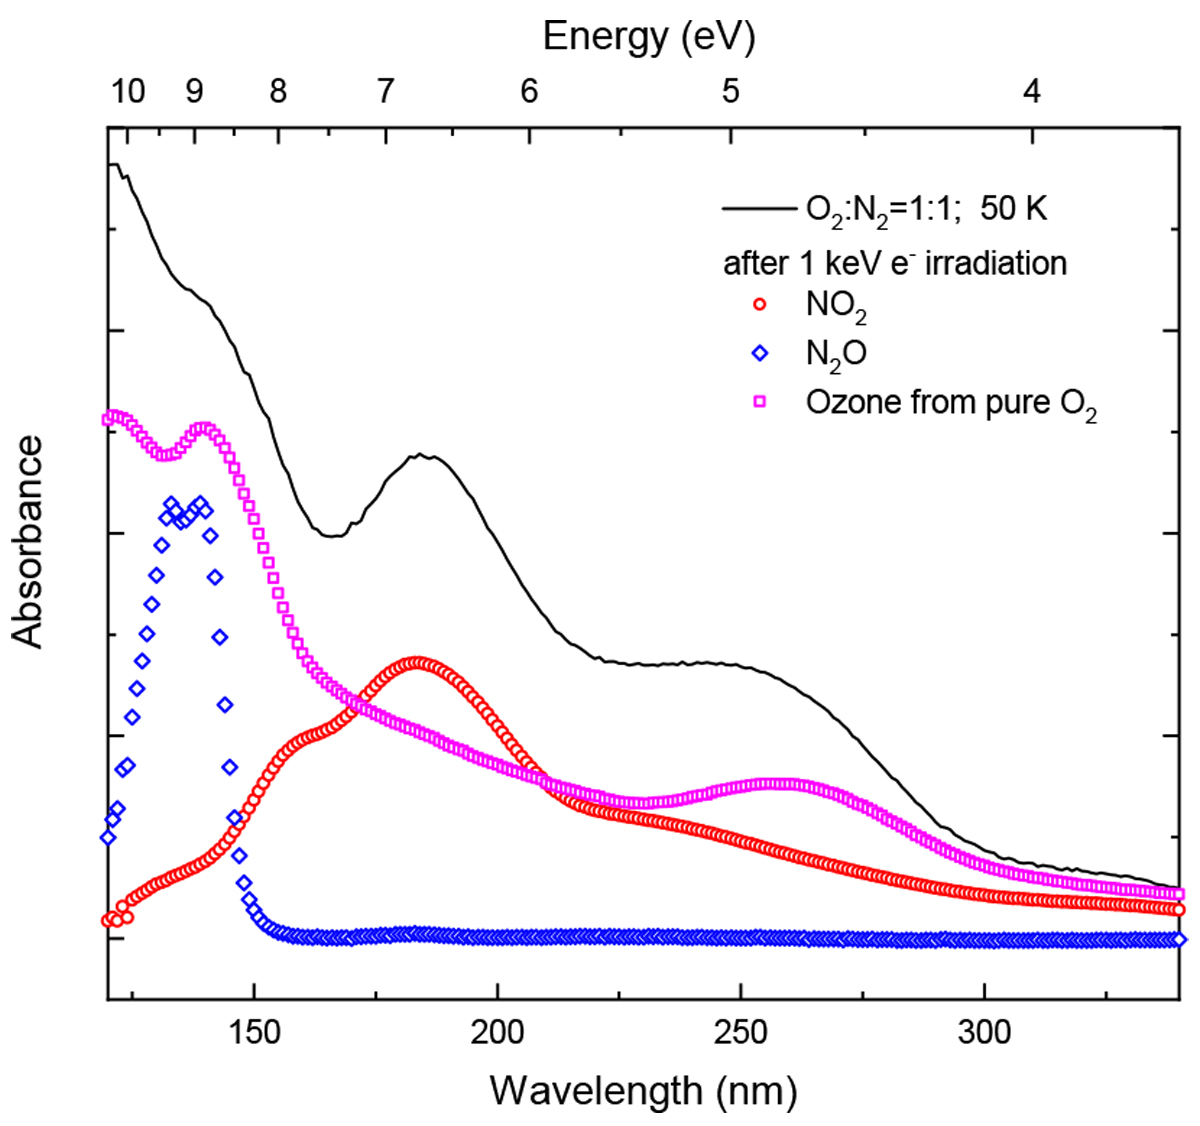
VUV absorbance spectrum (120−340 nm) of a frozen mixture O2:N2 = 1:1 obtained after electron bombardment and annealing to 50 K (solid black line) is compared to VUV spectra of O3 at 50 K formed after electron irradiation of pure O2 at 22 K (magenta squares), pure deposited NO2 (red circles), and N2O ices at 22 K(blue diamonds).
Current usage metrics show cumulative count of Article Views (full-text article views including HTML views, PDF and ePub downloads, according to the available data) and Abstracts Views on Vision4Press platform.
Data correspond to usage on the plateform after 2015. The current usage metrics is available 48-96 hours after online publication and is updated daily on week days.
Initial download of the metrics may take a while.