Fig. 4
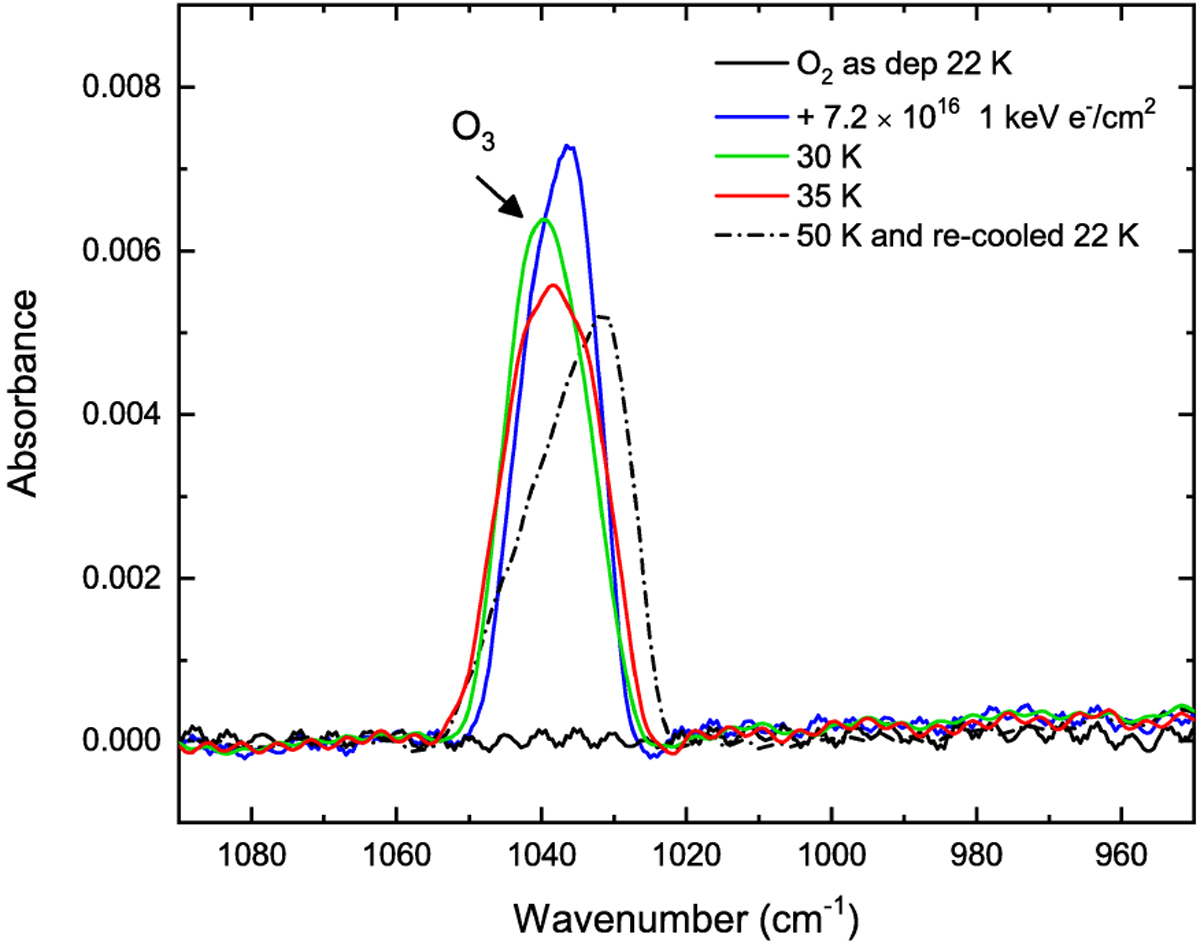
FT-IR spectrum in absorbance of an O2 ice as deposited at 22 K (solid black line), after 1 keV electron bombardment (solid blue line), and annealed to 30 K (solid green line), 35 K (solid red line), and 50 K, then cooled to 22 K (dot-dashed black line) in the spectral region around the antisymmetric stretching mode of solid O3.
Current usage metrics show cumulative count of Article Views (full-text article views including HTML views, PDF and ePub downloads, according to the available data) and Abstracts Views on Vision4Press platform.
Data correspond to usage on the plateform after 2015. The current usage metrics is available 48-96 hours after online publication and is updated daily on week days.
Initial download of the metrics may take a while.