| Issue |
A&A
Volume 640, August 2020
|
|
|---|---|---|
| Article Number | C6 | |
| Number of page(s) | 6 | |
| Section | Planets and planetary systems | |
| DOI | https://doi.org/10.1051/0004-6361/201935623e | |
| Published online | 27 August 2020 | |
Atmospheric characterization of the ultra-hot Jupiter MASCARA-2b/KELT-20b
Detection of Ca II, Fe II, Na I, and the Balmer series of H (Hα, Hβ, and Hγ) with high-dispersion transit spectroscopy (Corrigendum)
1
Instituto de Astrofísica de Canarias,
Vía Láctea s/n,
38205
La Laguna,
Tenerife, Spain
e-mail: nuriacb@iac.es
2
Departamento de Astrofísica, Universidad de La Laguna,
La Laguna, Spain
3
Institut für Astrophysik, Georg-August-Universität,
Friedrich- Hund-Platz 1,
37077
Göttingen, Germany
4
Key Laboratory of Planetary Sciences, Purple Mountain Observatory, Chinese Academy of Sciences,
Nanjing
210008, PR China
5
Hamburger Sternwarte, Universität Hamburg,
Gojenbergsweg 112,
21029
Hamburg, Germany
6
Centre for Exoplanet Science, University of St Andrews,
St Andrews, UK
7
SUPA, School of Physics & Astronomy, University of St Andrews,
St Andrews,
KY16 9SS, UK
8
SRON Netherlands Institute for Space Research,
Sorbonnelaan 2,
3584 CA Utrecht, The Netherlands
9
National Astronomical Observatory of Japan,
2-21-1 Osawa,
Mitaka,
Tokyo 181-8588, Japan
10
SOKENDAI (The Graduate University of Advanced Studies),
2-21-1 Osawa,
Mitaka,
Tokyo 181-8588, Japan
11
Astrobiology Center,
2-21-1 Osawa,
Mitaka,
Tokyo 181-8588, Japan
12
JST, PRESTO,
2-21-1 Osawa,
Mitaka,
Tokyo 181-8588, Japan
13
Centro de Astrobiología (CSIC-INTA),
Carretera de Ajalvir km 4,
28850
Torrejón de Ardoz,
Madrid, Spain
14
Department of Earth and Planetary Science, Graduate School of Science, The University of Tokyo,
7-3-1 Hongo,
Bunkyo-ku,
Tokyo
113-0033, Japan
Key words: planetary systems / methods: observational / techniques: spectroscopic / planets and satellites: individual: MASCARA-2b / planets and satellites: individual: KELT-20b – errata, addenda
The original article has two errors which are corrected below and which do not have any impact on the conclusions.
- 1.
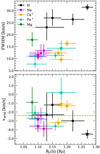
In Fig. 7 of the original article, the labels inside the plot are inverted. The corrected figure is shown in Fig. 1.
- 2.
There was an error in the constant value used for the conversion between the standard deviation (σ) and the full width at half maximum (FWHM) when fitting the exoplanet atmospheric absorption with a Gaussian profile. As a result, all of the FWHM values shown in the original article change by a constant value. The affected tables and figures from the main text are those containing FWHM information, that is to say, Tables 4, 5, and Fig. 13. In the appendix, this affects Table B.1 and all corner plots from Appendix D (Figs. D.1–D.7). The corrected tables and figures are presented below in the same order as in the original article.
© ESO 2020
All Tables
Best fit parameters and 1-σ error bars from the Markov chain Monte Carlo (MCMC) analysis of the Hα line for each individual night and combined HARPS-N observations.
Summary of the results obtained in the analysis is presented here for the different species and instruments.
All Figures
 |
Fig. 1 Transmission spectra around Hα line obtained with all nights of HARPS-N combined and CARMENES data (Night 4), with an offsetfor a better visualisation. The best-fit Gaussian profiles are shown in red. In grey, we show the original transmission spectrum and the black dots show the data binned in 0.2 Å intervals. |
| In the text | |
 |
Fig. 2 Top: FWHM values vs. Rλ(h). Bottom: vwind values vs. Rλ(h). The measurements obtained with HARPS-N data are shown with dots, while those obtained with CARMENES data are marked with stars. The horizontal blue dashed line shows the mean vwind value at − 2.4 ± 1.0 km s−1. All values were extracted from Table 2. |
| In the text | |
 |
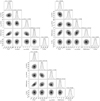
Fig. 3 Correlation diagrams of MCMC analysis of the Hα line of CARMENES (left) and HARPS-N data analysis (right). |
| In the text | |
 |
Fig. 4 Correlation diagrams of MCMC analysis of the Hβ (left) and Hγ (right) lines obtained with the HARPS-N data analysis. |
| In the text | |
 |
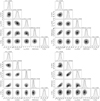
Fig. 5 Correlation diagrams of MCMC analysis of the Ca II triplet lines of CARMENES. The Ca II λ8498 Å diagram is shown in the top left panel, Ca II λ8542 Å is in the top right panel, and λ8662 Å is in the bottom panel. |
| In the text | |
 |
Fig. 6 Correlation diagrams of MCMC analysis of the Na I D2 line of CARMENES (left) and HARPS-N data analysis (right). |
| In the text | |
 |
Fig. 7 Correlation diagrams of MCMC analysis of the Na I D1 line of CARMENES (left) and HARPS-N data analysis (right). |
| In the text | |
 |
Fig. 8 Correlation diagrams of MCMC analysis of the Fe II triplet lines. The Fe II λ5018 Å diagram is shown in the top left and Fe II λ5169 Å is in the top right, both of which result from the HARPS-N combined data analysis. The Fe II λ5316 Å diagrams are shown in the bottom panels: the HARPS-N analysis is on the left and the CARMENES analysis is on the right. |
| In the text | |
 |
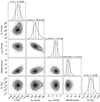
Fig. 9 Correlation diagrams of MCMC analysis of the Mg I line at 5173 Å. |
| In the text | |
Current usage metrics show cumulative count of Article Views (full-text article views including HTML views, PDF and ePub downloads, according to the available data) and Abstracts Views on Vision4Press platform.
Data correspond to usage on the plateform after 2015. The current usage metrics is available 48-96 hours after online publication and is updated daily on week days.
Initial download of the metrics may take a while.


