Fig. 2
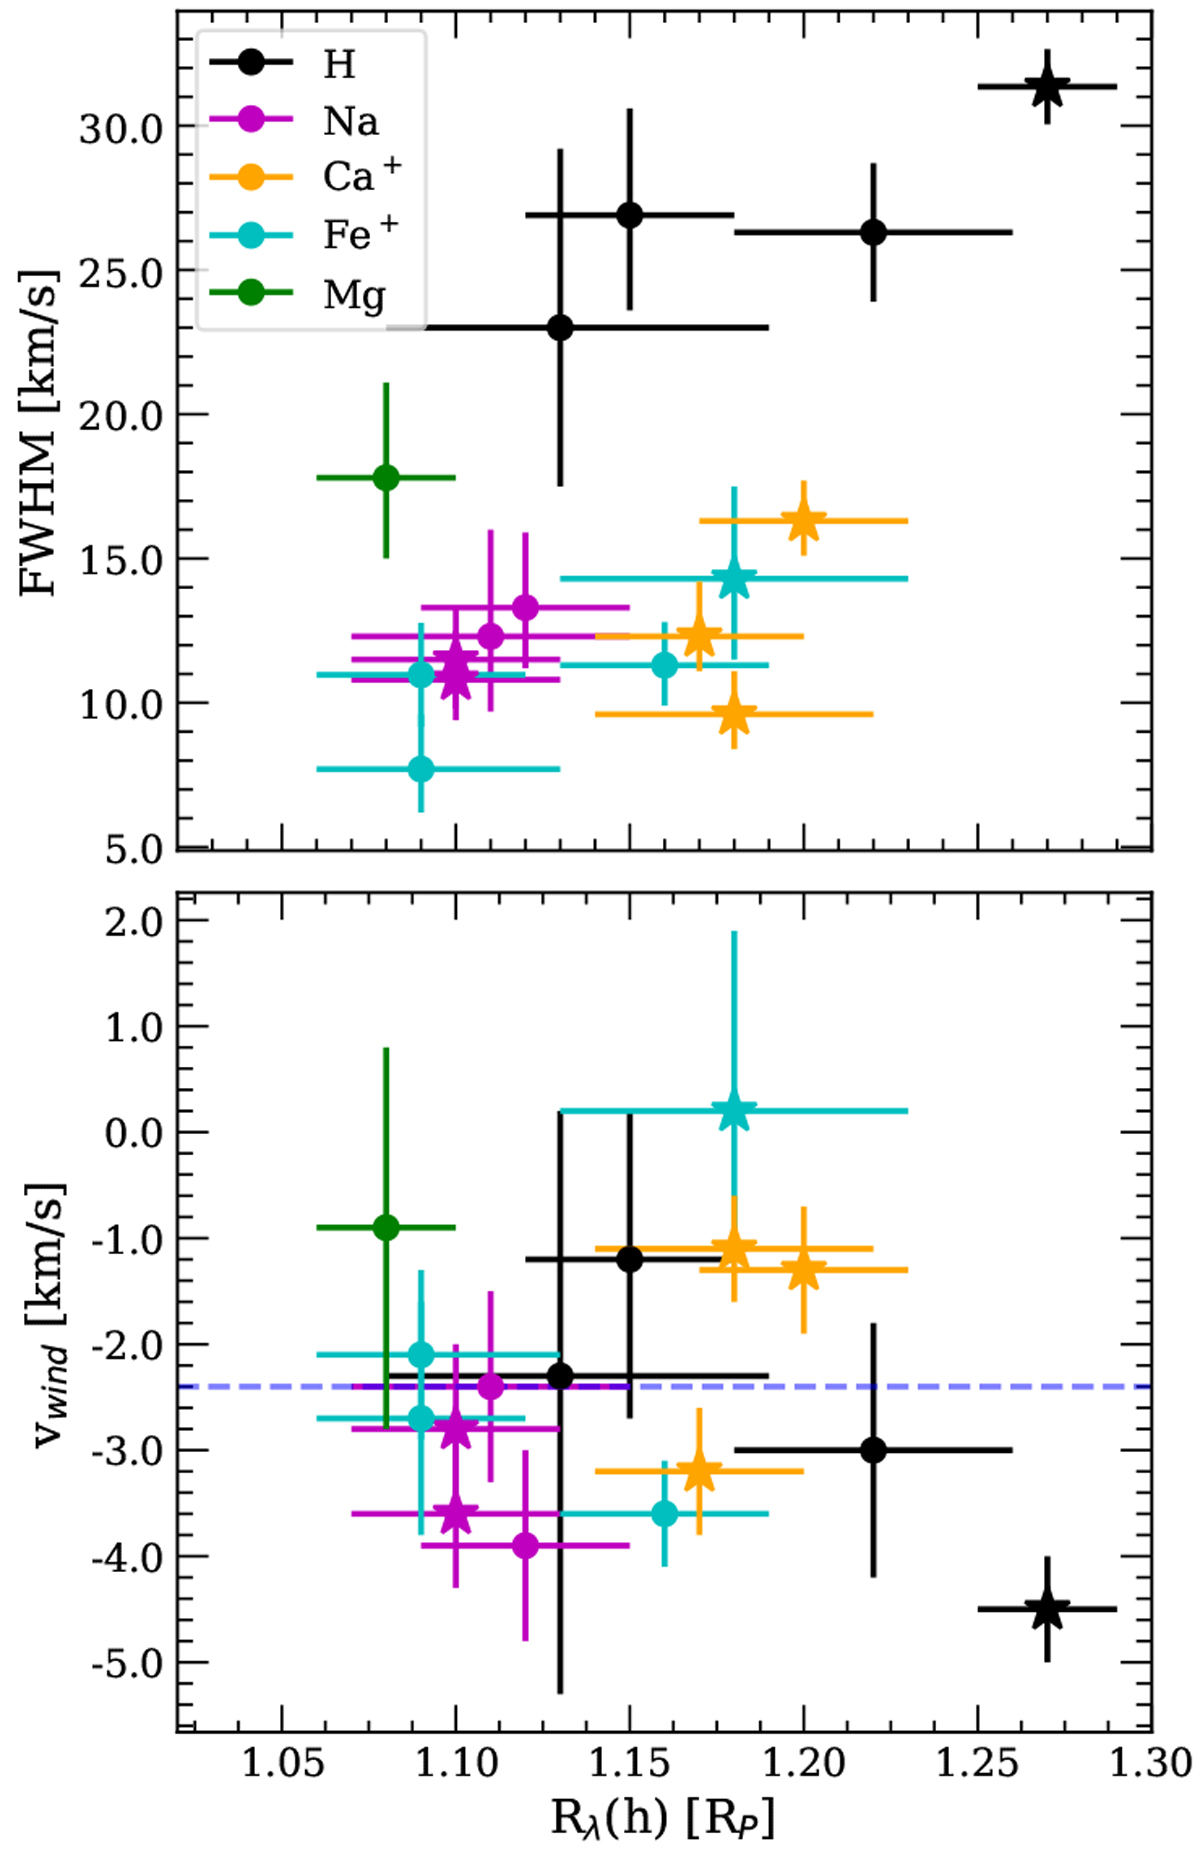
Top: FWHM values vs. Rλ(h). Bottom: vwind values vs. Rλ(h). The measurements obtained with HARPS-N data are shown with dots, while those obtained with CARMENES data are marked with stars. The horizontal blue dashed line shows the mean vwind value at − 2.4 ± 1.0 km s−1. All values were extracted from Table 2.
Current usage metrics show cumulative count of Article Views (full-text article views including HTML views, PDF and ePub downloads, according to the available data) and Abstracts Views on Vision4Press platform.
Data correspond to usage on the plateform after 2015. The current usage metrics is available 48-96 hours after online publication and is updated daily on week days.
Initial download of the metrics may take a while.