Fig. 5
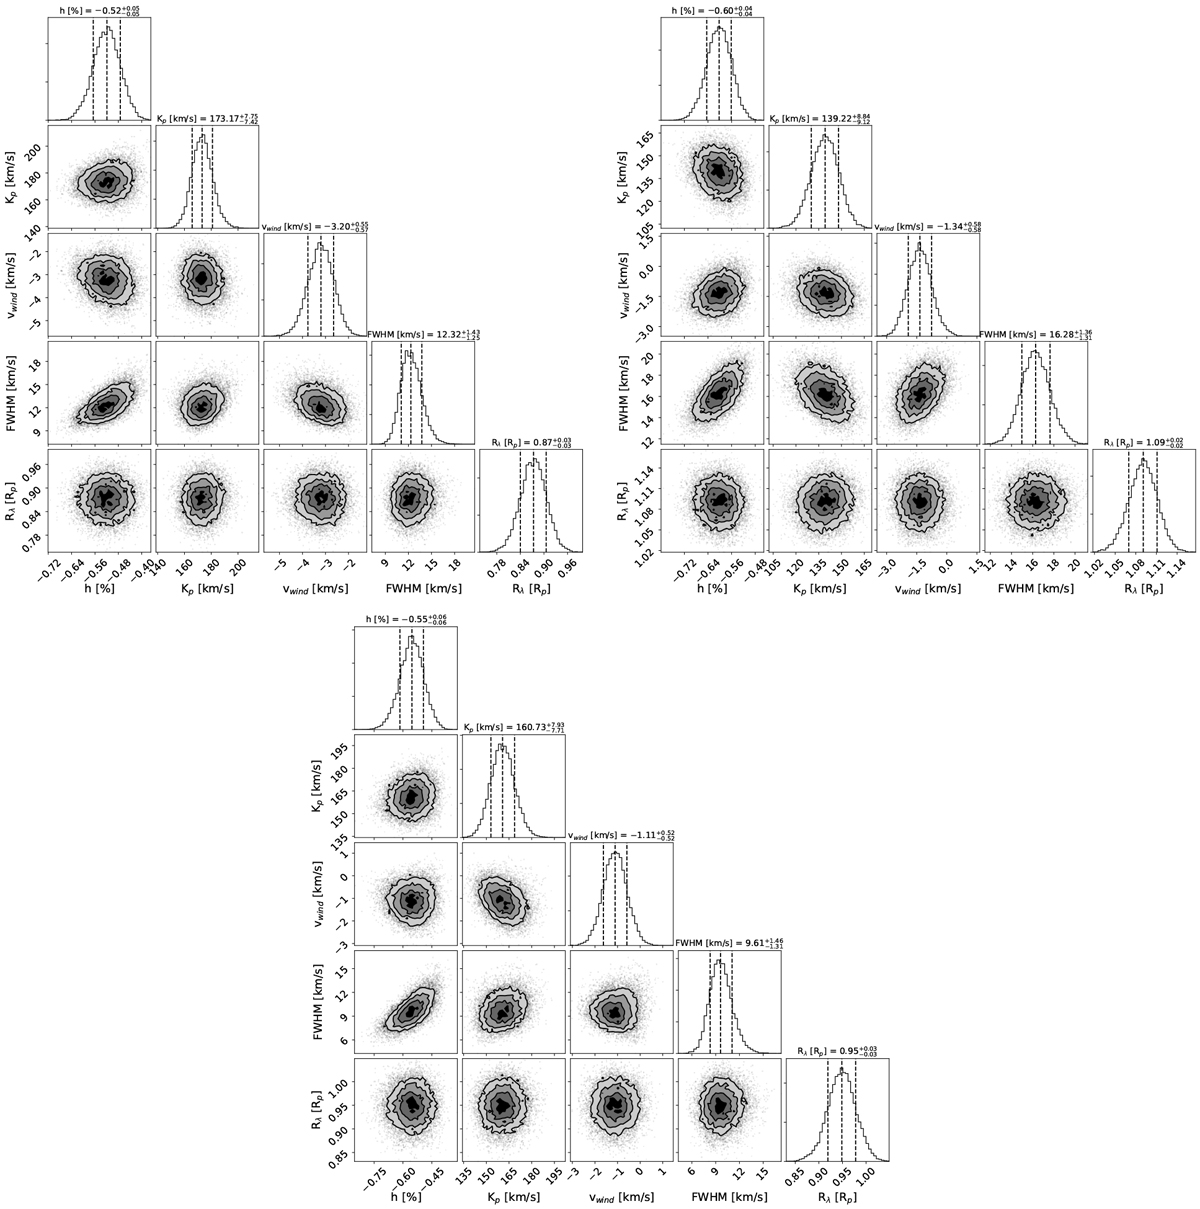
Correlation diagrams of MCMC analysis of the Ca II triplet lines of CARMENES. The Ca II λ8498 Å diagram is shown in the top left panel, Ca II λ8542 Å is in the top right panel, and λ8662 Å is in the bottom panel.
Current usage metrics show cumulative count of Article Views (full-text article views including HTML views, PDF and ePub downloads, according to the available data) and Abstracts Views on Vision4Press platform.
Data correspond to usage on the plateform after 2015. The current usage metrics is available 48-96 hours after online publication and is updated daily on week days.
Initial download of the metrics may take a while.