| Issue |
A&A
Volume 639, July 2020
|
|
|---|---|---|
| Article Number | L10 | |
| Number of page(s) | 6 | |
| Section | Letters to the Editor | |
| DOI | https://doi.org/10.1051/0004-6361/202038403 | |
| Published online | 16 July 2020 | |
Letter to the Editor
The sustained post-outburst brightness of Nova Per 2018, the evolved companion, and the long orbital period⋆
1
National Institute of Astrophysics (INAF), Astronomical Observatory of Padova, 36012 Asiago (VI), Italy
e-mail: This email address is being protected from spambots. You need JavaScript enabled to view it.
2
ANS Collaboration, c/o Astronomical Observatory, 36012 Asiago (VI), Italy
Received:
12
May
2020
Accepted:
21
June
2020
Abstract
Nova Per 2018 (= V392 Per) halted the decline from maximum when it was 2 mag brighter than quiescence and since 2019 has been stable at such a plateau. The ejecta have already fully diluted into the interstellar space. We obtained BVRIgrizY photometry and optical spectroscopy of V392 Per during the plateau phase and compared it with equivalent data gathered prior to the nova outburst. We find the companion star (CS) to be a G9 IV/III and the orbital period to be 3.4118 days, making V392 Per the longest known period for a classical nova. The location of V392 Per on the theoretical isochrones is intermediate between that of classical novae and novae erupting within symbiotic binaries, in a sense bridging the gap. The reddening is derived to be EB − V = 0.72 and the fitting to isochrones returns a 3.6 Gyr age for the system and 1.35 M⊙, 5.3 R⊙, and 15 L⊙ for the companion. The huge Ne overabundance in the ejecta and the very fast decline from nova maximum both point to a massive white dwarf (WD) (MWD ≥ 1.1−1.2 M⊙). The system is viewed close to pole-on conditions and the current plateau phase is caused by irradiation of the CS by the WD still burning at the surface.
Key words: novae / cataclysmic variables
Table 1 is only available at the CDS via anonymous ftp to cdsarc.u-strasbg.fr (130.79.128.5) or via http://cdsarc.u-strasbg.fr/viz-bin/cat/J/A+A/639/L10
© ESO 2020
1. Introduction
Prior to its 2018 nova outburst (discovered by Y. Nakamura on 2018 Apr. 29.474 UT; cf. CBET 4515), V392 Per was a poorly studied cataclysmic variable (Bruch et al. 1987), eliciting little interest for its rare dwarf nova outbursts (only a few of which have been recorded) and faintness (mag 17.5 on blue photographic plates during quiescence). For some time it was considered lost because of the uncertainty of its position (Bruch et al. 1987) but was properly identified in later catalogs of cataclysmic variables (Downes et al. 1997). Early attempts to record its spectrum were scrubbed by the faintness of the system (Zwitter & Munari 1994). The only published spectrum of V392 Per prior to its 2018 nova outburst was presented by Liu & Hu (2000), who observed the star on 27 Nov 1998, when they estimated it was at V = 17.4 mag.
V392 Per attracted wide interest during its recent 2018 nova outburst, in spite of the quickly approaching conjunction with the Sun. Spectral confirmation as a FeII-type nova was soon provided by Wagner et al. (2018), who measured FWHM = 5200 km s−1 and E.W.=115 Å for the emission, and −2680 km s−1 and E.W.=16 Å for the absorption of the P-Cyg profile affecting Hα. Within one day of the outburst announcement, V392 Per was detected as a strong gamma-ray source by Fermi-LAT (Li et al. 2018). Spectra on the following days (Tomov et al. 2018; Darnley et al. 2018a) supported a widening of the emission profiles (FWHM = 5600 km s−1) and an even larger velocity for the P-Cyg absorption (−4000 km s−1). The main novelty was, however, the splitting of the emission component into three well separated peaks (−2000, −250, and +1900 km s−1), which is a structure destined to last for the rest of the outburst (Darnley 2018a,b; Munari & Ochner 2018; Munari et al. 2020; Stoyanov et al. 2020), and a close match to what observed and modeled by Munari et al. (2011) in the He/N-type nova V2672 Nova Oph 2009, seen very close to pole-on conditions.
The huge strength they recorded for neon emission lines led Munari & Ochner (2018) to classify V392 Per as a Neon nova, which usually implies a massive progenitor for the current white dwarf (WD). Recently, Munari et al. (2020) found that V392 Per did not return to quiescence brightness, but instead remained stuck at ∼2 mag above it, reminiscent of novae burning nuclearly at the surface for years after the end of the outburst (e.g., V723 Cas, Ochner et al. 2015). We will refer to such “sustained post-outburst brightness” of V392 Per as SPOB in the rest of this paper.
Radio observations during the first two weeks of the outburst were carried out with VLA and AMI-LA by Linford et al. (2018); the observations clearly detected the nova at 5.0, 7.0, and 15.5 GHz, and the spectral index supported a synchrotron emission mechanism. Finally, it was only following the solar conjunction that the Swift X-ray/UV satellite could be aimed at V392 Per. Darnley et al. (2018b) reported on these observations and on the uncertainty in modeling them given the low recorded flux level.
No information is currently available concerning the orbital period of V392 Per, and therefore the evolutionary status of the donor star that Darnley & Starrfield (2018) suggest it could be evolved. In this paper we compare and analyze the spectral energy distribution (SED) of V392 Per in quiescence and during SPOB, derive the physical properties of the donor star, and compare these properties with the orbital period of the system we determined.
2. Observations
A low resolution spectrum of V392 Per (range 3500−8000 Å, dispersion 2.31 Å pix−1) was obtained on 2020 Apr 22.833 UT with the B&C spectrograph +300 ln mm−1 grating mounted on the Asiago 1.22 m telescope. It is presented in Fig. 1. It updates the spectrum for 2019 Dec 14 described in Munari et al. (2020), which was obtained with an identical instrument set-up.
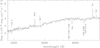 |
Fig. 1. Post-outburst spectrum of V392 Per for 2020 Apr 22.833 UT. |
Time-resolved optical photometry of V392 Per was obtained in the VRI bands using the ANS Collaboration 0.42 m f/5 Newtonian telescope located in Bastia (Ravenna, Italy; ANS identifer ID 1205), for the purpose of detecting orbital modulation; V392 Per was observed for a total of 17 nights and 135 visits, that is to say about eight VRI set per night on average. The presence of a field star of similar magnitude just 8 arcsec to the north (hereafter FS8) meant the photometry had to be carried out in a PSF-fitting mode. The results are given in Table 1. The quoted error is the quadratic sum of the Poissonian error on the variable and the error in the transformation from the instantaneous local photometric system to the Landolt equatorial standard system. Additional single-visit photometry, aimed to map the SED during SPOB, was obtained in Landolt BVRI and PanSTARRS grizY bands with ANS Collaboration ID 310 and Asiago 67/92 cm Schmidt telescopes; it is summarized in Table 2.
Time-resolved VRI photometry of V392 Per.
3. Sustained post-outburst brightness (SPOB)
As first noted by Munari et al. (2020), in 2019 V392 Per stopped declining in brightness toward its quiescence value. This SPOB plateau can be clearly seen in Fig. 2, which shows the g-band lightcurve of V392 Per reconstructed from observations collected by surveys monitoring the sky for transients ASAS-SN (Shappee et al. 2014; Kochanek et al. 2017) and ZTF (Bellm et al. 2019; Masci 2019). The large difference between the two sets of data is due to the large pixel-size of ASAS-SN (7.8 arcsec) that prevents separating V392 Per from FS8. In Table 2 we compare pre-outburst photometry of V392 Per (and FS8) from PanSTARRS PS1 (Chambers et al. 2016) with ours for two SPOB epochs in March 2020. While FS8 has remained the same, V392 Per is stuck at 2.0 mag brighter than quiescence in g, and this amount declines smoothly with wavelength down to 1.3 mag at Y. This indicates that the source responsible for the SPOB is hotter than V392 Per was, as a whole, in quiescence.
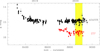 |
Fig. 2. Post-outburst g-band lightcurve of V392 Per from ASAS-SN and ZTF data. The region in yellow is the interval covered by our time-resolved observations in search of the orbital period. |
The higher temperature conditions of V392 Per during SPOB are confirmed by the spectrum in Fig. 1 when compared with the quiescence spectrum presented by Liu & Hu (2000). The latter was characterized by Hα/Hβ < SPSDOUBLEDOLLAR > ∼1 and HeII 4686/Hβ ∼ 0.5. In the spectrum of Fig. 1, Hβ is possibly too weak to be seen while HeII 4686 is very strong, rivaling Hα in intensity; HeI 6678 also stands out clearly. It is also worth noting that the only remaining signature of the nova ejecta, [OIII] 5007, has further declined compared to its appearance in the spectrum for 2019 Dec 14, described by Munari et al. (2020), and is now just barely visible, marking the final end of the nova phase.
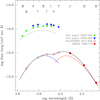 |
Fig. 3. Spectral energy distribution of V392 Per in quiescence (solid black line), split into the hot (blue line) and cool (red line) components, and during SPOB (cyan line). The dashed black line is the difference between the blue and cyan lines and represents the excess emission during the SPOB phase (see Sect. 5). |
4. Reddening
Reddening plays a crucial role in deriving the evolutionary status of the companion star (CS) to the WD in V392 Per. There are only two published estimates, which are in gross disagreement.
The Bayestar2019 3D map of Galactic extinction by Green et al. (2019) reports  at the Gaia DR2 distance (3.88 kpc) along the general line of sight to V392 Per. Tomov et al. (2018), on their high resolution (RP = 30 000) spectra of V392 Per, found the diffuse interstellar bands at 5780, 5797, and 6614 Å, as well as the interstellar lines of NaI (5890, 5896 Å) and KI (7665, 7699 Å) to be very strong; they derived EB − V = 1.18 ± 0.10 from their equivalent widths.
The high EB − V estimated by Tomov et al. (2018) is in contrast to the observed photometric color. van den Bergh & Younger (1987) measured a mean intrinsic color (B − V)° = +0.23 ± 0.06 for novae at optical maximum, and (B − V)° = −0.02 ± 0.04 at t2. The AAVSO lightcurve shows that V392 Per was slightly past maximum when, on 2018 Apr. 30.116 UT, B − V = 0.92 was measured by S. Kiyota (cf. CBET 4515, where no estimate of the error is provided), from which we derive EB − V = 0.72 ± 0.06.
5. Spectral energy distribution (SED)
V392 Per in quiescence is present in several all-sky photometric catalogs, but in most of them it is blended with FS8 and/or the different bands were observed at widely different epochs. The only two catalogs resolving V392 Per from FS8 and presenting simultaneous multi-band data are PanSTARRS PS1 grizY bands observed on 2012.194 (Chambers et al. 2016) and 2MASS JHKS bands observed on 1999.773 (Cutri et al. 2003). Their combined SED is presented in Fig. 3 (black line) and is clearly bi-modal, with the WD+accretion disk dominating over griz and the CS on JHKS, with the Y band marking the smooth transition between the two. This very fact indicates that the brightness of V392 Per was similar at the time of the PanSTARRS and 2MASS visits, and consequently their data can be safely combined into a unique SED, marked by the black solid line in Fig. 3. We deconvolved it into two components by fitting two second-order polynomials, represented by the blue and red lines in Fig. 3. We did not attempt to fit more complex distributions in view of the very few available points (eight) constraining the overall fit, and the uncertainty of any deviation from standard photospheric and disk models due to irradiation and viewing angle. The adopted simplification, however, has no practical consequence on the conclusions reached in this paper.
The original 2MASS photometry of V392 Per in quiescence reads J = 13.766 (±0.031), H = 13.290 (±0.038), and Ks = 13.062 (±0.037). After subtracting the contribution of the hot component as in Fig. 3, they become (red line) J ∼ 14.099, H ∼ 13.392, and Ks ∼ 13.092. It is relevant to note the very small amount of the subtraction affecting the Ks band, which constrains the evolutionary status of the CS.
The SED of V392 Per during SPOB has been derived at two nearby epochs, 2020.194 and 2020.208, and plotted in Fig. 3 as green and blue rhombuses from the data listed in Table 2. The SED at these two epochs is the same except for an offset of Δm ∼ 0.1 mag, which corresponds to the typical amplitude of brightness variation during SPOB. A second-order polynomial fit is plotted as a cyan line. Subtracting the SED of the hot component in quiescence (blue line) from it results in the dashed black line in Fig. 3; this represents the source of the extra brightness of V392 Per during SPOB. We have fitted back-body distributions to the dashed line in Fig. 3 as a function of EB − V and the results are reported in Table 3: with increasing reddening, the temperature and luminosity go up and the dimensions decline.
6. Isochrones fitting
The 2MASS photometry of the CS in V392 Per (red line in Fig. 3) is compared with Padova isochrones (Bressan et al. 2012) in Fig. 4 for the values of EB − V listed in Sect. 4 and Table 3. We have also plotted the position of some reference objects: (a) two cataclysmic variables of the same UGEM type as V392 Per, one in quiescence and the other in outburst (U Gem with Period = 4.2 and SS Cyg with P = 6.6 h, respectively); (b) four novae that have some of the longest known orbital periods (P = 0.6042 days for V841 Oph, P = 0.6905 days for V368 Aql, P = 1.2306 days for U Sco, and P = 1.9968 days for GK Per); and (c) two recurrent novae with giant secondaries (T CrB with P = 227 days and RS Oph with P = 454 days). The results of fitting to isochrones (for solar metallicity) is summarized in the first six columns of Table 4. A higher reddening corresponds to a younger system and a more massive, more luminous, and hotter CS.
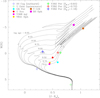 |
Fig. 4. Position of the CS in V392 Per (red line in Fig. 3) on the Padova isochrones for the 2MASS plane, dereddened for the EB − V values listed in Sect. 4 and Table 4. Dereddened 2MASS photometry of some representative novae and cataclysmic variables with accurate Gaia parallax is plotted for comparison (see text for details). |
Properties of the CS to the WD in V392 Per from fitting to Padova isochrones on the 2MASS plane, as a function of EB − V reddening.
The remaining columns of Table 4 are devoted to deriving the orbital period expected under the assumption that the CS (of radius RCS) fills its Roche lobe, as it is customary to assume in cataclysmic variables and novae (cf. Warner 1995). To this aim, two alternatives are considered for the mass of the WD. The first is the expected WD mass (from Cummings et al. 2000) produced by a progenitor, which on the main sequence had a mass 10% larger than the current CS. The second alternative is a WD mass of 1.10 M⊙, a minimum (Doherty et al. 2015) for a WD of ONeMg composition taking into consideration the neon overabundance in the ejecta of V392 Per reported by Munari & Ochner (2018). A high mass for the WD (M ≥ 1.2 M⊙) is also supported by the very short decline times, t2 = 3 and t3 = 11 days, measured by Stoyanov et al. (2020), relative to Kato & Hachisu (1994) theoretical models.
The requirement for the CS to fill its Roche lobe sets the relation between stellar radius and orbital separation. If q = MCS/MWD is the mass ratio, the orbital separation follows from the Eggleton (1983) relation:
 (1)
(1)
The orbital period in the last column of Table 4 is then computed from Kepler’s third law: (MCS + MWD)P2 = a3.
The main results of Fig. 4 and Table 4 are that the evolutionary status of the CS requires the orbital period of V392 Per to be longer than those of classical novae. The knowledge of the orbital period (see next section) considerably narrows the uncertainty on properties of the CS left open by the ±0.06 mag error on the adopted EB − V = 0.72 reddening.
7. The orbital period
Our time-resolved VRI observations in Table 1 have been examined for periodicities. For the analysis we adopted Fourier transforms following the formulation by Deeming (1975), and checked the results with the phase dispersion minimization algorithm of Stellingwerf (1978). The Fourier power spectrum and spectral window over the 5.0–0.5 day interval are plotted in Fig. 5; the results outside this interval are insignificant.
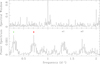 |
Fig. 5. Spectral window and power spectrum over the 5.0 − 0.5 day interval for the Fourier analysis of V-band data in Table 1. The green triangle and red dot mark the 3.4118 and 1.4118 day periods, respectively, and a1 and a2 mark their respective one-day aliases. |
There are two clear peaks in the power spectrum, at 3.4118 and 1.4107 days, as well as at their one-day aliases (the one-day aliases are marked respectively with a1 and a2 in Fig. 5). Their broad pedestals are caused by the ∼70 day duration of the observing campaign and the grouping of observations to avoid bright Moon phases. It is worth noting that the two peaks relate as 1/3.4118 + 1/1.4107 = 1.00 days, so they are not mutually independent.
Determining which is the true period and which is the alias can be done with the help of Table 4. The 3.4118 day period corresponds to highly reasonable values for the age and mass of the CS, and match the reddening (EB − V = 0.72) derived from the photometric color of the nova at maximum. On the contrary, a period of 1.4107 days would require an impossibly high value for EB − V (≥1.8 mag) and a very young age for the system (≤0.3 Gyr), much younger than is typical for cataclysmic variables and novae in general. The robustness of the 3.4118 day period is also confirmed by the pre-whitening analysis of the data (see Appendix A). The photometry of V392 Per in Table 1 is phase-plotted in Fig. 6 following the ephemeris:
 (2)
(2)
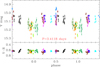 |
Fig. 6. Phased light-curves for the V-band data in Table 1 according to ephemeris in Eq. (2). Different colors mark data from different nights. The bars are the total error budget listed in Table 1. |
8. System properties
From 2MASS photometry, orbital period, and the assumption of Roche-lobe filling, it follows that the CS in V392 Per is an early giant that has just begun the ascent along the giant branch, and it is characterized by 5.34 R⊙, 1.35 M⊙, 15 L⊙, and Teff = 4875 K. Such values correspond to a G9 IV-III star (estimated from parameters listed in Cox 2000). Such a binary system is highly unusual among classical novae, and appears to bridge the gap with novae erupting within symbiotic stars, as its location in Fig. 4 clearly shows. The presence of an early giant in the system is in agreement with the very early detection of γ-rays and synchrotron radio emission within one day of nova discovery, probably caused by fast ejecta slamming onto a pre-existing and slow circumstellar medium formed by the CS wind (cf. Abdo et al. 2010). None of the preliminary descriptions currently available report evidence from spectra of V392 Per of a deceleration of the ejecta or narrow components from flash-ionized wind from the companion; however, such deficiencies have already been seen in the nova outbursts of V3890 Sgr (Munari & Walter 2019) and Nova Sco 2014 (Munari & Banerjee 2018), which harbor much cooler and more luminous giants with, presumably, much larger mass-loss rates into the circumstellar space than V392 Per.
The brightness of V392 Per at the peak of nova outburst is V ∼ 6.3 and the mean in quiescence is V ∼ 16.9 (from AAVSO lightcurve). The limited ΔV ∼ 10.6 mag outburst amplitude falls much shorter than the 13.5 mag value implied by the amplitude versus t2 decline-time relation for face-on systems (Fig. 5.4 in Warner 1995, updated to the zero-point by Selvelli & Gilmozzi 2019), with an obviously increasing discrepancy for larger orbital inclinations. The brighter-than-usual magnitude in quiescence is further evidence of the presence of a CS in V392 Per that is much brighter than in classical novae, whose optical brightnesses are completely dominated by the accretion disk. In this sense, it is worth noting that at the distance ( kpc, from Gaia DR2 parallax) and reddening (EB − V = 0.72) affecting V392 Per, the G9 IV-III companion would shine at V ∼ 17.35, adopting the absolute magnitude tabulated by Sowell et al. (2017). To add to V ∼ 16.9 in quiescence, the WD+disk needs to emit at V ∼ 18.0, brighter than the V ∼ 18.8 implied by the MMRD relation (magnitude at maximum versus rate of decline) as calibrated on Gaia distances by Selvelli & Gilmozzi (2019), and scaled to face-on orbital inclination. The wider orbital separation and higher mass transfer in V392 Per are able to support a disk that is larger and brighter than in classical novae.
If a low orbital inclination of V392 Per is favored by the above line of reasoning on the brightness in quiescence, it is actually required by the profile of emission lines observed during the 2018 nova outburst. The bulk velocity of the approaching and receding components of the bipolar flow (−2000 and +1900 km s−1; Tomov et al. 2018) are among the largest ever observed in classical novae; such a wide split can only be obtained for a low orbital inclination and close to face-on orientation. At low orbital inclination, the side of the CS that is irradiated by the burning WD is in constant sight, and a limited deviation from i = 0° is responsible for the small amplitude (Δm ∼ 0.1 mag) of the orbital modulation (Fig. 6). The constancy of photometric color along the orbital motion (Fig. 6) agrees with the inferred low inclination. For comparison, the orbital modulation caused by irradiation in V723 Cas amounts to ∼2 mag given the much larger orbital inclination of that system (∼65°, Ochner et al. 2015). The irradiated side of the CS as the source of the extra optical brightness of V392 Per during SPOB is confirmed by the large dimension derived in Table 3 for the EB − V = 0.72 case (implied by the P = 3.4118 day orbital period and confirmed by the color at nova maximum). This scenario is also in agreement with the small equivalent width of the emission lines in the spectrum shown in Fig. 1: they need the high temperature of an irradiated disk to form but have to emerge over the rethermalization spectrum of the irradiated side of the CS (which is too cold to originate any of these emission lines, cf. Table 3).
Acknowledgments
We thank P. Selvelli (INAF Trieste) and R. Raddi (UC, Barcelona) for useful discussions and P. Ochner (Univ. of Padova), S. Dallaporta, A. Frigo, V. Andreoli, M. Graziani and S. Tomaselli (ANS Collaboration), for collecting some of the photometric data used in this project.
References
- Abdo, A. A., Ackermann, M., Ajello, M., et al. 2010, Science, 329, 817 [NASA ADS] [CrossRef] [PubMed] [Google Scholar]
- Bellm, E. C., Kulkarni, S. R., Graham, M. J., et al. 2019, PASP, 131, 018002 [NASA ADS] [CrossRef] [Google Scholar]
- Bressan, A., Marigo, P., Girardi, L., et al. 2012, MNRAS, 427, 127 [NASA ADS] [CrossRef] [Google Scholar]
- Bruch, A., Fischer, F.-J., & Wilmsen, U. 1987, A&AS, 70, 481 [Google Scholar]
- Chambers, K. C., Magnier, E. A., Metcalfe, N., et al. 2016, ArXiv e-prints [arXiv:1612.05560] [Google Scholar]
- Cox, A. N. 2000, Astrophysical Quantities, 4th edn. (NewYork: Springer) [Google Scholar]
- Cummings, J. D., Kalirai, J. S., Tremblay, P. E., et al. 2000, ApJ, 866, 21 [Google Scholar]
- Cutri, R. M., Skrutskie, M. F., van Dyk, S., et al. 2003, VizieR Online Data Catalog: II/246 [Google Scholar]
- Darnley, M. J. 2018a, ATel., 11846 [Google Scholar]
- Darnley, M. J. 2018b, ATel., 11872 [Google Scholar]
- Darnley, M. J., & Starrfield, S. 2018, RNAAS, 2, 24 [NASA ADS] [Google Scholar]
- Darnley, M. J., Copperwheat, C. M., Harvey, E. J., et al. 2018a, ATel., 11601 [Google Scholar]
- Darnley, M. J., Page, K. L., Beardmore, A. P., et al. 2018b, ATel., 11905 [Google Scholar]
- Deeming, T. J. 1975, Ap&SS, 36, 137 [NASA ADS] [CrossRef] [MathSciNet] [Google Scholar]
- Doherty, C. L., Gil-Pons, P., Siess, L., et al. 2015, MNRAS, 446, 2599 [Google Scholar]
- Downes, R., Webbink, R. F., & Shara, M. M. 1997, PASP, 109, 345 [NASA ADS] [CrossRef] [Google Scholar]
- Eggleton, P. P. 1983, ApJ, 268, 368 [NASA ADS] [CrossRef] [Google Scholar]
- Green, G. M., Schlafly, E., Zucker, C., et al. 2019, ApJ, 887, 93 [NASA ADS] [CrossRef] [Google Scholar]
- Kato, M., & Hachisu, I. 1994, ApJ, 437, 802 [NASA ADS] [CrossRef] [Google Scholar]
- Kochanek, C. S., Shappee, B. J., Stanek, K. Z., et al. 2017, PASP, 129, 4502 [NASA ADS] [CrossRef] [Google Scholar]
- Li, K.-L., Chomiuk, L., & Strader, J. 2018, ATel., 11590 [Google Scholar]
- Linford, J. D., Bright, J., Chomiuk, L., et al. 2018, ATel., 11647 [Google Scholar]
- Liu, W., & Hu, J. Y. 2000, ApJS, 128, 387 [Google Scholar]
- Masci, F. J., Laher, R. R., Rusholme, B., et al. 2019, PASP, 131, 018003 [NASA ADS] [CrossRef] [Google Scholar]
- Munari, U., & Banerjee, D. P. K. 2018, MNRAS, 475, 508 [NASA ADS] [CrossRef] [Google Scholar]
- Munari, U., & Ochner, P. 2018, ATel., 11926 [Google Scholar]
- Munari, U., & Walter, F. M. 2019, ATel., 13099 [Google Scholar]
- Munari, U., Ribeiro, V. A. R. M., Bode, M. F., et al. 2011, MNRAS, 410, 525 [NASA ADS] [CrossRef] [Google Scholar]
- Munari, U., Moretti, S., & Maitan, A. 2020, ATel., 13381 [Google Scholar]
- Ochner, P., Moschini, F., Munari, U., et al. 2015, MNRAS, 454, 123 [CrossRef] [Google Scholar]
- Selvelli, P., & Gilmozzi, R. 2019, A&A, 622, A186 [NASA ADS] [CrossRef] [EDP Sciences] [Google Scholar]
- Shappee, B. J., Prieto, J. L., Grupe, D., et al. 2014, ApJ, 788, 48 [NASA ADS] [CrossRef] [Google Scholar]
- Sowell, J. R., Trippe, M., Caballero-Nieves, S. M., et al. 2017, AJ, 134, 1089 [NASA ADS] [CrossRef] [Google Scholar]
- Stellingwerf, R. F. 1978, ApJ, 224, 953 [NASA ADS] [CrossRef] [Google Scholar]
- Stoyanov, K. A., Tomov, T., Stateva, I., et al. 2020, Bulgarian AJ, 32, 63 [Google Scholar]
- Tomov, T., Stateva, I., Georgiev, S., et al. 2018, ATel., 11605 [Google Scholar]
- van den Bergh, S., & Younger, P. F. 1987, A&AS, 70, 125 [NASA ADS] [Google Scholar]
- Wagner, R. M., Terndrup, D., Darnley, M. J., et al. 2018, ATel., 11588 [Google Scholar]
- Warner, B. 1995, Cataclysmic Variable Stars (Cambridge Univ. Press) [CrossRef] [Google Scholar]
- Zwitter, T., & Munari, U. 1994, A&AS, 107, 503 [NASA ADS] [Google Scholar]
Appendix A: Fourier analysis of pre-whitened photometric data
A Fourier analysis was carried out on the same input photometric data used for the periodogram of Fig. 5, after pre-whitening for the 3.4118 day period. The results are shown in Fig. A.1. The absence of residual peaks confirms the correctness of the derived period.
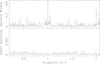 |
Fig. A.1. Spectral window and power spectrum over the 5.0−0.5 day interval for the Fourier analysis of V-band data in Table 1 after pre-whitening for the 3.4118 day period. |
All Tables
Properties of the CS to the WD in V392 Per from fitting to Padova isochrones on the 2MASS plane, as a function of EB − V reddening.
All Figures
|
Fig. 1. Post-outburst spectrum of V392 Per for 2020 Apr 22.833 UT. |
| In the text | |
|
Fig. 2. Post-outburst g-band lightcurve of V392 Per from ASAS-SN and ZTF data. The region in yellow is the interval covered by our time-resolved observations in search of the orbital period. |
| In the text | |
|
Fig. 3. Spectral energy distribution of V392 Per in quiescence (solid black line), split into the hot (blue line) and cool (red line) components, and during SPOB (cyan line). The dashed black line is the difference between the blue and cyan lines and represents the excess emission during the SPOB phase (see Sect. 5). |
| In the text | |
|
Fig. 4. Position of the CS in V392 Per (red line in Fig. 3) on the Padova isochrones for the 2MASS plane, dereddened for the EB − V values listed in Sect. 4 and Table 4. Dereddened 2MASS photometry of some representative novae and cataclysmic variables with accurate Gaia parallax is plotted for comparison (see text for details). |
| In the text | |
|
Fig. 5. Spectral window and power spectrum over the 5.0 − 0.5 day interval for the Fourier analysis of V-band data in Table 1. The green triangle and red dot mark the 3.4118 and 1.4118 day periods, respectively, and a1 and a2 mark their respective one-day aliases. |
| In the text | |
|
Fig. 6. Phased light-curves for the V-band data in Table 1 according to ephemeris in Eq. (2). Different colors mark data from different nights. The bars are the total error budget listed in Table 1. |
| In the text | |
|
Fig. A.1. Spectral window and power spectrum over the 5.0−0.5 day interval for the Fourier analysis of V-band data in Table 1 after pre-whitening for the 3.4118 day period. |
| In the text | |
Current usage metrics show cumulative count of Article Views (full-text article views including HTML views, PDF and ePub downloads, according to the available data) and Abstracts Views on Vision4Press platform.
Data correspond to usage on the plateform after 2015. The current usage metrics is available 48-96 hours after online publication and is updated daily on week days.
Initial download of the metrics may take a while.