| Issue |
A&A
Volume 667, November 2022
|
|
|---|---|---|
| Article Number | A7 | |
| Number of page(s) | 12 | |
| Section | Stellar structure and evolution | |
| DOI | https://doi.org/10.1051/0004-6361/202244498 | |
| Published online | 28 October 2022 | |
Persistent nuclear burning in Nova Sgr 2016 N.4 (=V5856 Sgr = ASASSN-16ma) six years past its outburst⋆
1
INAF-Osservatorio Astronomico di Padova, 36012 Asiago (VI), Italy
e-mail: This email address is being protected from spambots. You need JavaScript enabled to view it.
2
INAF-Osservatorio di Astrofisica e Scienza dello Spazio, Via Gobetti 101, 40129 Bologna, Italy
3
Departamento de Ciencias Físicas, Universidad Andrés Bello, Fernández Concha 700, Las Condes, Santiago, Chile
4
Department of Physics and Astronomy, Stony Brook University, Stony Brook, NY 11794-3800, USA
5
Space Telescope Science Institute, 3700 San Martin Drive, Baltimore, MD 21218, USA
6
ANS Collaboration, c/o Astronomical Observatory, 36012 Asiago (VI), Italy
Received:
14
July
2022
Accepted:
3
August
2022
Abstract
We report on the fast Nova Sgr 2016 N.4 being surprisingly trapped in a long-lasting and bright plateau (ΔI≥10 mag above quiescence) six years past the nova eruption. Very few other novae experience a similar occurrence. We carried out an intensive observing campaign collecting daily BVRI photometry and monthly high-resolution optical spectroscopy, and observed the nova in ultraviolet and X-rays with Swift at five distinct epochs. The bolometric luminosity radiated during the plateau is ∼4200 L⊙ (scaled to the distance of the Galactic Bulge), corresponding to stable nuclear burning on a 0.6 M⊙ white dwarf. A stable wind is blown off at full width at zero intensity (FWZI) ∼ 1600 km s−1, with episodic reinforcement of a faster FWZI ∼ 3400 km s−1 mass loss, probably oriented along the polar directions. The collision of these winds could power the emission detected in X-rays. The burning shell has an outer radius of ∼25 R⊙ at which the effective temperature is ∼7600 K, values similar to those of a F0 II/Ib bright giant. The Δm < 1 mag variability displayed during the plateau is best described as chaotic, with the irregular appearance of quasi-periodic oscillations with a periodicity of 15–17 days. A limited amount of dust (≈3 × 10⁻¹¹ M⊙) continuously condenses at Tdust ∼ 1200 K in the outflowing wind, radiating Ldust ∼ 52 L⊙.
Key words: novae / cataclysmic variables / stars: winds / outflows
Full Table 1 and the reduced spectrum of Fig. 2 are only available at the CDS via anonymous ftp to cdsarc.u-strasbg.fr (130.79.128.5) or via http://cdsarc.u-strasbg.fr/viz-bin/cat/J/A+A/667/A7
© U. Munari et al. 2022
 Open Access article, published by EDP Sciences, under the terms of the Creative Commons Attribution License (https://creativecommons.org/licenses/by/4.0), which permits unrestricted use, distribution, and reproduction in any medium, provided the original work is properly cited.
This article is published in open access under the Subscribe-to-Open model. This email address is being protected from spambots. You need JavaScript enabled to view it. to support open access publication.
1. Introduction
ASASSN-16ma was discovered on 2016 October 25.02 UT by the All Sky Automated Survey for Supernovae as a V ∼ 13.7 mag transient (Stanek et al. 2016). It was soon classified by Luckas (2016) as a FeII-type nova, with rather narrow emission lines, unresolved with a full width at half maximum (FWHM) equal to the instrumental PSF, and noted for the absence of P Cyg absorptions to Balmer lines. A month later, on 2016 November 23.1 UT, Rudy et al. (2016) obtained an optical–near-IR spectrum of ASASSN-16ma that confirmed the FeII classification and the general absence of P Cyg absorptions and remarked on the prevailing low expansion velocities (FWHM ∼ 1400 km s−1) and the presence of only low-excitation emission lines (no HeI visible). Nakano et al. (2017) reported ASASSN-16ma to be the fourth nova in Sagittarius for the year 2016 and assigned it the variable star name V5856 Sgr, which we adopt in the rest of this paper.
Two weeks past discovery, γ-ray emission from the nova was observed by Fermi-LAT (Li et al. 2016a): undetected until 2016 November 8, V5856 Sgr suddenly turned into a strong γ-ray source, remaining active (although declining) for the following nine days (Li et al. 2016b). In a reanalysis of these Fermi-LAT data, Li (2022) notes the probable presence at 4σ significance of a 545 s periodicity.
In a comparative analysis of nova optical light curves, Munari et al. (2017) discuss how a second component appears to develop in parallel with the detection of γ rays, and note how in V5856 Sgr such a second component outshined by ∼2 mag the main component associated with the normal expanding ejecta. The presence of an additional component in the optical light curve of V5856 Sgr related to the emergence of γ rays was also noted by Li et al. (2017).
At radio wavelengths the energetic events leading to γ-ray emission did not reverberate much. The radio observations of V5856 Sgr summarized by Chomiuk et al. (2021) show only standard thermal emission associated with the expanding ejecta, peaking approximately three years past the optical maximum, as is typical of many normal novae (Hjellming et al. 1979). None of the features usually associated with shocks and consequent synchrotron emission are visible in the radio data of V5856 Sgr, which is characterized by no early peak and a low brightness temperature, actually one of the lowest on record. In this regard it is worth noting that the radio monitoring of V5856 Sgr started early, when Fermi-LAT was still recording strong γ-ray emission, but the nova remained below the radio detection threshold for the first three months. Chomiuk et al. (2021) remark on how V5856 Sgr appears underluminous at radio wavelengths for the 2.5 kpc distance they adopt. The discrepancy with the other radio novae is lifted, however, if the larger 6.4−7.0 kpc distance derived by Munari et al. (2017) is adopted instead.
The Swift satellite looked for X-ray emission from V5856 Sgr during the main outburst, but none was observed. Of the 13 novae emitting in γ rays and studied by Gordon et al. (2021), only two were not detected as X-ray sources with Swift, namely V1324 Sco and V5856 Sgr. The excessive distance (6.5 kpc) was blamed for the nondetection of V1324 Sco, but the 2.5 kpc distance adopted by Gordon et al. (2021) for V5856 Sgr made its nondetection puzzling. As for the radio luminosity above, also in this case the 6.4−7.0 kpc distance derived by Munari et al. (2017) would justify the nondetection in X-rays. V5856 Sgr is not included in the latest Gaia DR3 data release because it is based on observations collected by the spacecraft prior to 28 May 2017, which is only a few months past the eruption and is too early for any astrometric characterization.
In this paper we focus on the recent and unexpected behavior displayed by V5856 Sgr, after we noted (Munari et al. 2021a,b) that six years past its outburst the nova remains halfway to quiescence (still ΔI ≥ 10 mag brighter than that). We carried out daily BVRI photometry, obtained high-resolution spectroscopy at monthly cadence, and observed on multiple epochs V5856 Sgr in X-rays and ultraviolet with the Swift satellite. A detailed analysis of the whole body of spectroscopic data collected on V5856 Sgr during its entire evolution, including the main outburst, will be the subject of a separate paper (Williams et al., in prep.).
2. Observations
2.1. Optical photometry
Optical photometry of V5856 Sgr was obtained simultaneously in the BVRI bands during 108 nights in 2021 and 111 nights in 2022, with the same robotic 40 cm telescope (located in San Pedro de Atacama, Chile) and the same observing procedures adopted by Munari et al. (2017) to cover the main outburst, in particular (i) the same local photometric sequence around V5856 Sgr was used to solve the color equations for each observing night and accurately place the observations on the Landolt (2009) photometric system, and (ii) photometry was carried out in PSF-fitting mode on the central server of ANS Collaboration in Asiago. The results are given in Table 1, where the quoted uncertainty is the total error budget, adding quadratically all the sources including the Poissonian noise on the variable and the error in the transformation from the local instantaneous photometric system to the Landolt equatorial standard system.
BVRI photometry of V5856 Sgr in 2021 and 2022.
2.2. Optical spectroscopy
Optical spectra of V5856 Sgr were recorded from Italy and from Chile. Table 2 provides a log-book for them.
Log of the spectroscopic observations of V5856 Sgr.
From Italy, low-resolution spectroscopy of V5856 Sgr was obtained with the Asiago 1.22 m telescope equipped with a Boller and Chivens (B&C) spectrograph. The CCD camera is an ANDOR iDus DU440A with a back-illuminated E2V 42-10 sensor, 2048 × 512 array of 13.5 μm pixels. The long-slit spectra were recorded with a 300 ln/mm grating blazed at 5000 Å, and covered the wavelength range from 3300 to 8000 Å at 2.31 Å/pix. The 2 arcsec slit was imaged at a FWHM(PSF) = 2.5 pixel scale. Echelle spectra of V5856 Sgr were obtained with the Varese 0.84 m telescope, equipped with a mark.III Multi-Mode Spectrograph from Astrolight Instruments. The camera is a SBIG ST10XME CCD and the 4250–8850 Å range is covered in 32 orders without inter-order gaps. A 2 × 2 binning and the slit widened to 3 arcsec reduced the resolving power to 11 000. The spectra from both Asiago and Varese were exposed with the slit rotated to the parallactic angle, and the data reduced with IRAF1. For both sites the nova culminates at just 16° above the local horizon, imposing a large airmass and thus poor seeing.
We also observed V5856 Sgr from Chile, where it transits nearly overhead, using the CHIRON (Tokovinin et al. 2013) fiber-fed bench-mounted Echelle fed by the CTIO 1.5 m telescope operated by SMARTS. We used CHIRON in “fiber” mode with 4 × 4 on-chip binning yielding a resolution λ/δλ ≈ 27 800. Exposure times range from 15 to 50 min, typically in co-added 15–20 min integrations. The eight spectra obtained during the 2021 and 2022 observing seasons are listed in Table 2; those obtained at earlier epochs will be discussed in Williams et al., (in prep.).
The data were reduced using a pipeline coded in Interactive Data Language (IDL)2 The images were flat-fielded. Cosmic rays were removed using the L.A. Cosmic algorithm (van Dokkum 2001). The 74 echelle orders were extracted using a boxcar extraction, and the instrumental background computed on both sides of the spectral trace was subtracted. As CHIRON is fiber-fed there is no simple method to subtract the sky. The fibers have a diameter of 2.7 arcsec on the sky. In any event, for bright targets the night sky emission is generally negligible, apart from narrow [OI] and NaI D lines and some OH airglow lines at longer wavelengths. Wavelength calibration uses ThAr calibration lamp exposures at the start and end of the night.
The instrumental response is removed from the individual orders by dividing by the spectra of a flux-standard star, μ Col. This provides flux-calibrated orders with a systemic uncertainty due to sky conditions. Individual orders are spliced together, resulting in a calibrated spectrum from 4083–8900 Å, with five inter-order gaps in the coverage longward of 8260 Å. Contemporaneous BVRI photometry from Table 1 was used to scale the spectra to approximately true fluxes.
2.3. Swift UVOT and XRT
A series of higher-energy observations of V5856 Sgr were acquired with the Swift satellite (Gehrels et al. 2004). The pointings were carried out in target-of-opportunity mode; these observations are generally limited to roughly 2000 s per visit, and four of them were performed on the source with nearly monthly cadence between August and November 2021. A final fifth observation was acquired in April 2022. The dates and start times are reported in Table 3.
Log of the Swift/UVOT observations of V5856 Sgr. Flux densities are in units of 10−15 erg cm−2 s−1 Å−1.
The Swift observations were acquired with the onboard instruments X-Ray Telescope (XRT; Burrows et al. 2005) and UltraViolet Optical Telescope (UVOT; Roming et al. 2005). The XRT allows coverage of the X-ray band between 0.3 and 10 keV, whereas UVOT data were collected using the UV filters UVW1, UVM2, and UVW2, with reference wavelengths 2600 Å, 2246 Å, and 1928 Å, respectively (see Poole et al. 2008; Breeveld et al. 2011, for details). On-source pointings were simultaneously performed with the two instruments and lasted between ∼1000 and ∼1800 s for XRT, whereas exposures between 101 and 629 s were used for the three UVOT filters, depending on the observation. All data were reduced within the FTOOLS environment (Blackburn 1995).
Count rates on Level 2 (i.e., calibrated and containing astrometric information) UVOT images of V5856 Sgr were measured through aperture photometry within a 5″ radius centered on the source position, whereas the corresponding background was evaluated for each image using a combination of several circular regions in source-free nearby areas. The UV magnitudes of V5856 Sgr were determined with the UVOTSOURCE task. The data were then calibrated using the UVOT photometric system described by Poole et al. (2008); the most recent fixings (2020 November) recommended by the UVOT team were taken into account. The results of this analysis are listed in Table 3.
The XRT data analysis was performed using the XRTDAS standard pipeline package (XRTPIPELINE v. 0.13.4) in order to produce screened event files. All X-ray data were acquired in photon counting (PC) mode (Hill et al. 2004) adopting the standard grade filtering (0–12 for PC) according to the XRT nomenclature. Scientific data for V5856 Sgr were extracted from the images using a radius of 47″ (20 pixels) centered again at the optical coordinates of the source, while the corresponding background was evaluated in a source-free region of radius 94″ (40 pixels) within the same XRT acquisition. In each single case no emission was detected in the 0.3–10 keV range using the XSPEC package down to count rates between ∼5 × 10⁻³ and ∼8 × 10⁻³ counts s−1 (3σ limits). Nevertheless, by summing up the five XRT pointings, we could reach a 5σ detection of V5856 Sgr in the 0.3–10 skeV band at a rate of (4.7 ± 0.9) × 10−3 counts s−1, with the bulk of the emission (∼80% of the counts) concentrated in the 0.3–2 keV range. Due to the low overall signal-to-noise ratio of the summed XRT observation, no further detailed spectral analysis was performed.
We then determined the corresponding X-ray flux using the WEBPIMMS online tool3 by assuming a thermal bremsstrahlung emission with temperature kT = 1 keV plus an intervening hydrogen column density absorption NH = 1.8 × 1021 cm−2 (obtained adopting the interstellar reddening EB − V = 0.32 derived in Sect. 3 combined with the empirical formula of Predehl & Schmitt (1995). This implies a count rate-to-flux conversion factor of 2.4 × 10⁻¹¹ erg cm−2 s−1 counts−1; the count rate reported above thus corresponds to absorbed and unabsorbed fluxes of (1.1 ± 0.2) × 10−13 erg cm−2 s−1 and (1.9 ± 0.4) × 10−13 erg cm−2 s−1, respectively, for the assumed spectral model.
3. Post-outburst evolution
3.1. A halted decline and the 2018-2022 plateau
The overall light curve of V5856 Sgr since its outburst in late 2016 is presented in Fig. 1. It was prepared with data from Munari et al. (2017) for the main 2016 outburst, from this paper for 2021 and 2022, and from ASASSN for the interval in between (Shappee et al. 2014; Kochanek et al. 2017). The quiescence level is taken from Mroz et al. (2016), who inspected the OGLE-IV deep template images and set an upper limit of I > 22 mag to the brightness of the progenitor in quiescence.
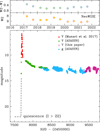 |
Fig. 1. Complete optical light curve of V5856 Sgr since its nova eruption in 2016. Top panel: infrared magnitudes from NeoWISE all-sky survey. |
After a slower-than-expected early decline in 2017, since 2018 the nova has not declined further, levelling out on a plateau, at median brightness I = 12.05, which is ΔI ≥ 10 mag above the quiescence level. A halted decline is rather unusual among novae, and it is generally attributed to protracted nuclear burning on the surface of the WD, as for V723 Cas = Nova Cas 1995 (e.g., Ochner et al. 2015; Goranskij et al. 2015; Ness et al. 2015; Hamilton-Drager et al. 2018). In their morphological grouping of nova light curves, Strope et al. (2010) defined a heterogeneous P class as composed of objects showing a temporary flattening of their declines, lasting 15–500 days (median value ∼70 day; interestingly, the group does not include V723 Cas). While probably related to some members of the P class, the timescale of the V5856 Sgr plateau is at least one order of magnitude longer.
The photometric stability of V5856 Sgr during the plateau extends to the near-IR as well. In Fig. 1 we plot the results gathered by the NeoWISE mission during its all-sky scanning, which revisits the position of V5856 Sgr twice a year (March and September). NeoWISE (Mainzer et al. 2011, 2014) refers to the data the WISE satellite is collecting in the W1 (3.4 μm) and W2 (4.6 μm) bands since it was brought out of hibernation and resumed observation in 2014, after the conclusion of the 2009–2010 cryogenic phase that also observed in the W3 (12 μm) and W4 (22 μm) bands (Cutri et al. 2021). During the 2018–2022 plateau, V5856 Sgr fluctuated by σ(W1) = 0.25 mag around the mean value ⟨W1⟩ = 9.36 mag, and by σ(W1 − W2) = 0.06 mag around the mean color ⟨W1 − W2⟩= + 0.59 mag.
The spectral appearance of V5856 Sgr during the plateau is shown in Fig. 2. Prominent Balmer and HeI emission lines are superimposed on a strong and featureless continuum, in particular around the expected position for any Balmer discontinuity. Intense [OIII], [NII], and [OII] nebular lines are present, the corresponding strong auroral transitions suggesting high electron densities, too high for the original nova ejecta after several years of undisturbed expansion. All lines are resolved at a FWHM ∼ 1000 km s−1, but with differences from line to line (see Sect. 6 below). The ionization degree is relatively low, with just a weak HeII 4686 visible in emission; the criteria outlined by Murset & Nussbaumer (1994) suggest Teff = 5 × 10⁴ K for the temperature of the photoionizing source.
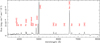 |
Fig. 2. Spectrum of V5856 Sgr obtained on 2021 August 9 with the Asiago 1.22m + B&C telescope. The strongest emission lines are identified. |
Superimposed on a stable mean brightness during the plateau, V5856 Sgr presents some variability of limited amplitude, rather erratic in nature, with the exception of 2019 when the nova displayed a persistent oscillation superimposed on a mildly declining pattern, as illustrated in Fig. 3. We have carried out a Fourier analysis of the data in Fig. 3, which returned a low-significance periodicity of ∼15 days. In the lower panel of Fig. 3 we overplot on the observations a sinusoid with a 15-day period and 0.25 mag semi-amplitude; the sinusoid is followed by the data rather closely for only a few cycles at a time, and then the correlation is lost.
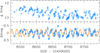 |
Fig. 3. Portion of 2019 light curve of V5856 Sgr from Fig. 1. Top panel: original ASASSN data in the g band. Bottom panel: same data after detrending and with a superimposed sinusoid of 15-day period and 0.25 mag amplitude. |
3.2. Multicolor evolution in 2021–2022
After we called attention to its halted decline (Munari et al. 2021a,b), we started a daily BVRI monitoring of V5856 Sgr. The resulting light curves and color curves are presented in Fig. 4, where the gap from late 2021 November to early 2022 February corresponds to the solar conjunction.
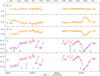 |
Fig. 4. Light curves and color curves of V5856 Sgr in 2021–22 from Table 1. The epochs of Swift and CHIRON observations are flagged by arrows in the bottom panels. |
The photometric behavior of V5856 Sgr in Fig. 4 is quite erratic: flat and smooth in 2021 July and September, separated by a sudden jump in August; the emergence of pronounced oscillations in 2021 October and November, which continued through 2022 February, March, and April. The timescale of the oscillations observed in 2021–22 is ∼17 days, similar to the 15-day pseudo-periodicity observed in 2019, where the brightness levels of the nova at both epochs are similar.
For the origin of this pseudo-periodicity, an orbital modulation seems unlikely given its seldom and sudden appearance and the many superimposed irregularities. In addition, such a long orbital period would imply an evolved and consequently bright companion to the WD, which sharply contrasts with the very large amplitude of the outburst and the nondetection by 2MASS in quiescence (Cutri et al. 2003). The presence of an evolved companion also contrasts with the absence of early nonthermal radio and X-ray emission (Chomiuk et al. 2021; Gordon et al. 2021), which is instead regularly observed in novae erupting within symbiotic binaries (e.g., Giroletti et al. 2020; Page et al. 2022), where the material fed to the circumstellar space by the evolved companion is violently impacted by the fast nova ejecta. Some kind of (radial) pulsation in the envelope could perhaps be a viable explanation; however, V5856 Sgr lies at a distance from the period–luminosity relation for normal pulsating stars (Groenewegen 2018), and also its position on the HR is away from the instability strip. At the large dimension derived below in Sect. 5.1 (∼25 R⊙), it is quite possible that the swollen shell of the burning WD engulfs the companion, and some instability driven by such a common-envelope arrangement may contribute to the observed 15–17-day pseudo-periodicity.
3.3. Deep minimum of 2022 May
The most prominent event of the 2021–2022 light curve in Fig. 4 is the deep minimum (DM) and the subsequent recovery that V5856 Sgr exhibited around 2022 May. The photometric colors changed markedly during the DM, following an intriguing pattern: while completely flat in R − I, the variations in B − V were large and specular to those affecting V − R, clearly indicating that the V band is the culprit in the observed changes of the colors. A similar behavior also characterizes the photometry for 2021 in Fig. 4, although with proportionally smaller changes in the colors.
In their analysis of color behavior in novae, Munari et al. (2013, cf. Nova Mon 2012 in their Fig. 1) noted how the V band is highly responsive to the flux emitted in [OIII] 4959+5007, which can account for ≥0.5 mag of the whole flux recorded through the V passband when the optical spectra are dominated by [OIII], as it is the case for the V5856 Sgr (see Fig. 2). The median magnitudes and colors of V5856 Sgr in the months leading up to DM (February through April 2022) were V = 12.721, B − V = +0.577, V − R = +0.439, and R − I = +0.255. The passage at minimum V-band brightness occurred around May 7.0 UT at V = 13.508 (see Table 1), but the extrema in the colors were reached only a week later around May 14.5 UT at B − V = +0.942 and V − R = +0.074. The blueing of V − R by 0.365 mag and the reddening of B − V by an identical 0.365 mag points to a large strengthening of [OIII] 4959+5007 relative to the underlying continuum.
By a lucky coincidence, we have CHIRON spectra of V5856 Sgr for 2022 April 25 and June 8, which correspond to immediately before and soon after the changes in colors, and for May 15 when colors deviated the most. The fluxed profiles of [OIII] 5007 from these three CHIRON spectra is presented in the top left panel of Fig. 5, and confirms the suspected increase in the flux of [OIII] 4959+5007 at the time of maximum color change.
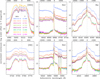 |
Fig. 5. High-resolution profiles of selected emission lines from the CHIRON spectra of V5856 Sgr listed in Table 2. The logarithm of the continuum-normalized spectrum is plotted with an offset equal to the V-band magnitude of the nova for that date (see legend in top left panel). The abscissae at the top are velocities in km s−1 with respect to the laboratory wavelength. |
There may be more behind the DM, however. Its shape in brightness is not replicated by the variation of the colors in Fig. 4, and the light minimum and color extrema are out of phase by approximately ten days. The other minima in Fig. 4, like those occurring during October and November 2021, changed colors proportionally much less than the DM, and these changes were in the same direction for all colors, not specular as during the DM. It seems that the spectroscopic changes (surge in intensity of [OIII]) that drove the color changes happened by chance at the same time of the photometric DM deep minimum, but the two events may actually be unrelated.
4. Reddening
Of critical relevance to the determination of the radiated luminosity is a robust knowledge of the interstellar reddening affecting V5856 Sgr, which appears fairly well constrained to:
 (1)
(1)
by the converging results of the independent methods outlined below.
4.1. Photometric properties of the main outburst
Reddening determination from optical photometric colors during the main 2016 outburst of V5856 Sgr were thoroughly investigated by Munari et al. (2017): the average value from four different photometric criteria is EB − V = 0.30 ± 0.05.
4.2. Three-dimensional dust maps
V5856 Sgr is located within a few degrees of the direction to the Galactic center, at a distance of 6.4–7.0 kpc, following Munari et al. (2017), for which the 3D reddening maps of Schlegel et al. (1998) and Schlafly & Finkbeiner (2011) provide EB − V = 0.35 and 0.31, respectively.
4.3. Interstellar atomic lines
The CHIRON spectra of V5856 Sgr were examined for the presence of NaI 5890, 5896 and KI 7699 lines of interstellar origin. To increase the S/N, we first continuum-normalized all CHIRON spectra listed in Table 2 and then averaged them to produce Fig. 6, which also shows a broad component in the NaI lines (highly variable among different spectra, see the bottom central panel of Fig. 5), which we attribute to a low-velocity wind component, discussed below in Sect. 6.
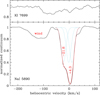 |
Fig. 6. Region around NaI 5890 and KI 7699 from averaged CHIRON spectra listed in Table 2. The interstellar components at −21.8 and +4.3 km s−1 velocity are indicated, as is their decovolution (discussed in Sect. 4.3). The broad absorption labeled “wind” is variable from spectrum to spectrum. |
The interstellar NaI in Fig. 6 present at least two clearly separated components centered at heliocentric velocities −21.8 and +4.3 km s−1, respectively 0.287 and 0.590 Å in equivalent width. A Gaussian deconvolution shows the +4.3 km s−1 to be almost two times broader than the −21.8 km s−1 component (36 vs. 22 km s−1 in FWHM), suggesting it is the blend of two unresolved components of probably similar intensity, albeit shifted in velocity. Taking the −21.8 km s−1 component as the profile of an unblended interstellar line, we deconvolved the blend at +4.3 km s−1 into two components of equal intensity. The three resulting interstellar components are then plotted as dotted lines in Fig. 6, and their sum is compared to the observed profile, providing a nearly perfect match. Their heliocentric velocities and equivalent widths are −21.8, −1.8, and +11.0 km s−1, and 0.287, 0.295, and 0.295 Å, respectively. Applying to their equivalent widths the calibration of Munari & Zwitter (1997), we find the corresponding EB − V = 0.107, 0.111, and 0.111 reddening values, for a total  . Quantifying its uncertainty is difficult in view of the arbitrary splitting of the +4.3 km s−1 blend into two components of equal intensity and the nonlinear relation between equivalent width and reddening. Any gross deviation from equal intensity, however, would have manifested in a nonsymmetrical profile for their blend, contrary to the observed profile. For these reasons we conservatively estimate the error to be ±0.06.
The KI 7699 profile for V5856 Sgr in Fig. 6 is rather noisy and perturbed by the telluric absorptions, which are quite strong in this spectral region (and wander around when adding spectra in heliocentric velocity), and probably also by a wind component that seems to be at a lower velocity than for NaI. Nonetheless, the KI 7699 profile in Fig. 6 confirms that the +4.3 km s−1 component seen in NaI must be the result of the blending of weaker individual components. Following the analysis in Munari & Zwitter (1997), if the +4.3 km s−1 component is a single line and not the result of a blend, its large 0.590 Å equivalent width indicates line-core saturation, resulting in EB − V ≥ 0.55. At such high reddening the equivalent width of KI 7699 is ≥0.14 Å, and the corresponding line would stand out clearly in Fig. 6, contrary to evidence. If the NaI component at +4.3 km s−1 is instead the blend of two weaker lines, as derived above the corresponding equivalent width of KI 7699 blend would be only ∼0.06 Å, a level similar to the noise affecting the spectrum of Fig. 6.
4.4. Ultraviolet 2175 Å hump
The interstellar extinction curve is characterized by the presence of a broad hump centered around 2175 Å. The UVM2 photometric band of the Swift UVOT telescope includes this hump in its profile, and it is therefore sensitive to the amount of reddening. Adopting the interstellar extinction curve of Fitzpatrick (1999), to make the spectral energy distribution of V5856 Sgr run smoothly through the three UVOT bands in Fig. 7 requires dereddening by EB − V = 0.30. A definition of a formal error is not trivial considering that the details of the interstellar extinction curve may depend on the given sightline and the loose definition about a smooth behavior for the spectral energy distribution of V5856 Sgr through the three UVOT bands. A change of ±0.05 to EB − V = 0.30, however, would be perceived by the eye as breaking such a smooth appearance.
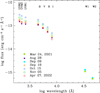 |
Fig. 7. Reddening-corrected spectral energy distribution of V5856 Sgr at the epochs of the five Swift observations (see Sect. 5 for details). |
5. Spectral energy distribution and energetics
The spectral energy distributions of V5856 Sgr on the five dates with a Swift-UVOT observation is presented in Fig. 7. They are built combining the ultraviolet fluxes in Table 3 with BVRI photometry for the same dates from Table 1 and the NeoWISE observations of 2021 (centered on March 24 and September 9), and are reddening-corrected for EB − V = 0.32.
Munari et al. (2017) estimated a large distance to V5856 Sgr, 6.4–7.0 kpc, from the photometric properties of the outburst; the position on the sky of the nova (l = 004.29°, b = −06.46°) suggests a partnership with the Galactic Bulge; the Galactic reddening map of Green et al. (2019) returns a lower limit of 5 kpc to V5856 Sgr, and that of Chen et al. (2019) a distance ∼8 kpc; finally, the apparent underluminosity at radio wavelengths (Chomiuk et al. 2021) and the lack of detection in X-rays during the outburst (Gordon et al. 2021) both call for a large distance to V5856 Sgr (> 6 kpc). For these reasons we assume for the nova the same distance as the Galactic Bulge, 8.5 kpc, and scale the resulting energetics to it.
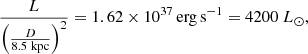
Integrating the flux of the distributions in Fig. 7 over the 0.16–4.6 μm interval covered by observations results in the following luminosities:
![Mathematical equation: $$ \begin{aligned} \frac{L_{(0.16{-}4.6\,\upmu \mathrm{m})}}{\left( \frac{D}{8.5 \ \mathrm{kpc}} \right)^2}&= 6.74\times 10^{36}\,\mathrm{erg\,s^{-1}} = 1740\ L_\odot \ [2021\,\mathrm{Aug}\,28] \nonumber \\&\quad 7.20\times 10^{36}\,\mathrm{erg\,s^{-1}} = 1865\ L_\odot \ [2021\,\mathrm{Sep}\,18] \nonumber \\&\quad 1.14\times 10^{37}\,\mathrm{erg\,s^{-1}} = 2950\ L_\odot \ [2021\,\mathrm{Oct}\,15] \nonumber \\&\quad 8.18\times 10^{36}\,\mathrm{erg\,s^{-1}} = 2120\ L_\odot \ [2021\,\mathrm{Nov}\,05] \nonumber \\&\quad 7.45\times 10^{36}\,\mathrm{erg\,s^{-1}} = 1925\ L_\odot \ [2022\,\mathrm{Apr}\,27] \end{aligned} $$](/articles/aa/full_html/2022/11/aa44498-22/aa44498-22-eq3.gif) (2)
(2)
for an average of L = 2120 L⊙. These are lower limits to the actual values considering that the maximum is located at shorter wavelengths than covered by the UVOT observations.
To better constrain the actual luminosity radiated by V5856 Sgr, in Fig. 8 we fitted with blackbodies the two distributions that in Fig. 7 are characterized by the brightest (2021 August 28) and the faintest (2021 October 15) fluxes recorded by UVOT. A combination of three blackbodies were considered, one for the main component dominating at optical wavelengths and the other two to cover the UV and near-IR excesses. A combination of blackbodies clearly underrepresents the true shape of the SED; however, we are only interested in an approximate value for the bolometric luminosity. A more sophisticated modeling of the three components would require a much greater number of parameters than the only nine photometric values available to sample the SED.
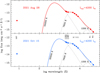 |
Fig. 8. Fit with three blackbodies to the brightest and the faintest of the reddening-corrected spectral energy distributions in Fig. 7. |
An initial unconstrained run returned a total radiated luminosity of ∼4100 L⊙ for 2021 August 28, and ∼4300 L⊙ for 2021 October 15. Considering that a WD in stable nuclear burning conditions is expected to radiate at constant luminosity (Paczyński 1971), we imposed the condition that the sum of the luminosities of the three fitted blackbodies is the same at both epochs, and equal to the mean of the above two unconstrained fits:
 (3)
(3)
which corresponds to the hydrogen burning of material of solar composition at a rate of:
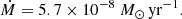 (4)
(4)
The total luminosity of the burning shell is thought to be well represented by the core–mass-luminosity relation of Paczyński (1971):
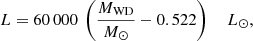 (5)
(5)
which returns a mass of 0.6 M⊙ for the WD in V5856 Sgr, in good agreement with more recent investigations on steady H-burning at the surface of a WD by, among others, Nomoto et al. (2007), Shen & Bildsten (2007), and Wolf et al. (2013). A low-mass WD is also favored by the low expansion velocity of the ejecta observed at the time of the nova eruption (cf. Warner 1995 and references therein).
If L = 4200 L⊙ has remained constant during the 2018.0–2022.5 plateau, the total amount of radiated energy during this period is:
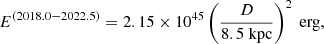 (6)
(6)
which corresponds to the hydrogen burning of 2.4 × 10⁻⁷ M⊙ of material of solar composition. This is a small quantity of material to be retained by the WD on its surface compared to the amount of mass ejected in a nova outburst, which is generally estimated in the 10−4 to 10−6 M⊙ range (Gehrz et al. 1998).
Some comments are now in order about the three components of the SED fitting in Fig. 8.
5.1. Main component
The main component to the SED decovolution in Fig. 8 is a 7600 K blackbody, fitting both data sets similarly well (within ±200 K). Its luminosity is 1325 L⊙ on 2021 August 28 and 2030 L⊙ on 2021 October 15. The corresponding radii are 21 and 26 R⊙. The temperature and dimensions roughly match those of an F0 II/Ib bright giant. We identify this main component as the shell of the WD inflated by the stable nuclear burning at its base. As we discuss in Sect. 6, a constant wind is blowing off this shell, which the observations indicate produces an effective photosphere for the visible-IR radiation.
5.2. Hot component
The temperature of the hotter component in Fig. 8 varies from 3× to 5.5 × 10⁴ K, in good agreement with the estimate from the spectral appearance of V5856 Sgr in Fig. 2, following Murset & Nussbaumer (1994). The hot component varies in anti-phase with the main component at 7600 K, as if some reprocessing may be at play from the hot to the main component. The luminosity and radius of the hot component are 2825 L⊙ and 0.6 R⊙ on 2021 August 28, and 2120 L⊙ and 1.7 R⊙ on 2021 October 15. Given the low temperature of the main component, the emission lines observed in V5856 Sgr appear powered by the hot component. Its location within V5856 Sgr is uncertain, but it could be related to the polar regions of WD shell, from where the faster wind discussed in Sect. 6 below probably originates.
5.3. Dust
The same set of NeoWISE observations for 2021 September 9 was included in the fit to both dates in Fig. 8 as the closest in time to the optical and UVOT data. The resulting 1200 K blackbody probably traces emission originating from warm circumstellar dust and radiates LIR ∼ 52 L⊙, for a blackbody radius of 165 R⊙, which is widely external to the main and hot components. The dust, however, could be located at greater radii if, instead of being arranged spherically, it formed in the equatorial belt discussed in Sect. 7.
The infrared data available for V5856 Sgr do not allow the physical properties of the dust to be constrained. For the sake of discussion, we can assume that the dust grains condensing in V5856 Sgr follow the mean properties observed in other novae (Gehrz 1988; Mason et al. 1996; Evans et al. 1997; Gehrz et al. 1998), meaning that they are small carbon grains (radius a ≤ 1 μm, density ρ ∼ 2.3 gr cm−3), for which the Planck mean emission cross section goes as 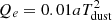 . Under these assumptions, the mass of the radiating dust in V5856 Sgr can be estimated as:
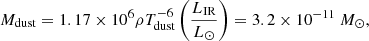 (7)
(7)
which is rather low and unable to contribute to the reddening affecting V5856 Sgr.
The remarkable stability of the NeoWISE W1, W2 light curve in Fig. 1 suggests that the dust responsible for the infrared excess cannot be associated with the expanding ejecta of the initial outburst, bound to cool and fall into oblivion as they disperse into the surrounding void (Gehrz 1990). New dust must instead be forming regularly in the wind constantly blowing off the central star. The high Tdust ∼ 1200 K temperature indicates that the dust grains condense close to the central star, as close as is allowed by their sublimation temperature. As discussed in Sect. 6, V5856 Sgr loses mass via winds at different velocities, and the shock interface where they collide could also be a suitable environment for dust condensation (e.g., Derdzinski et al. 2017).
5.4. The X-ray component
The 3–5.5 × 10⁴ K temperature of the hot component in Fig. 8 cannot account for the X-ray flux recorded by Swift, which amounts to LX = 0.56 L⊙ over the 0.3–10 keV range for an unabsorbed bremsstrahlung temperature of kT = 1.0 keV (value averaged over the five pointings by Swift). This X-ray component probably forms in the outflow from the central star. Unfortunately, there are not enough collected X-ray photons to attempt any spectral modeling, for example to quantify the contribution of the super-soft emission associated with the nuclear burning, which is expected to be heavily absorbed from within the WD inflated shell.
6. Complex wind outflow
The gravity at the surface of the Teff = 7600 K, R = 21 − 26 R⊙ main component in Fig. 8 is probably rather low, log g ∼ 1.4–1.8, depending on the total mass of the WD and its orbiting companion, surely much lower than log g ∼ 2.5 characterizing a normal F0 II/Ib bright giant (Straizys & Kuriliene 1981). From the Reimers (1977) expression for mass loss, a wind is expected to blow off the main component at a rate (L, R, and M in solar units):
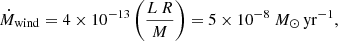 (8)
(8)
similar to the rate at which hydrogen is burnt in the shell of the WD (cf. Eq. (4)). Therefore, the mass in the WD shell available to sustain hydrogen burning reduces at a rate ≈1 × 10⁻⁷ M⊙ yr−1.
The spectra of V5856 Sgr during the plateau indeed provide evidence for a sustained wind blowing off the central star, as illustrated by the high-resolution profiles for selected emission lines in Fig. 5. The spectra in this figure are plotted according to the brightness of V5856 Sgr in the V band, and clearly show how the profile displayed by the emission lines is dependent on the system brightness, the dividing line being V ∼ 13.0 mag.
When the system is fainter than that (observing epochs 2021 June 29, 2022 May 15, and 2021 July 30 or the lowest three profiles in each panel of Fig. 5), the profiles are dominated by a trapezoidal pedestal with a full width at zero intensity (FWZI) ∼ 1600 km s−1, similarly present for both permitted and forbidden transitions. When V5856 Sgr turns brighter than V = 13.0 mag, a broader and boxier FWZI ∼ 3400 km s−1 pedestal adds to the profile of permitted lines, but not to that of forbidden lines. Hα is the strongest permitted line in the optical spectra of V5856 Sgr, and it shows the FWZI ∼ 3400 km s−1 component at all epochs, even if it is weaker when the nova is fainter than V = 13.0 mag. So, it seems appropriate to say that the FWZI ∼ 3400 km s−1 pedestal reinforces when the system is bright, turning visible also for permitted lines much weaker than Hα. The integrated absolute flux of the FWZI ∼ 1600 km s−1 pedestal appears to decrease with the system brightness, the reverse holding true for the FWZI ∼ 3400 km s−1 component.
The V = 13.0 mag threshold also drives another striking difference in Fig. 5, this one affecting the HeI lines. When V5856 Sgr is fainter the FWZI ∼ 1600 km s−1 looks symmetric, for both triplet (5876 Ang) and singlet (6678) lines, but when the system turns brighter, its blue half goes missing, and the same also happens to the FWZI ∼ 3400 km s−1 component. It looks as if they get chewed up by a wide P Cyg absorption. At the same time, a P Cyg minimum at about −250 km s−1 appears in HeI 6678, without much of a counterpart in HeI 5876.
Superimposed on the broad and two-component pedestal, the permitted lines show a sharp peak flanked by one or two low-velocity absorption components, as illustrated by Fig. 9 that zooms in on the core of the same profiles presented in Fig. 5. A similar peak is not presented by nebular emission lines. The heliocentric radial velocity and width of the narrow emission peak are 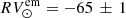 km s−1 and FWHM ∼ 650 km s−1, respectively. The absorptions to the blue of the emission peak are rather variable from line to line and epoch to epoch, with no obvious relation with the V = 13.0 mag threshold affecting the two pedestals. For HeI 5876, Hβ and Hα the main absorption is positioned around −150 km s−1, a value similar to that displayed by NaI in Fig. 6.
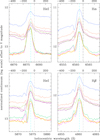 |
Fig. 9. Zoomed-in view from Fig. 5 of the central peak displayed by permitted emission lines. The abscissae at the top are velocities in km s−1 with respect to laboratory wavelength (dot-dashed vertical lines). The dashed vertical line is the −65 km s−1 velocity discussed in Sect. 6. |
In addition to the FWZI ∼ 1600 km s−1 and FWZI ∼ 3400 pedestals and the FWHM ∼ 650 km s−1 narrow peak, there is a fourth velocity component in V5856 Sgr, the one displayed by FeII emission lines, which is characterized by a narrow and double-peaked profile with a velocity separation Δv ∼ 65 km s−1, clearly illustrated by FeII 6516 (multiplet 40) in the Hα panel in Fig. 5. The intensity, width, and velocity separation of the double-peak FeII line profiles do not change in a noticeable way with the date or the brightness of V5856 Sgr, and therefore no V = 13.0 mag threshold apply to them. The velocity in the Δv ∼ 65 km s−1 component is well below the vesc ∼ 125 km s−1 escape velocity for the surface of the ∼25 R⊙ inflated shell of the WD.
Summing up, during its current plateau V5856 Sgr has been losing a sizeable mount of mass via wind, which is organized in multiple emission components, neatly segregated on kinematical grounds: FWZI ∼ 3400, FWZI ∼ 1600 km s−1, and FWHM ∼ 650 km s−1. Wind absorptions are equally present, for example the high-velocity mutilations to the HeI profile when the system is brighter than 13 mag, and the components at −250 and −150 km s−1.
7. Conclusions
The observations we collected and discussed show that V5856 Sgr, six years past its nova outburst in 2016, remains bright, having spent the last 4.5 yrs at an average I = 12.05 mag, which is only ΔI = 6.5 mag down from the maximum and still ΔI ≥ 10 mag brighter than quiescence. During the current plateau, it is radiating a luminosity L ∼ 4200 L⊙, consistent with stable nuclear burning on a WD of 0.6 M⊙. V5856 Sgr is the source of a strong wind, which is structured into three distinct and variable emission components with FWZI ∼ 3400, FWZI ∼ 1600, and FWHM ∼ 650. The pseudo-photosphere dominating at optical wavelengths has Teff ∼ 7600 K and R ∼ 25 R⊙, widely engulfing the binary system within. The mass in the WD shell available to sustain hydrogen burning reduces at a rate ≈1 × 10⁻⁷ M⊙ yr−1, while dust at Tdust ∼ 1200 K and L ∼ 52 L⊙ keeps forming in the outflow. The WD shell can either be remnant material after the nova eruption or can originate from enhanced mass-transfer from an irradiated swollen secondary.
Blowing off the wind requires mechanical work. The ratio of the fluxes radiated in the three components is 10%:60%:30% for FWHM = 650, FWZI = 1600, and FWZI = 3400 km s−1, respectively, as average values for Hα over spectra in Fig. 5. Applying these proportions to the mass of the wind in Eq. (8), the corresponding energy going into blowing the wind is:
 (9)
(9)
which is negligible with respect to the amount of radiated energy in Eq. (3).
Given these mass ratios, it may be surprising that no counterpart of the faster FWZI ∼ 3400 km s−1 wind is visible in the profiles of nebular lines in Fig. 5, which are dominated by the FWZI ∼ 1600 km s−1 component. There are some possible reasons for this: (a) the FWZI ∼ 3400 km s−1 wind may be slowed down by the FWZI ∼ 1600 km s−1 material before it reaches the outer radii where the electronic density is low enough for the formation of nebular lines, and the X-ray emission recorded by Swift could originate from these colliding winds (Muerset et al. 1997; Luna et al. 2013), and/or (b) the FWZI ∼ 3400 km s−1 material is ejected only episodically, and it needs the right time interval to travel to the outer radii where the electron density drops below the critical value for collisional de-excitation, and thus detecting the FWZI ∼ 3400 km s−1 material in the profile of nebular lines could be a matter of observing at the right time after such an ejection.
The profiles of permitted emission lines in V5856 Sgr are similar to those in V2672 Oph (Nova Oph 2009), which were morphokinematically modelled by Munari et al. (2011) with three components tracing an equatorial belt, polar caps for fast bipolar ejection, and a prolate component for the primary outflow. By analogy, we infer that the FWZI ∼ 1600 km s−1 pedestal, stable over time and shown by all lines, traces the steady wind blowing off the shell of the WD in a kind of spherically symmetric spatial arrangement. The FWZI ∼ 3400 km s−1 broader components could relate instead to an episodic bipolar wind, blown off preferentially along the polar directions, implying that we are looking at V5856 Sgr from an orientation that is closer to pole-on than edge-on. Finally, the narrow emission peak traces material laying on the equatorial plane, characterized by an electron density that is too high to allow the formation of nebular lines. The variable and low-velocity absorption components, blueshifted by about −85 ± 1 km s−1 from the narrow emission peak, may form in a gentle mass-loss from the equatorial belt.
The inferred approximately pole-on orientation of V5856 Sgr seems to add to the already rich assortment of oddities displayed by this nova. From the decline-time versus the outburst amplitude of novae derived by Warner (1995, Fig. 5.4 in the book), the amplitude expected for the log(t2) = 0.9 decline-time derived by Munari et al. (2017) for V5856 Sgr is Δm = 12 mag. The observed ΔI ≥ 16.4 mag is much larger, surely one of the largest on record. Increasing the orbital inclination toward edge-on conditions (albeit in contrast with the spectral line profiles) would widen the outburst amplitude up to Δm = 15 mag, still appreciably short of the observed value.
V5856 Sgr is clearly a nova of many peculiarities, which surely deserves deeper investigations of its main outburst and a continued monitoring of the protracted plateau phase in which it is currently trapped.
IRAF is distributed by the National Optical Astronomy Observatories, which are operated by the Association of Universities for Research in Astronomy, Inc., under cooperative agreement with the National Science Foundation.
Acknowledgments
We thank the referee for useful comments. N.M. acknowledges financial support through ASI-INAF agreement 2017-14-H.0 (PI: T. Belloni). F.M.W. acknowledges support from NSF grant AST-1614113. This publication makes use of data products from the Near-Earth Object Wide-field Infrared Survey Explorer (NEOWISE), which is a joint project of the Jet Propulsion Laboratory/California Institute of Technology and the University of Arizona. NEOWISE is funded by the National Aeronautics and Space Administration.
References
- Blackburn, J. K. 1995, in Astronomical Data Analysis Software and Systems IV, eds. R. A. Shaw, H. E. Payne, & J. J. E. Hayes, ASP Conf. Ser., 77, 367 [Google Scholar]
- Breeveld, A. A., Landsman, W., Holland, S. T., et al. 2011, in Gamma Ray Bursts 2010, eds. J. E. McEnery, J. L. Racusin, & N. Gehrels, Am. Inst. Phys. Conf. Ser., 1358, 373 [Google Scholar]
- Burrows, D. N., Hill, J. E., Nousek, J. A., et al. 2005, Space Sci. Rev., 120, 165 [Google Scholar]
- Chen, B. Q., Huang, Y., Yuan, H. B., et al. 2019, MNRAS, 483, 4277 [Google Scholar]
- Chomiuk, L., Linford, J. D., Aydi, E., et al. 2021, ApJS, 257, 49 [NASA ADS] [CrossRef] [Google Scholar]
- Cutri, R. M., Skrutskie, M. F., van Dyk, S., et al. 2003, VizieR Online Data Catalog: II/246 [Google Scholar]
- Cutri, R. M., Wright, E. L., Conrow, T., et al. 2021, VizieR Online Data Catalog: II/328 [Google Scholar]
- Derdzinski, A. M., Metzger, B. D., & Lazzati, D. 2017, MNRAS, 469, 1314 [NASA ADS] [CrossRef] [Google Scholar]
- Evans, A., Geballe, T. R., Rawlings, J. M. C., Eyres, S. P. S., & Davies, J. K. 1997, MNRAS, 292, 192 [NASA ADS] [CrossRef] [Google Scholar]
- Fitzpatrick, E. L. 1999, PASP, 111, 63 [Google Scholar]
- Gehrels, N., Chincarini, G., Giommi, P., et al. 2004, ApJ, 611, 1005 [Google Scholar]
- Gehrz, R. D. 1988, ARA&A, 26, 377 [NASA ADS] [CrossRef] [Google Scholar]
- Gehrz, R. D. 1990, in IAU Colloq. 122: Physics of Classical Novae, eds. A. Cassatella, & R. Viotti (Berlin: Springer-Verlag), 369, 138 [NASA ADS] [CrossRef] [Google Scholar]
- Gehrz, R. D., Truran, J. W., Williams, R. E., & Starrfield, S. 1998, PASP, 110, 3 [NASA ADS] [CrossRef] [Google Scholar]
- Giroletti, M., Munari, U., Körding, E., et al. 2020, A&A, 638, A130 [NASA ADS] [CrossRef] [EDP Sciences] [Google Scholar]
- Goranskij, V. P., Metlova, N. V., Zharova, A. V., Barsukova, E. A., & Valeev, A. F. 2015, ATel, 7985, 1 [NASA ADS] [Google Scholar]
- Gordon, A. C., Aydi, E., Page, K. L., et al. 2021, ApJ, 910, 134 [NASA ADS] [CrossRef] [Google Scholar]
- Green, G. M., Schlafly, E., Zucker, C., Speagle, J. S., & Finkbeiner, D. 2019, ApJ, 887, 93 [NASA ADS] [CrossRef] [Google Scholar]
- Groenewegen, M. A. T. 2018, A&A, 619, A8 [NASA ADS] [CrossRef] [EDP Sciences] [Google Scholar]
- Hamilton-Drager, C. M., Lane, R. I., Recine, K. A., et al. 2018, AJ, 155, 58 [NASA ADS] [CrossRef] [Google Scholar]
- Hill, J. E., Burrows, D. N., Nousek, J. A., et al. 2004, in X-Ray and Gamma-Ray Instrumentation for Astronomy XIII, eds. K. A. Flanagan, & O. H. W. Siegmund, SPIE Conf. Ser., 5165, 217 [NASA ADS] [CrossRef] [Google Scholar]
- Hjellming, R. M., Wade, C. M., Vandenberg, N. R., & Newell, R. T. 1979, AJ, 84, 1619 [NASA ADS] [CrossRef] [Google Scholar]
- Kochanek, C. S., Shappee, B. J., Stanek, K. Z., et al. 2017, PASP, 129, 104502 [Google Scholar]
- Landolt, A. U. 2009, AJ, 137, 4186 [Google Scholar]
- Li, K.-L. 2022, ApJ, 924, L17 [NASA ADS] [CrossRef] [Google Scholar]
- Li, K.-L., Chomiuk, L., & Strader, J. 2016a, ATel, 9736, 1 [NASA ADS] [Google Scholar]
- Li, K.-L., Chomiuk, L., Strader, J., et al. 2016b, ATel, 9771, 1 [NASA ADS] [Google Scholar]
- Li, K.-L., Metzger, B. D., Chomiuk, L., et al. 2017, Nat. Astron., 1, 697 [Google Scholar]
- Luckas, P. 2016, ATel, 9678, 1 [NASA ADS] [Google Scholar]
- Luna, G. J. M., Sokoloski, J. L., Mukai, K., & Nelson, T. 2013, A&A, 559, A6 [NASA ADS] [CrossRef] [EDP Sciences] [Google Scholar]
- Mainzer, A., Bauer, J., Grav, T., et al. 2011, ApJ, 731, 53 [Google Scholar]
- Mainzer, A., Bauer, J., Cutri, R. M., et al. 2014, ApJ, 792, 30 [Google Scholar]
- Mason, C. G., Gehrz, R. D., Woodward, C. E., et al. 1996, ApJ, 470, 577 [NASA ADS] [CrossRef] [Google Scholar]
- Mroz, P., Udalski, A., & Pietrukowicz, P. 2016, ATel, 9683, 1 [NASA ADS] [Google Scholar]
- Muerset, U., Wolff, B., & Jordan, S. 1997, A&A, 319, 201 [Google Scholar]
- Munari, U., & Zwitter, T. 1997, A&A, 318, 269 [NASA ADS] [Google Scholar]
- Munari, U., Ribeiro, V. A. R. M., Bode, M. F., & Saguner, T. 2011, MNRAS, 410, 525 [NASA ADS] [CrossRef] [Google Scholar]
- Munari, U., Dallaporta, S., Castellani, F., et al. 2013, MNRAS, 435, 771 [CrossRef] [Google Scholar]
- Munari, U., Hambsch, F. J., & Frigo, A. 2017, MNRAS, 469, 4341 [CrossRef] [Google Scholar]
- Munari, U., Masetti, N., Williams, F. M. W. R. E., Valisa, P., & Dallaporta, S. 2021a, ATel, 14884, 1 [NASA ADS] [Google Scholar]
- Munari, U., Williams, R., Valisa, P., & Dallaporta, S. 2021b, ATel, 14804, 1 [NASA ADS] [Google Scholar]
- Murset, U., & Nussbaumer, H. 1994, A&A, 282, 586 [Google Scholar]
- Nakano, S., Sakurai, Y., Schmeer, P., & Stanek, K. Z. 2017, IAU Circ., 9286, 1 [NASA ADS] [Google Scholar]
- Ness, J. U., Goranskij, V. P., Page, K. L., Osborne, J., & Schwarz, G. 2015, ATel, 8053, 1 [NASA ADS] [Google Scholar]
- Nomoto, K., Saio, H., Kato, M., & Hachisu, I. 2007, ApJ, 663, 1269 [Google Scholar]
- Ochner, P., Moschini, F., Munari, U., & Frigo, A. 2015, MNRAS, 454, 123 [NASA ADS] [CrossRef] [Google Scholar]
- Paczyński, B. 1971, Acta Astron., 21, 417 [NASA ADS] [Google Scholar]
- Page, K. L., Beardmore, A. P., Osborne, J. P., et al. 2022, MNRAS, 514, 1557 [NASA ADS] [CrossRef] [Google Scholar]
- Poole, T. S., Breeveld, A. A., Page, M. J., et al. 2008, MNRAS, 383, 627 [Google Scholar]
- Predehl, P., & Schmitt, J. H. M. M. 1995, A&A, 293, 889 [NASA ADS] [Google Scholar]
- Reimers, D. 1977, A&A, 61, 217 [NASA ADS] [Google Scholar]
- Roming, P. W. A., Kennedy, T. E., Mason, K. O., et al. 2005, Space Sci. Rev., 120, 95 [Google Scholar]
- Rudy, R. J., Crawford, K. B., & Russell, R. W. 2016, ATel, 9849, 1 [NASA ADS] [Google Scholar]
- Schlafly, E. F., & Finkbeiner, D. P. 2011, ApJ, 737, 103 [Google Scholar]
- Schlegel, D. J., Finkbeiner, D. P., & Davis, M. 1998, ApJ, 500, 525 [Google Scholar]
- Shappee, B. J., Prieto, J. L., Grupe, D., et al. 2014, ApJ, 788, 48 [Google Scholar]
- Shen, K. J., & Bildsten, L. 2007, ApJ, 660, 1444 [NASA ADS] [CrossRef] [Google Scholar]
- Stanek, K. Z., Kochanek, C. S., Brown, J. S., et al. 2016, ATel, 9669, 1 [NASA ADS] [Google Scholar]
- Straizys, V., & Kuriliene, G. 1981, Ap&SS, 80, 353 [CrossRef] [Google Scholar]
- Strope, R. J., Schaefer, B. E., & Henden, A. A. 2010, AJ, 140, 34 [NASA ADS] [CrossRef] [Google Scholar]
- Tokovinin, A., Fischer, D. A., Bonati, M., et al. 2013, PASP, 125, 1336 [NASA ADS] [CrossRef] [Google Scholar]
- van Dokkum, P. G. 2001, PASP, 113, 1420 [Google Scholar]
- Warner, B. 1995, Cataclysmic Variable Stars (Cambridge: Cambridge University Press), 28 [CrossRef] [Google Scholar]
- Wolf, W. M., Bildsten, L., Brooks, J., & Paxton, B. 2013, ApJ, 777, 136 [Google Scholar]
All Tables
Log of the Swift/UVOT observations of V5856 Sgr. Flux densities are in units of 10−15 erg cm−2 s−1 Å−1.
All Figures
|
Fig. 1. Complete optical light curve of V5856 Sgr since its nova eruption in 2016. Top panel: infrared magnitudes from NeoWISE all-sky survey. |
| In the text | |
|
Fig. 2. Spectrum of V5856 Sgr obtained on 2021 August 9 with the Asiago 1.22m + B&C telescope. The strongest emission lines are identified. |
| In the text | |
|
Fig. 3. Portion of 2019 light curve of V5856 Sgr from Fig. 1. Top panel: original ASASSN data in the g band. Bottom panel: same data after detrending and with a superimposed sinusoid of 15-day period and 0.25 mag amplitude. |
| In the text | |
|
Fig. 4. Light curves and color curves of V5856 Sgr in 2021–22 from Table 1. The epochs of Swift and CHIRON observations are flagged by arrows in the bottom panels. |
| In the text | |
|
Fig. 5. High-resolution profiles of selected emission lines from the CHIRON spectra of V5856 Sgr listed in Table 2. The logarithm of the continuum-normalized spectrum is plotted with an offset equal to the V-band magnitude of the nova for that date (see legend in top left panel). The abscissae at the top are velocities in km s−1 with respect to the laboratory wavelength. |
| In the text | |
|
Fig. 6. Region around NaI 5890 and KI 7699 from averaged CHIRON spectra listed in Table 2. The interstellar components at −21.8 and +4.3 km s−1 velocity are indicated, as is their decovolution (discussed in Sect. 4.3). The broad absorption labeled “wind” is variable from spectrum to spectrum. |
| In the text | |
|
Fig. 7. Reddening-corrected spectral energy distribution of V5856 Sgr at the epochs of the five Swift observations (see Sect. 5 for details). |
| In the text | |
|
Fig. 8. Fit with three blackbodies to the brightest and the faintest of the reddening-corrected spectral energy distributions in Fig. 7. |
| In the text | |
|
Fig. 9. Zoomed-in view from Fig. 5 of the central peak displayed by permitted emission lines. The abscissae at the top are velocities in km s−1 with respect to laboratory wavelength (dot-dashed vertical lines). The dashed vertical line is the −65 km s−1 velocity discussed in Sect. 6. |
| In the text | |
Current usage metrics show cumulative count of Article Views (full-text article views including HTML views, PDF and ePub downloads, according to the available data) and Abstracts Views on Vision4Press platform.
Data correspond to usage on the plateform after 2015. The current usage metrics is available 48-96 hours after online publication and is updated daily on week days.
Initial download of the metrics may take a while.