Open Access
Fig. 3.
Download original image
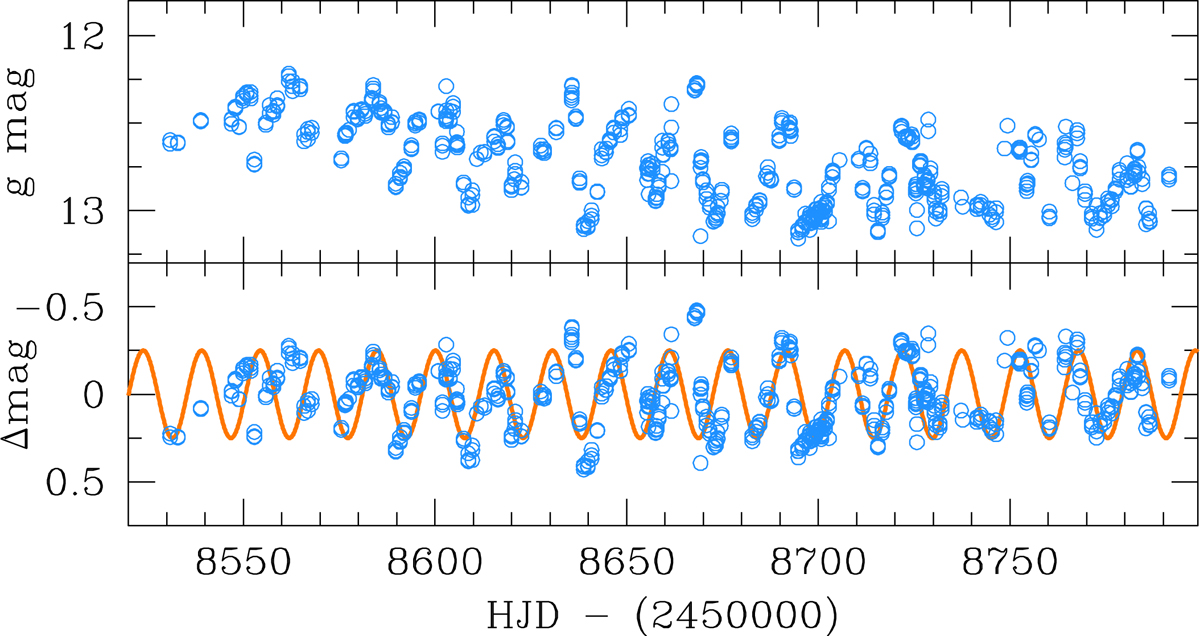
Portion of 2019 light curve of V5856 Sgr from Fig. 1. Top panel: original ASASSN data in the g band. Bottom panel: same data after detrending and with a superimposed sinusoid of 15-day period and 0.25 mag amplitude.
Current usage metrics show cumulative count of Article Views (full-text article views including HTML views, PDF and ePub downloads, according to the available data) and Abstracts Views on Vision4Press platform.
Data correspond to usage on the plateform after 2015. The current usage metrics is available 48-96 hours after online publication and is updated daily on week days.
Initial download of the metrics may take a while.