| Issue |
A&A
Volume 696, April 2025
|
|
|---|---|---|
| Article Number | A24 | |
| Number of page(s) | 5 | |
| Section | Interstellar and circumstellar matter | |
| DOI | https://doi.org/10.1051/0004-6361/202451880 | |
| Published online | 01 April 2025 | |
Cosmic ray bubbles from nova super-remnants and their contribution to local cosmic ray spectra
1
Instituto de Astrofísica de Andalucía, CSIC,
Granada
18008, Spain
2
Max-Planck-Institut für Physik,
80805
München,
Germany
3
Deutsches Elektronen-Synchrotron DESY,
Platanenallee 6,
15738
Zeuthen, Germany
★ Corresponding author; This email address is being protected from spambots. You need JavaScript enabled to view it.
Received:
13
August
2024
Accepted:
8
March
2025
Abstract
Context. Several new phenomena have arisen in the area of study of the repeating thermonuclear explosions called novae. For example, recurrent novae have been proven to be efficient cosmic ray hadronic accelerators thanks to the recent observations of RS Ophiuchi by different γ-ray instruments. Novae have also been demonstrated to have the ability to carve large cavities into the interstellar medium (ISM), with parallels with the remnants of supernovae.
Aims. Our aims are to calculate the effects of novae on their surrounding media, and the distances over which these effects dominate over the average quantities that are measured in the ISM.
Methods. We calculated the filling factor of novae and their contribution to cosmic ray fluxes using cosmic ray propagation codes. To limit the atomic density of the ISM surrounding the region of RS Oph, we used Fermi-LAT observations of the region.
Results. The filling factor of novae in the Galaxy is not significant under all assumptions done in the paper. They do not dominate over the local cosmic ray fluxes, even at the lowest energies, for distances larger than a few parsecs. The particle density of the ISM surrounding them is, however, very much modified, being lowered by more than one order of magnitude with respect to galactic averages, confirming estimates done using other observatories.
Conclusions. Even though at global galactic distances, novae do not seem to be dominating cosmic ray transport, they have the power to modify the conditions of their surrounding ISM over parsec distances.
Key words: elementary particles / radiation mechanisms: non-thermal / stars: variables: general
© The Authors 2025
 Open Access article, published by EDP Sciences, under the terms of the Creative Commons Attribution License (https://creativecommons.org/licenses/by/4.0), which permits unrestricted use, distribution, and reproduction in any medium, provided the original work is properly cited.
This article is published in open access under the Subscribe to Open model. This email address is being protected from spambots. You need JavaScript enabled to view it. to support open access publication.
1 Introduction
Cataclysmic variable stars are semi-detached binaries that consist of a primary white dwarf (WD) accreting material from a companion star. Novae constitute a sub-class of cataclysmic variable stars and they consist of outbursts caused by the accumulation of hydrogen-rich material on the surface of the WD, which results in a thermonuclear runaway creating thermonuclear explosions and resulting fast shocks. A nova is denominated as classical when only one outburst has been reported and recurrent when repeated eruptions have been documented (Chomiuk et al. 2021). The repetition period can vary from years to decades or almost centuries (Anupama 2013; Darnley 2021). The further sub-classification of a symbiotic nova denotes that the donor star has evolved from the main sequence, for example a red giant star, and therefore the WD is immersed in the donor star’s wind. Novae can increase their brightness by 6 to 19 magnitudes during these outbursts,which can last from weeks to months (see Chomiuk et al. 2021 for a review). Novae have been studied from radio up to X-rays for decades, but only 14 years ago was high-energy (HE; E >100 MeV) γ-ray emission first reported, from the recurrent symbiotic nova V407 Cyg by Fermi-LAT (Abdo et al. 2010). Later on, classical novae were also established as HE gamma-ray emitters (Ackermann et al. 2014). The number of novae detected in HE gamma rays has been increasing since then (Cheung et al. 2016; Franckowiak et al. 2018; Aydi et al. 2020). Even though these observations pointed towards the acceleration of cosmic rays (CRs) by novae, the origin of this gamma-ray emission was still unclear. Their spectra could be represented well by models considering leptons producing gamma rays by inverse Compton up-scattering of photons from the photosphere or protons decaying into π0 and producing gamma rays (Sitarek & Bednarek 2012). RS Ophiuchi (RS Oph) is a recurrent symbiotic nova that displays major outbursts every 15–20 years (Dobrzycka & Kenyon 1994). Its last outburst took place on August 8 2021. The event was panchromatically observed and is one of the best studied transient nova events. It was followed up by observing energies ranging from radio up to very high-energy (VHE; E > 100 GeV) gamma rays. In the HE regime, Fermi-LAT measured gamma rays coming from the direction of RS Oph (Cheung et al. 2022; H. E. S. S. Collaboration 2022). Most importantly, at VHE gamma rays, RS Oph was also detected by Cherenkov telescopes in the TeV regime, including MAGIC (Acciari et al. 2022) and the LST-1 of CTAO LST Collaboration (Abe et al. 2023) in the northern hemisphere and H.E.S.S. (H. E. S. S. Collaboration 2022) in the southern one. In X-rays, it was observed by Chandra and XMM−Newton (Orio et al. 2021), INTEGRAL (Ferrigno et al. 2021), MAXI (Shidatsu et al. 2021), NICER (Enoto et al. 2021), NuSTAR (Luna et al. 2021), and Swift (Page et al. 2022). In the optical, photometry and spectroscopic observations were carried out (Taguchi et al. 2021a; Munari et al. 2021; Munari & Valisa 2021a; Munari & Valisa 2021b; Taguchi et al. 2021b; Nikolov & Luna 2021; Shore et al. 2021a,c,b; Fajrin et al. 2021; Ricra et al. 2021; Zamanov et al. 2021, 2022). Infrared (Woodward et al. 2021) and radio (Sokolovsky et al. 2021; Peters et al. 2021; Williams et al. 2021) observations were also carried out. Upper limits on the neutrino flux were also established by IceCube Multimessenger (Pizzuto et al. 2021). In the gammaray energy range, the continuation of the spectrum and similar flux decay between the HE and VHE measurements point to a common radiation component arising from a single high-speed shock (a two-shock model is presented in Diesing et al. 2023). Independent of the multiplicity of the shocks in which particles are accelerated, the current consensus is that the underlying particle population producing this emission is of hadronic origin. A pure leptonic origin could still be possible (see Bednarek 2022; Bednarek & Sitarek 2023), but the hadronic interpretation is strengthened by energetic and multi-wavelength temporal evolution arguments (see Acciari et al. 2022; H. E. S. S. Collaboration 2022 for details). The efficient acceleration of hadronic CRs in nova shocks, converting a significant fraction of the nova explosion energy into accelerated CRs that reach an energy budget of ~1043 erg, justifies the investigation of a sizeable contribution of novae to the CR sea. Acciari et al. (2022) and H. E. S. S. Collaboration (2022) argue that the contribution of each single outburst (i.e. an impulsive injection of CRs) is sub-dominant to the average Galactic cosmic-ray population beyond ~ 1 pc.
However, the contribution of these recurrent novae (RNe), defined as the sub-class of the cataclysmic variables that experience repeated thermonuclear eruptions on timescales of a human lifetime, can last millions of years, injecting protons semi-continuously in the surrounding environment during the evolutionary path of the system (Healy-Kalesh et al. 2023). Due to these continual eruptions, a dynamical structure, either a nova shell or a larger remnant, is formed. This object, called a nova super-remnant (NSR) has recently been identified in the Andromeda Galaxy around the nova M31N 2008-12a (Darnley et al. 2016), extending over a size that rivals that of supernova remnants (SNRs; with ~100 pc radius), perhaps more similar to superbubbles observed around massive stellar clusters (Ackermann et al. 2011; Aharonian et al. 2019). Even though this effect has been simulated and studied, leading to the conclusion that there is an apparent shortage of these systems in the Local Group (Healy-Kalesh et al. 2024b), a cavity in the far-infrared archival IRAS images fulfilling these characteristics has been found in the region surrounding RS Oph (Healy-Kalesh et al. 2024a). The cavity is described as an ellipse with a semi-major axis of ~ 40 arcmin modeled as the effect of 650 000 eruptions that took place during a period of 25 Myr. This corresponds to a projected size of ~16 pc, for a distance of 1.4 kpc (Barry et al. 2008), although the distance to RS Oph has been subject of intense debate (see Sect. C.1 of Acciari et al. 2022) and we also consider a distance of 2.45 kpc derived in Rupen et al. (2008) based on VLBA radio imaging of the nova shock expansion. Assuming a similar efficiency in the previous outbursts, one would naively expect an accumulation of CRs being injected continuously over a lifetime of millions of years. Each of these outbursts is expected to excite very turbulent plasma around the nova, plasma that fills up the cavity, potentially confining CRs within the bubble. These CRs can eventually radiate in gamma rays through proton-proton interaction when interacting with the tenuous gas within the cavity, and reach detectable levels if the accumulated CRs are energetic enough.
In this work, we investigate the contribution of RNe to the CRs as a continuous particle accelerator. In Sect. 2, we estimate the contribution of the accumulated protons to the CR sea, as a function of the distance to the nova and the filling fraction considering RS Oph as a prototype of RNe. In Sect. 3, we derive upper limits on the NSR gamma-ray emission, which translates to constraints on the proton and density of the interstellar medium (ISM) at 16 pc surrounding RS Oph.
2 RNe as local and global CR accelerators
If the TeV outburst of RS Oph is to be considered archetypal of the acceleration of protons in RNe, it can be shown that the contribution to the CR sea would be no more than 0.2% (Acciari et al. 2022). Likewise, if we reduce the problem to the local contribution of CRs around the star, we also find that the energy density of the CRs injected by the nova would dominate over the energy density of the CRs in the Milky Way (MW) only for a region with a radius of Rnova ≲ 0.5 pc, assuming a homogeneous distribution of the CRs in the region (Acciari et al. 2022). The estimates above concern the single contribution of a given nova. We can now entertain the contribution of a population of similar classical novae independently exploding in the MW to calculate the total filling factor of their regions of influence.
2.1 Filling factor of novae in the Milky Way
The rate of novae in the  (Shafter 2017) or N = 26 ± 6 yr−1 in more recent estimates (Kawash et al. 2022) – makes one wonder if a significant fraction of the MW could be covered by the remnants of these explosions. Without making any initial assumptions about the volume that is covered by a nova remnant, we computed what the percentage of the MW covered by these objects would be. To estimate the volume of the MW, we considered it to be contained in a cylinder of radius RMW = 20 kpc and height HMW = 200 pc (Vieira et al. 2023). We made the very simplistic and conservative assumption that every nova creates a sphere of radius Rnova without considering any overlapping between the regions created by different novae. The fraction (F) covered is therefore given by
 (1)
(1)
where t is the time that is considered for nova eruptions to sustain such a cavity and we assume N = 26 ± 6 yr−1 (Kawash et al. 2022). This is represented in Fig. 1 for the assumption of t = 1 Myr, together with different significant radii and percentages of the Galaxy covered. We can see that even in the most optimistic scenario of no overlapping between regions, this novae population would cover a significant fraction (>10% of the MW) only in the case of extending the novae’s region of influence for regions with a radius larger than 5 pc and/or lasting for a significant time longer than 1 Myr. As a first-order approximation, the radius of influence over the ISM for a single nova calculated using Eq. (16) of Acciari et al. (2022) is ~0.5 pc, and even though that for a RN can reach distances larger than a few parsecs (Eq. (17) of Acciari et al. 2022), the volume of the region of influence of a RN is smaller than that of independent single novae that erupted the same number of times as the recurrent one.
2.2 Local CR contribution
We next went one step further and computed what the contribution of novae to the local CR spectrum surrounding a RN is. For the calculations, we used the EDGE code (López-Coto et al. 2018), assuming a source continuously injecting protons for 25 Myr. We assumed the optimistic scenario in which the total injected energy in protons per nova eruption is the same as in RS Oph and equal to 4.4 × 1043 erg (Acciari et al. 2022), with the same evolution considered in Healy-Kalesh et al. (2024a) for a total of 650 000 eruptions during the lifetime considered. Cosmic rays are considered to propagate isotropically from the central sources and due to the impulsive behaviour of the injection, we consider them to diffuse away from the central source with an energy-dependent diffusion given by D(E) = D0(1 + E/E0)δ (Atoyan et al. 1995), where E0 = 3 GeV and δ=0.33, assuming Kolmogorov turbulence, and D0 = 1.4 × 1026 cm2/s, assuming slow diffusion in a turbulent region as was measured in (Abeysekara et al. 2017) and comparable to that in regions much more turbulent than the ISM (Ackermann et al. 2011). We calculated the CR flux at different distances from the nova explosion and compare them to the one locally measured at Earth in Fig. 2. Ignoring the region below a few giga-electronvolts that is affected by solar modulation, we can see that the spectrum produced by a RN only dominates over the local spectrum for a region of ~ 10 pc, similar to what was deducted using simple calculations. We therefore conclude that to obtain a significant contribution of a nova to the CR spectrum measured at Earth, the nova would need to erupt at a distance no further than a few tens of parsecs, with a rate of a few decades. We note that we are assuming a slow propagation due to a turbulent region, and for faster propagations the dominance of the CR spectrum injected by the RN would be reduced with respect to that of the ISM. In the case of slower propagation, close to the Bohm limit, or confinement of these CRs, the dominance of NSRs could extend to regions reaching the tens of parsecs distance, but one would also need to take into account larger cooling effects due to this confinement.
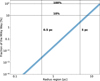 |
Fig. 1 Fraction of the Galaxy covered by CR bubbles created by novae. The band represents the error in the number of novae per year estimated by Kawash et al. (2022). |
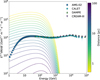 |
Fig. 2 Proton flux produced by a single RN at different distances from the source. For comparison, we show the local proton fluxes locally measured by AMS-02 (Aguilar et al. 2015), CALET (Adriani et al. 2022), DAMPE (An et al. 2019), and CREAM-III (Choi et al. 2022). |
3 Nova super-remnants as continuous CR injectors: The case of RS Ophiuchi
In Sect. 2, we made the simple assumption that all CRs injected by novae travel freely and computed their influence on the surrounding media as an optimistic scenario to study if their influence could be significant. In this section, however, we consider a more realistic case derived from recent measurements, in which RNe bore through the ISM to produce cavities in which there is a shock between the material expelled by the continuous eruptions and the ISM. The CRs injected by them are confined in these regions and we study their effects. The discovery of a cavity around RS Oph (Healy-Kalesh et al. 2024a), resembling the NSR discovered around M31N 2008-12a (Darnley et al. 2019), gives rise to the possibility of such a phenomenon around RS Oph. We can thus interpret this cavity as having been produced by recurrent injections of CRs by the nova on timescales of millions of years, filling a region in the sky with an angular size of ~0.6 deg. We searched for gamma rays in this region using data from the Large Area Telescope (LAT) on board the Fermi Gamma-ray Space Telescope (Atwood et al. 2009) to constrain the content of CRs.
3.1 Fermi−LAT analysis
The gamma-ray emission detected by the LAT during the 2021 eruption declined quickly below the detectable level after ~1 month (Cheung et al. 2022). To evaluate the steady emission due to continuous injection of protons in multiple outbursts, we used the ~15 year dataset covering the period before and after it.
We performed a binned likelihood analysis using Fermi-LAT data spanning from MJD 54 682.655 to 60 377.351, while eliminating time between 59 433.5 and 59 533.5 corresponding to the recent 2021 outburst of RS Oph. RS Oph was not significantly detected 50 days post-outburst. We conservatively chose 100 days post-outburst to ensure that there was no residual contamination in the NSR (Cheung et al. 2022). The analysis was performed using Fermipy 1.2.21 and Fermitools v2.2.02. We used Fermi-LAT data with a 15°diameter region of interest surrounding RS Oph (RA=267.555°, Dec=−6.708°) and 4FGL- DR4 as the baseline model to populate sources within a 20° radius of RS Oph, gll_iem_v07 as the Galactic diffuse component and iso_P8R3_SOURCE_V3_v1 as the isotropic diffuse component. The analysis covers an energy range from 100 MeV to 500 GeV, divided into eight energy bins per decade, while the spatial binning uses 150 ×150 bins. The joint likelihood analysis was subdivided into PSF0/1/2/3 event types with a zenith angle cut of 90° for each event type to eliminate emission from the Earth’s Limb. While the likelihood maximization was being performed, the normalization and shape parameters of all sources within a 5° radius from RS Oph, including the Galactic and isotropic diffuse components, were left free within the fit.
The template we used considers the NSR with a semi-major axis of 40 arcmin, an eccentricity of 0.95, and a position angle of 50 deg – the shape extracted in Healy-Kalesh et al. (2024a) – as can be seen in Fig. 3. Notably, this is largely consistent with the known bipolar ejecta from RS Oph, as has been demonstrated with later radio interferometry measurements (Munari et al. 2022; de Ruiter et al. 2023). No Fermi-LAT source was found at the position of RS Oph during the inter-eruption period, and upper limits can be seen in Fig. 4. We took the difference in the log-likelihood of the model without the RS Oph NSR (the null hypothesis) to the one of the log-likelihood with the RS Oph NSR (test hypothesis). We used the following equation from Mattox et al. (1996):
 (2)
(2)
where TS is the test statistic, ℒnull is the log-likelihood of the null hypothesis, and ℒtest is the log-likelihood of the test hypothesis. The significance of detection of a source is defined as the square root of the TS. We found TS = 0.01 for the RS Oph NSR, which is well below the TS≥25 threshold to claim a detection3. The 95% integrated flux upper limit for the RS Oph NSR is 3.25 × 10⁻¹⁰ cm−2 s−1, integrated from 100 MeV to 500 GeV.
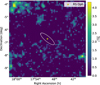 |
Fig. 3 Fermi-LAT skymap in significance derived from test statistics. In white, we can see the template used to derive the γ-ray upper limits. The square root of the TS (see Eq. (2)) is the significance of detecting a new source against the null hypothesis. The parameters for the template were taken from Healy-Kalesh et al. (2024b). |
3.2 CRs in the RS Oph NSR
Taking into account that the nova energy output used to accelerate the protons is 4.4 × 1043 erg (Acciari et al. 2022), and the estimates from Healy-Kalesh et al. (2024a) of 650 000 eruptions over 25 Myr, we found that the total energy into accelerated protons is
 (3)
(3)
This quantity may be lower if the energy output that goes into accelerated protons is lower in the initial stages of the lifetime of the nova, so it could be considered an upper limit on the total energy injected into ultra-relativistic particles. To compute the maximum amount of energy allowed by the Fermi-LAT upper limits, we used naima (Zabalza 2015) and GAMERA (Hahn 2015). We assumed that CR protons interact with the medium, that the total amount of energy injected into accelerated protons is Wp , and that gamma rays are produced via π0 decay. The injected proton spectrum is a power law defined between 100 MeV and 10 TeV following the form
 (4)
(4)
with E0=1 TeV, normalization of f0 = 2 × 1046 erg−1, and a spectral index of Γ = 2.5. This spectrum is directly dependent on the particle density with which the accelerated protons is considered to be interacting, and in this case it is n = 1 particle/cm3, of the same order as the ISM. The chosen spectral index and normalization in the particle spectrum are given by the maximum gamma-ray spectrum allowed by the Fermi-LAT upper limits in the roughly giga-electronvolt energy range and slight modifications that also fit our data in the spectral index and normalization are possible. Given this model, the upper limit on the γ-ray luminosity above 100 MeV is Lγ < 4 × 1032 erg/s, while the total energy, W, needed above 100 MeV to be injected into accelerated protons that produce gamma rays compatible with Fermi-LAT spectrum is
 (5)
(5)
where d is the distance to the source and n the atomic density of the cavity. If we compare Eqs. (3) and (5), we obtain an upper limit on the ISM atomic density of nd=2.45kpc < 0.4 cm−3, around one order of magnitude smaller than that of the ISM (Webber 1998). If we want to compare the value obtained in Healy-Kalesh et al. (2024a) with our estimate here, we need to assume a distance of 1.4 kpc, as was done in that reference. In this case, the limit derived is nd=1.4kpc ~ 0.1 cm−3, similar to the atomic density calculated in the aforementioned reference. We note that this estimate depends on the assumption that all nova eruptions produce the same quantity of ultra-relativistic protons and on the assumed distance to the source: closer distances would imply lower atomic densities. The result is also based on the assumption that CRs do not escape from these sources and remain trapped in the NSR bubble. Taking into account that the atomic density derived using our calculations is at the same level that the one inferred in Healy-Kalesh et al. (2024a), the only possible explanations are that we are at the level of detection of the source or that the average amount of energy per eruption over the 25 Myr considered is smaller than that of the last eruption, or that CRs actually escape from the source.
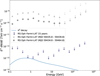 |
Fig. 4 Fermi-LAT 95% upper limits on RS Oph 15 year emission using the template from Healy-Kalesh et al. (2024a) compared with the π0 model. The spectral energy distributions from the outburst period of RS Oph are from Acciari et al. (2022) for the time range shown in the legend, in which RS Oph is assumed to be a point source. |
4 Conclusions
We have evaluated the contribution of the TeV gamma-ray novae population to the Galactic CR sea. Even though novae have been proven to be able to accelerate CRs up to multi-tera-electronvolt energies (Acciari et al. 2022; H. E. S. S. Collaboration 2022), we have found that a population of RS Oph-like novae, with a similar energetic output, would not contribute significantly to the CR sea (<0.2%), or to large regions around them; that is, local bubbles with radii of more than a few parsecs.
Local hadronic CRs could come from novae only in extreme conditions, with novae needing to be nearby (a few tens of parsecs) and regular (with cadences of a few decades). Using simple calculations, we conclude that only an insignificant fraction (<10%) of the Galaxy can be covered by nova remnants. These NSRs might be abundant in our Galaxy; however, they are difficult to detect in gamma rays. The continuous outbursts during the nova’s lifetime blow away the matter of the ISM around it, creating a cavity around the binary systems of a low-density medium (Chomiuk et al. 2021). This is confirmed by the analysis of the LAT data on the NSR associated with RS Oph. When excluding the period in which the latest outburst was recorded, no gamma-ray source was found in the region defined by the infrared cavity found by Healy-Kalesh et al. (2024a). The upper limits allow us to establish an upper limit on the ISM atomic density of n < 0.1 cm−3, under the hypothesis of a history of similar energetic outbursts to the one in 2021. This density is a factor of ten lower than the average density in the ISM and in agreement with the simulations described in Healy-Kalesh et al. (2024a). These cavities are common around SNR explosions and stellar clusters with strong winds and reflect the strong effect of stellar activity on the surrounding ISM up to a hundred-parsec scale. LAT observations from other energetic close-by gammaray novae off-outburst can therefore be used to map the ISM densities in different regions of the Galaxy.
Acknowledgments
Acknowledgements.
We thankfully acknowledge the comments from the anonymous referee that improved greatly the manuscript. R.L.-C., acknowledges the Ramón y Cajal program through grant RYC-2020-028639-I, the financial support from the Spanish “Ministerio de Ciencia e Innovación” through grant PID2022-139117NB-C44, Grant CNS2023-144504 funded by MICIU/AEI/10.13039/501100011033 and by the European Union NextGenerationEU/PRTR and the Severo Ochoa program through grant CEX2021-001131-S funded by MCIN/AEI/10.13039/501100011033. He also acknowledges the European Union’s Recovery and Resilience Facility-Next Generation, in the framework of the General Invitation of the Spanish Government’s public business entity Red.es to participate in talent attraction and retention programmes within Investment 4 of Component 19 of the Recovery, Transformation and Resilience Plan. The Fermi LAT Collaboration acknowledges generous ongoing support from a number of agencies and institutes that have supported both the development and the operation of the LAT as well as scientific data analysis. These include the National Aeronautics and Space Administration and the Department of Energy in the United States, the Commissariat à l’Energie Atomique and the Centre National de la Recherche Scientifique / Institut National de Physique Nucléaire et de Physique des Particules in France, the Agenzia Spaziale Italiana and the Istituto Nazionale di Fisica Nucleare in Italy, the Ministry of Education, Culture, Sports, Science and Technology (MEXT), High Energy Accelerator Research Organization (KEK) and Japan Aerospace Exploration Agency (JAXA) in Japan, and the K. A. Wallenberg Foundation, the Swedish Research Council and the Swedish National Space Board in Sweden. Additional support for science analysis during the operations phase is gratefully acknowledged from the Istituto Nazionale di Astrofisica in Italy and the Centre National d’Études Spatiales in France. This work performed in part under DOE Contract DE-AC02-76SF00515.
References
- Abdo, A. A., Ackermann, M., Ajello, M., et al. 2010, Science, 329, 817 [NASA ADS] [CrossRef] [Google Scholar]
- Abe, H., Abe, K., Abe, S., et al. 2023, PoS, 2022, 055 [Google Scholar]
- Abeysekara, A. U., Albert, A., Alfaro, R., et al. 2017, Science, 358, 911 [NASA ADS] [CrossRef] [Google Scholar]
- Acciari, V. A., Ansoldi, S., Antonelli, L. A., et al. 2022, Nat. Astron., 6, 689 [NASA ADS] [CrossRef] [Google Scholar]
- Ackermann, M., Ajello, M., Allafort, A., et al. 2011, Science, 334, 1103 [NASA ADS] [CrossRef] [Google Scholar]
- Ackermann, M., Ajello, M., Albert, A., et al. 2014, Science, 345, 554 [NASA ADS] [CrossRef] [Google Scholar]
- Adriani, O., Akaike, Y., Asano, K., et al. 2022, Phys. Rev. Lett., 129, 101102 [NASA ADS] [CrossRef] [Google Scholar]
- Aguilar, M., Aisa, D., Alpat, B., et al. 2015, Phys. Rev. Lett., 114, 171103 [CrossRef] [PubMed] [Google Scholar]
- Aharonian, F., Yang, R., & de Oña Wilhelmi, E. 2019, Nat. Astron., 3, 561 [Google Scholar]
- An, Q., Asfandiyarov, R., Azzarello, P., et al. 2019, Sci. Adv., 5, eaax3793 [NASA ADS] [CrossRef] [Google Scholar]
- Anupama, G. C. 2013, IAU Symp., 281, 154 [Google Scholar]
- Atoyan, A. M., Aharonian, F. A., & Völk, H. J. 1995, Phys. Rev. D, 52, 3265 [NASA ADS] [CrossRef] [Google Scholar]
- Atwood, W. B., Abdo, A. A., Ackermann, M., et al. 2009, ApJ, 697, 1071 [CrossRef] [Google Scholar]
- Aydi, E., Sokolovsky, K. V., Chomiuk, L., et al. 2020, Nat. Astron., 4, 776 [CrossRef] [Google Scholar]
- Barry, R. K., Mukai, K., Sokoloski, J. L., et al. 2008, ASP Conf. Ser., 401, 52 [NASA ADS] [Google Scholar]
- Bednarek, W. 2022, MNRAS, 515, 1644 [NASA ADS] [Google Scholar]
- Bednarek, W., & Sitarek, J. 2023, J. High Energy Astrophys., 38, 22 [NASA ADS] [Google Scholar]
- Cheung, C. C., Jean, P., Shore, S. N., et al. 2016, ApJ, 826, 142 [NASA ADS] [CrossRef] [Google Scholar]
- Cheung, C. C., Johnson, T. J., Jean, P., et al. 2022, ApJ, 935, 44 [NASA ADS] [CrossRef] [Google Scholar]
- Choi, G. H., Seo, E. S., Aggarwal, S., et al. 2022, ApJ, 940, 107 [Google Scholar]
- Chomiuk, L., Metzger, B. D., & Shen, K. J. 2021, ARA&A, 59, 391 [NASA ADS] [CrossRef] [Google Scholar]
- Darnley, M. J. 2021, PoS, GOLDEN2019, 044 [Google Scholar]
- Darnley, M. J., Henze, M., Bode, M. F., et al. 2016, ApJ, 833, 149 [NASA ADS] [CrossRef] [Google Scholar]
- Darnley, M. J., Hounsell, R., O’Brien, T. J., et al. 2019, Nature, 565, 460 [NASA ADS] [CrossRef] [Google Scholar]
- de Ruiter, I., Nyamai, M. M., Rowlinson, A., et al. 2023, MNRAS, 523, 132 [NASA ADS] [CrossRef] [Google Scholar]
- Diesing, R., Metzger, B. D., Aydi, E., et al. 2023, ApJ, 947, 70 [NASA ADS] [CrossRef] [Google Scholar]
- Dobrzycka, D., & Kenyon, S. J. 1994, AJ, 108, 2259 [NASA ADS] [CrossRef] [Google Scholar]
- Enoto, T., Maehara, H., Orio, M., et al. 2021, ATel, 14850, 1 [NASA ADS] [Google Scholar]
- Fajrin, M., Imaduddin, I., Malasan, H. L., et al. 2021, ATel, 14909, 1 [NASA ADS] [Google Scholar]
- Ferrigno, C., Savchenko, V., Bozzo, E., et al. 2021, ATel, 14855, 1 [NASA ADS] [Google Scholar]
- Franckowiak, A., Jean, P., Wood, M., Cheung, C. C., & Buson, S. 2018, A&A, 609, A120 [NASA ADS] [CrossRef] [EDP Sciences] [Google Scholar]
- Hahn, J. 2015, Int. Cosmic Ray Conf., 34, 917 [NASA ADS] [Google Scholar]
- Healy-Kalesh, M. W., Darnley, M. J., Harvey, É. J., et al. 2023, MNRAS, 521, 3004 [NASA ADS] [Google Scholar]
- Healy-Kalesh, M. W., Darnley, M. J., Harvey, É. J., & Newsam, A. M. 2024a, MNRAS, 529, L175 [Google Scholar]
- Healy-Kalesh, M. W., Darnley, M. J., & Shara, M. M. 2024b, MNRAS, 528, 3531 [Google Scholar]
- H. E. S. S. Collaboration (Aharonian, F., et al.) 2022, Science, 376, 77 [NASA ADS] [CrossRef] [Google Scholar]
- Kawash, A., Chomiuk, L., Strader, J., et al. 2022, ApJ, 937, 64 [NASA ADS] [CrossRef] [Google Scholar]
- López-Coto, R., Hahn, J., BenZvi, S., et al. 2018, Astropart. Phys., 102, 1 [Google Scholar]
- Luna, G. J. M., Jimemez-Carrera, R., Enoto, T., et al. 2021, ATel, 14872, 1 [NASA ADS] [Google Scholar]
- Mattox, J. R., Bertsch, D. L., Chiang, J., et al. 1996, ApJ, 461, 396 [Google Scholar]
- Munari, U., & Valisa, P. 2021a, ATel, 14840, 1 [NASA ADS] [Google Scholar]
- Munari, U., & Valisa, P. 2021b, ATel, 14860, 1 [NASA ADS] [Google Scholar]
- Munari, U., Valisa, P., & Ochner, P. 2021, ATel, 14895, 1 [NASA ADS] [Google Scholar]
- Munari, U., Giroletti, M., Marcote, B., et al. 2022, A&A, 666, L6 [NASA ADS] [CrossRef] [EDP Sciences] [Google Scholar]
- Nikolov, Y., & Luna, G. J. M. 2021, ATel, 14863, 1 [NASA ADS] [Google Scholar]
- Orio, M., Behar, E., Drake, J., et al. 2021, ATel, 14906, 1 [NASA ADS] [Google Scholar]
- Page, K. L., Beardmore, A. P., Osborne, J. P., et al. 2022, MNRAS, 514, 1557 [NASA ADS] [CrossRef] [Google Scholar]
- Peters, W. M., Clarke, T. E., Giacintucci, S., Kassim, N. E., & Polisensky, E. 2021, ATel, 14908, 1 [NASA ADS] [Google Scholar]
- Pizzuto, A., Vandenbroucke, J., Santander, M., & IceCube Collaboration 2021, ATel, 14851, 1 [NASA ADS] [Google Scholar]
- Ricra, J., Vannini, J., & Baella, N. O. 2021, ATel, 14972, 1 [NASA ADS] [Google Scholar]
- Rupen, M. P., Mioduszewski, A. J., & Sokoloski, J. L. 2008, ApJ, 688, 559 [NASA ADS] [CrossRef] [Google Scholar]
- Shafter, A. W. 2017, ApJ, 834, 196 [CrossRef] [Google Scholar]
- Shidatsu, M., Negoro, H., Mihara, T., et al. 2021, ATel, 14846, 1 [NASA ADS] [Google Scholar]
- Shore, S. N., Allen, H., Bajer, M., et al. 2021a, ATel, 14868, 1 [NASA ADS] [Google Scholar]
- Shore, S. N., Teyssier, F., Guarro, J., et al. 2021b, ATel, 14883, 1 [NASA ADS] [Google Scholar]
- Shore, S. N., Teyssier, F., & Thizy, O. 2021c, ATel, 14881, 1 [NASA ADS] [Google Scholar]
- Sitarek, J., & Bednarek, W. 2012, Phys. Rev. D, 86, 063011 [Google Scholar]
- Sokolovsky, K., Aydi, E., Chomiuk, L., et al. 2021, ATel, 14886, 1 [NASA ADS] [Google Scholar]
- Taguchi, K., Maehara, H., Isogai, K., Tampo, Y., & Ito, J. 2021a, ATel, 14858, 1 [NASA ADS] [Google Scholar]
- Taguchi, K., Ueta, T., & Isogai, K. 2021b, ATel, 14838, 1 [NASA ADS] [Google Scholar]
- Vieira, K., Korchagin, V., Carraro, G., & Lutsenko, A. 2023, Galaxies, 11, 77 [NASA ADS] [CrossRef] [Google Scholar]
- Webber, W. R. 1998, ApJ, 506, 329 [NASA ADS] [CrossRef] [Google Scholar]
- Williams, D., O’Brien, T., Woudt, P., et al. 2021, ATel, 14849, 1 [NASA ADS] [Google Scholar]
- Woodward, C. E., Evans, A., Banerjee, D. P. K., et al. 2021, ATel, 14866, 1 [NASA ADS] [Google Scholar]
- Zabalza, V. 2015, Int. Cosmic Ray Conf., 34, 922 [Google Scholar]
- Zamanov, R., Stoyanov, K., Kostov, A., et al. 2021, ATel, 14974, 1 [NASA ADS] [Google Scholar]
- Zamanov, R., Marchev, V., Marchev, D., Atanasova, T., & Pavlova, N. 2022, ATel, 15330, 1 [NASA ADS] [Google Scholar]
All Figures
|
Fig. 1 Fraction of the Galaxy covered by CR bubbles created by novae. The band represents the error in the number of novae per year estimated by Kawash et al. (2022). |
| In the text | |
|
Fig. 2 Proton flux produced by a single RN at different distances from the source. For comparison, we show the local proton fluxes locally measured by AMS-02 (Aguilar et al. 2015), CALET (Adriani et al. 2022), DAMPE (An et al. 2019), and CREAM-III (Choi et al. 2022). |
| In the text | |
|
Fig. 3 Fermi-LAT skymap in significance derived from test statistics. In white, we can see the template used to derive the γ-ray upper limits. The square root of the TS (see Eq. (2)) is the significance of detecting a new source against the null hypothesis. The parameters for the template were taken from Healy-Kalesh et al. (2024b). |
| In the text | |
|
Fig. 4 Fermi-LAT 95% upper limits on RS Oph 15 year emission using the template from Healy-Kalesh et al. (2024a) compared with the π0 model. The spectral energy distributions from the outburst period of RS Oph are from Acciari et al. (2022) for the time range shown in the legend, in which RS Oph is assumed to be a point source. |
| In the text | |
Current usage metrics show cumulative count of Article Views (full-text article views including HTML views, PDF and ePub downloads, according to the available data) and Abstracts Views on Vision4Press platform.
Data correspond to usage on the plateform after 2015. The current usage metrics is available 48-96 hours after online publication and is updated daily on week days.
Initial download of the metrics may take a while.