Free Access
Fig. 5.
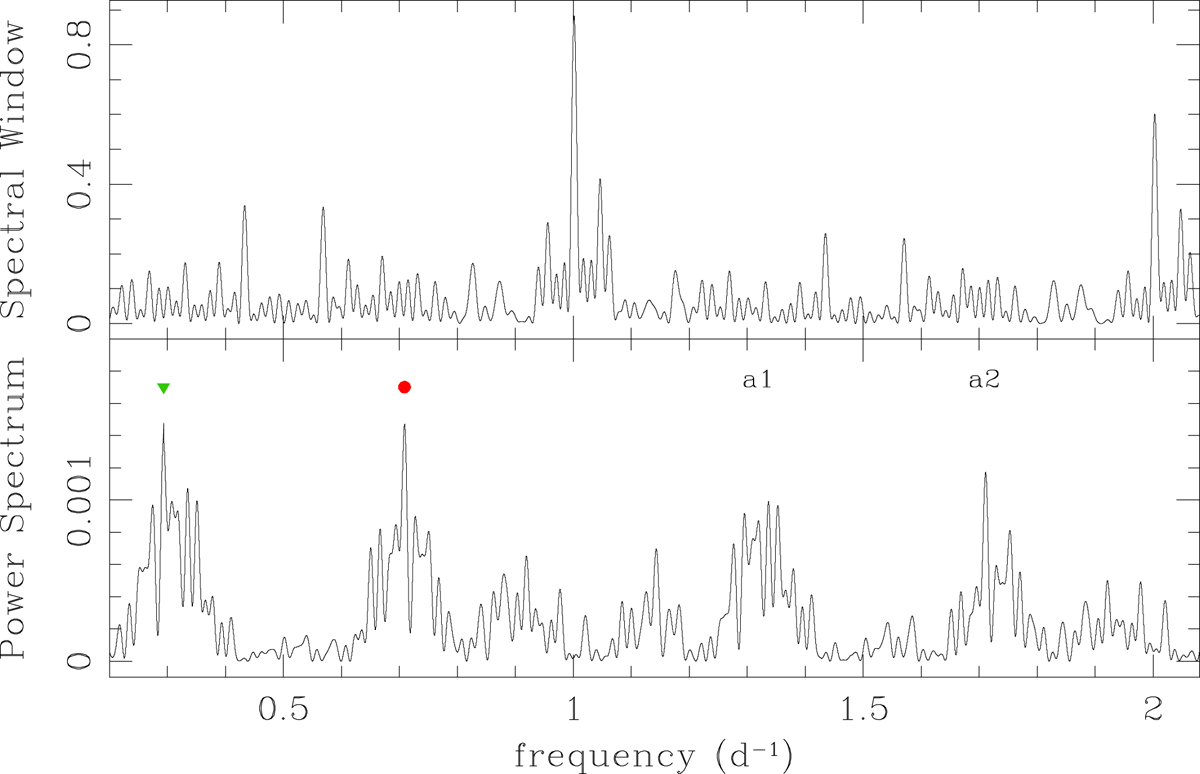
Spectral window and power spectrum over the 5.0 − 0.5 day interval for the Fourier analysis of V-band data in Table 1. The green triangle and red dot mark the 3.4118 and 1.4118 day periods, respectively, and a1 and a2 mark their respective one-day aliases.
Current usage metrics show cumulative count of Article Views (full-text article views including HTML views, PDF and ePub downloads, according to the available data) and Abstracts Views on Vision4Press platform.
Data correspond to usage on the plateform after 2015. The current usage metrics is available 48-96 hours after online publication and is updated daily on week days.
Initial download of the metrics may take a while.