Free Access
Fig. 2.
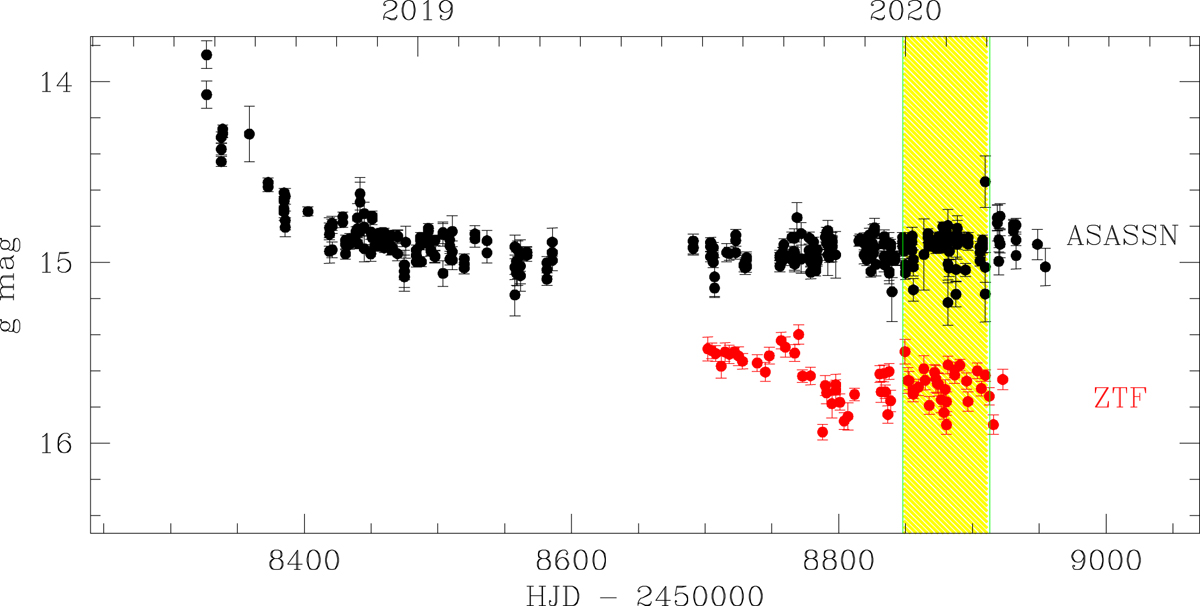
Post-outburst g-band lightcurve of V392 Per from ASAS-SN and ZTF data. The region in yellow is the interval covered by our time-resolved observations in search of the orbital period.
Current usage metrics show cumulative count of Article Views (full-text article views including HTML views, PDF and ePub downloads, according to the available data) and Abstracts Views on Vision4Press platform.
Data correspond to usage on the plateform after 2015. The current usage metrics is available 48-96 hours after online publication and is updated daily on week days.
Initial download of the metrics may take a while.