Free Access
Fig. 3.
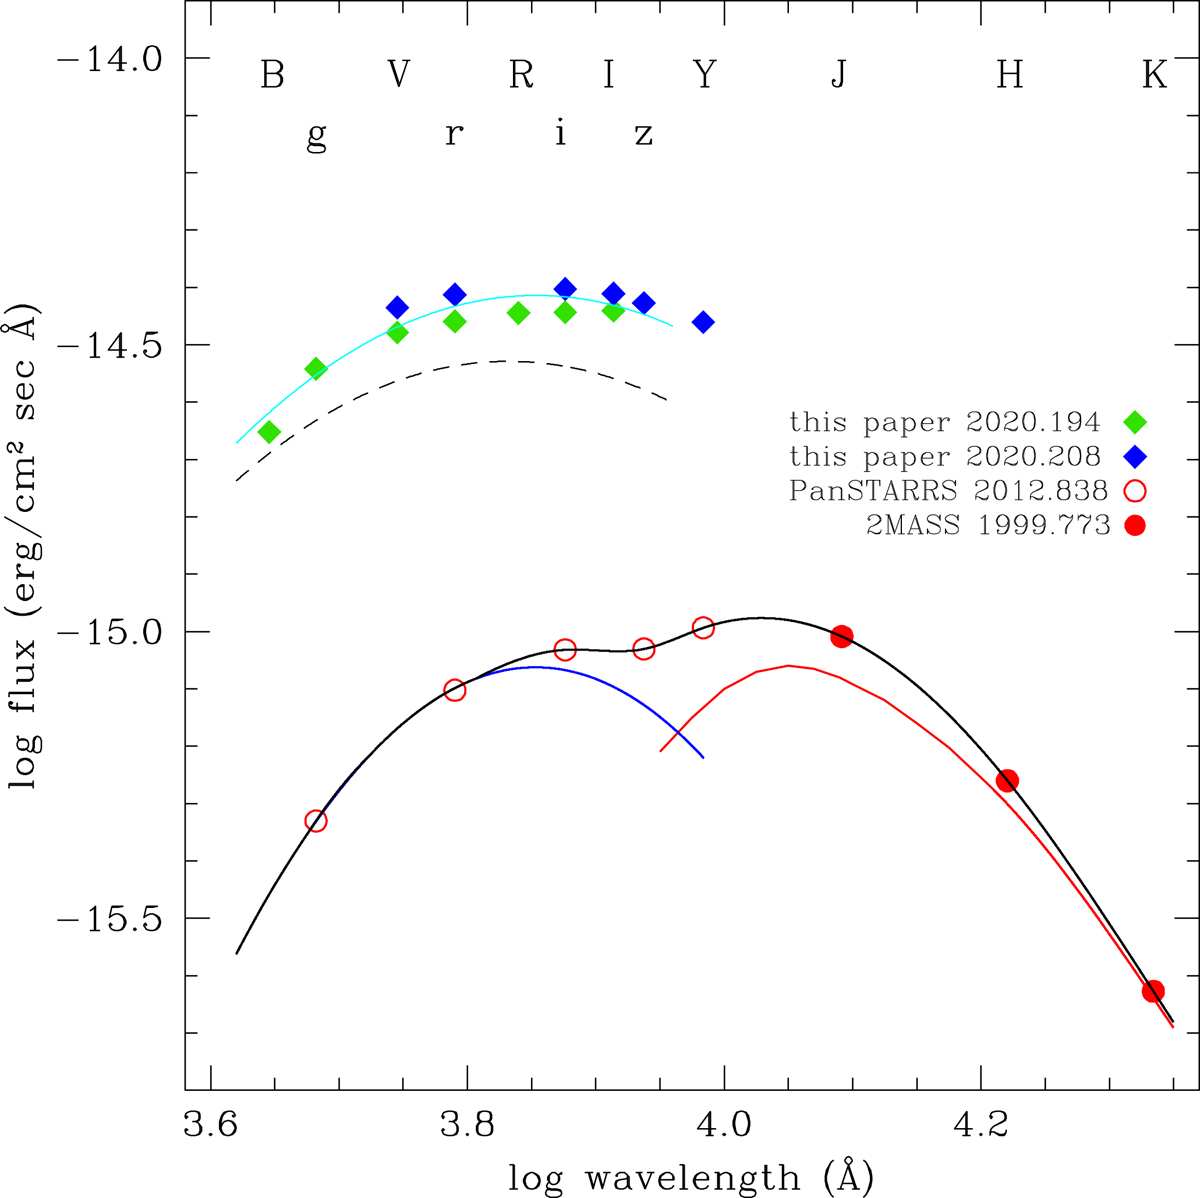
Spectral energy distribution of V392 Per in quiescence (solid black line), split into the hot (blue line) and cool (red line) components, and during SPOB (cyan line). The dashed black line is the difference between the blue and cyan lines and represents the excess emission during the SPOB phase (see Sect. 5).
Current usage metrics show cumulative count of Article Views (full-text article views including HTML views, PDF and ePub downloads, according to the available data) and Abstracts Views on Vision4Press platform.
Data correspond to usage on the plateform after 2015. The current usage metrics is available 48-96 hours after online publication and is updated daily on week days.
Initial download of the metrics may take a while.