| Issue |
A&A
Volume 637, May 2020
|
|
|---|---|---|
| Article Number | A33 | |
| Number of page(s) | 6 | |
| Section | Stellar structure and evolution | |
| DOI | https://doi.org/10.1051/0004-6361/202037515 | |
| Published online | 08 May 2020 | |
The unusual behavior of the young X-ray pulsar SXP 1062 during the 2019 outburst
1
Department of Physics and Astronomy, University of Turku, 20014 Turku, Finland
e-mail: This email address is being protected from spambots. You need JavaScript enabled to view it.
2
Space Research Institute of the Russian Academy of Sciences, Profsoyuznaya Str. 84/32, Moscow 117997, Russia
3
Institut für Astronomie und Astrophysik, Universität Tübingen, Sand 1, 72076 Tübingen, Germany
4
Leiden Observatory, Leiden University, 2300 RA Leiden, The Netherlands
5
Pulkovo Observatory, Russian Academy of Sciences, Saint Petersburg 196140, Russia
6
Max-Planck-Institut für Extraterrestrische Physik, Gießenbachstraße, 85748 Garching, Germany
7
Department of Astronomy, Yale University, PO Box 208101, New Haven, CT 06520-8101, USA
8
Nordita, KTH Royal Institute of Technology and Stockholm University, Roslagstullsbacken 23, 10691 Stockholm, Sweden
Received:
16
January
2020
Accepted:
24
March
2020
Abstract
We present the results of the first dedicated observation of the young X-ray pulsar SXP 1062 in the broad X-ray energy band obtained during its 2019 outburst with the NuSTAR and XMM-Newton observatories. The analysis of the pulse-phase averaged and phase-resolved spectra in the energy band from 0.5 to 70 keV did not reveal any evidence for the presence of a cyclotron line. The spin period of the pulsar was found to have decreased to 979.48 ± 0.06 s implying a ∼10% reduction compared to the last measured period during the monitoring campaign conducted about five years ago, and is puzzling considering that the system apparently has not shown major outbursts ever since. The switch of the pulsar to the spin-up regime supports the common assumption that torques acting on the accreting neutron star are nearly balanced and thus SXP 1062 likely also spins with a period close to the equilibrium value for this system. The current monitoring of the source also revealed a sharp drop in its soft X-ray flux right after the outburst, which is in drastic contrast to the behavior during the previous outburst when the pulsar remained observable for years with only a minor flux decrease after the end of the outburst. This unexpected off state of the source lasted for at most 20 days after which SXP 1062 returned to the level observed during previous campaigns. We discuss this and other findings in context of the modern models of accretion onto strongly magnetized neutron stars.
Key words: accretion, accretion disks / X-rays: binaries / stars: magnetic field / stars: neutron / scattering / pulsars: general
© ESO 2020
1. Introduction
The existence of neutron stars (NSs) with extremely strong magnetic fields in binary systems is a stumbling block of modern astrophysics. From one side, they appear to contradict the standard theory of magnetic field decay (see, e.g., Colpi et al. 2000). From the other, Igoshev & Popov (2018) demonstrated that under certain conditions a very strong magnetic field may survive, allowing the existence of such sources with ages of a few Myr or even older. Observed long spin periods and spin evolution of many systems including SXP 1062 (Shakura 1975; Doroshenko et al. 2010; Shakura et al. 2013) also point to ultra-strong fields in many cases, although ambiguities in theoretical modeling of the torques make it hard to draw definite conclusions here. The detailed investigation of such long spin period pulsars, especially with known ages, is therefore very important and could potentially shed new light on the physics of magnetic field evolution and on the origin of ultra-luminous X-ray pulsars which can be powered by accretion onto NSs with extremely strong magnetic fields (see, e.g., Basko & Sunyaev 1975; Mushtukov et al. 2015).
One of the most promising sources in this respect is SXP 1062 located in the Small Magellanic Cloud (SMC), which is one of the longest-period X-ray pulsars (XRPs) known to date. It was discovered by Hénault-Brunet et al. (2012) and appears to be associated with the supernova remnant (SNR) MCSNR J0127−7332 (Haberl et al. 2012). Hénault-Brunet et al. (2012) established the spectral class of the optical companion in the system as a Be star. The association of the pulsar with the SNR allowed its age to be constrained at 10−40 kyr (Hénault-Brunet et al. 2012; Haberl et al. 2012), making the source a very rare case among high-mass X-ray binaries (for a list of SNR associations, see Maitra et al. 2019). Despite such a young age, the pulsar has a very long spin period of P = 1062 s and it continued to spin down at least until 2014 when the period reached a value of around 1080 s (Sturm et al. 2013; González-Galán et al. 2018).
The origin of such a long period is a matter of intense debate in the literature and is relevant in the context of possible distribution of birth periods and magnetic fields of NSs. Despite the disagreement on the details of the different models, most authors claim that an above-average magnetic field for the neutron star with B ∼ 1013 − 15 G is required to explain properties of the system (Popov & Turolla 2012; Fu & Li 2012; Ikhsanov 2012; Shakura et al. 2013; Serim et al. 2017). Otherwise, an unusually long spin period (at least 0.5 s) at the NS birth was suggested by Haberl et al. (2012). No evidence for a cyclotron resonant scattering feature (CRSF) in the soft X-ray band was found in the XMM-Newton data (Sturm et al. 2013). The search for cyclotron lines above 10 keV is performed in the current work for the first time, and only became possible with the launch of the NuSTAR observatory with its broadband coverage, high sensitivity, and good angular resolution.
The very long spin period of SXP 1062 makes its accurate measurement a very challenging task owing to relatively short available observations (mainly with the Swift/XRT telescope). As a result, different authors provide different interpretations of the same data sets. For instance, using a two-year monitoring of SXP 1062 with different X-ray observatories, Serim et al. (2017) found evidence of a glitch event, which happened about 25 days after the peak of the Type I outburst in the middle of 2014, and even the glitch magnitude was found to be consistent with values predicted by Ducci et al. (2015) for accreting pulsars. At the same time the same data set was interpreted as ordinary spin-up of the NS due to an enhanced accretion rate (González-Galán et al. 2018). Therefore, the timing analysis of the data obtained during the current 2019 outburst is essential to continue monitoring the evolution of the spin period, which was one of the main goals of our work.
An almost two-year orbital period of the binary system (Porb = 656.5 ± 0.5 d; Schmidtke et al. 2012, 2019; González-Galán et al. 2018) and its low flux in quiescence require extremely time-consuming monitoring programs in order to investigate the behavior of the source during the entire orbital cycle. However, these observations were performed with the Swift/XRT telescope between October 2012 and November 2014 (see, e.g., Fig. 1 in González-Galán et al. 2018). In particular, it was found that during the periastron passage of the neutron star, SXP 1062 exhibited a bright outburst with the peak luminosity around 5 × 1037 erg s−1, followed by a decrease to ∼6 × 1036 erg s−1 in ∼100 days. After that the observed flux essentially leveled out, which made the source observable during a complete orbital cycle. The minimum luminosity reached by the pulsar just before the next Type I outburst was ∼1 × 1036 erg s−1. According to the model proposed by Tsygankov et al. (2017), such long-term behavior is typical for slowly rotating XRPs owing to their transition to the stable accretion from the weakly-ionized (“cold”) disk below some critical luminosity Lcold. It is worth noting that this luminosity depends on the inner radius of the accretion disk, and hence can be used as an indirect estimate of the strength of the NS magnetic field.
Here we present the results of the first dedicated observation of SXP 1062 in the broad energy band with the NuSTAR and XMM-Newton observatories. The long exposure allowed us to perform accurate timing and spectral analysis of the source. The obtained results are discussed in the context of the physical models of accretion onto strongly magnetized NSs.
2. Data analysis
SXP 1062 exhibits a very rich phenomenology on different timescales. Therefore, for our research we used archival data as well as observations obtained during the monitoring program initiated by us to study the properties of the source around the 2019 outburst.
The campaign started on 2019 October 5 (MJD 58761.13), with observations using XRT (Burrows et al. 2005) on board the Neil Gehrels Swift Observatory (Gehrels et al. 2004). The main goal of this monitoring was to register the transition of SXP 1062 into the outburst and to trigger a target of opportunity NuSTAR observation. The source was found in a bright state on October 22 (MJD 58778.76; XRT ObsID 00048719112). The next XRT observation (ObsID 00048719113) was performed simultaneously with NuSTAR on October 25 (MJD 58781.85). All XRT data were taken in the photon counting mode. In the observations where the source was significantly detected, the energy flux was estimated by fitting respective spectra extracted using the online tools1 (Evans et al. 2009) provided by the UK Swift Science Data Centre. Images of the field were also obtained with the same tools.
The NuSTAR (Harrison et al. 2013) observation (ObsID 90501344002) with an effective exposure of about 40 ks (with total elapsed time of ∼83 ks) was performed right after the peak of the outburst when SXP 1062 had a luminosity of ∼2.5 × 1037 erg s−1, assuming the distance to the source of d = 60 kpc (this value is used throughout the paper; see Graczyk et al. 2014). The raw data were reduced following the standard procedures described in the NuSTAR user guide, and using the standard NuSTAR Data Analysis Software NUSTARDAS v1.8.0 and the CALDB version 20191008. The source and the background counts were extracted from circular regions with radii of 50″ and 100″, respectively, using the NUPRODUCTS routine. The background region was located in the corner of the same chip.
The data from Swift/XRT and NuSTAR were used in the 0.3−10 and 3−79 keV bands, respectively. To fit the spectra we used the XSPEC package (Arnaud 1996). All spectra were binned to have at least one count per energy bin, and W-statistic2 was applied (Wachter et al. 1979). The spectra from the two NuSTAR telescopes and the simultaneous Swift/XRT observation were modeled together, allowing a free cross-normalization constant to account for possible differences in absolute flux calibration of the individual telescopes. To be able to compare the results of our monitoring with the archival XRT data, they were all reduced in the same manner.
Continuing monitoring of the source with the XRT telescope revealed an abrupt drop in the flux starting from MJD 58788, just three days after the previous detection in the bright state with luminosity slightly above 1037 erg s−1 (ObsID 00048719114). This low-flux interval was covered by three consecutive XRT observations (ObsIDs 00048719115−17). Unfortunately, the exposure of individual pointings (around 1 ks) turned out to be insufficient to detect the source or provide a constraining upper limit on the source flux (typical 3σ upper limit is just ∼5 times less than the flux measured during observation 00048719114). Therefore, we averaged all three observations, which allowed us to increase the total exposure to 3.7 ks. Analysis of the resulting image in 0.3–10 keV range revealed 14 counts inside the aperture with 40″ radius centered at the source position. To estimate the expected background count rate we chose the much larger area defined by the annulus centered at the source position with inner and outer radii of 70″ and 250″, respectively. As a result we detected 100 counts, which can be rescaled to slightly less than 3 counts expected within the source aperture. According to the Poisson statistics, the detected 14 counts with expected background of 3 counts correspond to the detection of the source at 3σ significance level (see, e.g., Gehrels 1986). The same procedure resulted in 62 net counts collected during 1.7 ks exposure in the last bright observation 00048719114. Assuming the same spectral shape in both states, the flux level in the low state was then determined as F0.3 − 10 = 8.5 × 10⁻¹³ erg s−1 cm−2 from rescaling of the corresponding count rates, i.e., a factor of ten lower than during the previous observation.
After the flux drop from the source was discovered in the Swift/XRT data we requested a DDT observation with XMM-Newton. The requested observations (ObsID 0853980901) were performed on 2019 November 21−22 (MJD 58808.88333−58809.28738). EPIC pn and EPIC MOS detectors were operated in the full frame mode with thin filters. The effective exposures for the three main detectors are 17.7 ks (pn), 23.2 ks (MOS1) and 23.7 (MOS2). The data reduction procedures using the latest version of the XMM-Newton SCIENCE ANALYSIS SOFTWARE (SAS; version 18.0) were applied following standard procedures3. Particularly, the data were grade filtered using patterns 0−12 and 0−4 for MOS and pn data, respectively, and FLAG==0 option applied. Circular regions with radii of 15″ and 55″ were chosen to extract the source and the background photons, respectively. The background region was placed close to the source at the same CCD and avoiding other point sources. We also checked the data for the presence of soft proton background flares, but detected none. Ancillary response files (ARFs) were generated for each spectrum using ARFGEN and redistribution matrices were generated using RMFGEN.
3. Results
In order to ensure a detection of SXP 1062 near the maximum of the Type I outburst, we initiated the Swift/XRT monitoring around orbital phase 0.97 (according to the ephemeris derived by Schmidtke et al. 2019). The first two pointings revealed the source in a low-luminosity state around 1 × 1036 erg s−1, as was expected from extrapolation of the source behavior observed during periastron passages in 2012 and 2014 (Fig. 1). The next observation revealed the source in the bright state and triggered the first dedicated observation in hard X-rays with the NuSTAR observatory. The most conspicuous feature of the light curve presented in Fig. 1 is a sharp drop in the flux by about a factor of 10, which happened soon after the outburst peak. Interestingly, the luminosity in this low state is roughly the same as the lowest luminosity observed from the source at the very end of the previous orbital cycle. The following XMM-Newton observation performed about 20 days later (MJD 58809) revealed the source to be at roughly the same luminosity as before the flux drop (shown with the green point). The next observation 23 days later (MJD 58832) was done with the Swift/XRT telescope and found SXP 1062 again with a flux significantly lower than expected based on the previous monitoring of the source in 2012–2014. Interestingly, the observed decrease in the X-ray flux coincides with an unusual behavior of the source light curve in the I band (Schmidtke & Cowley 2020). The light curves in the I band (OGLE data) and in the X-rays are presented in the bottom panel of Fig. 14.
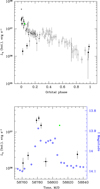 |
Fig. 1. Top: bolometrically corrected orbital light curve of SXP 1062 obtained in 2019 with Swift/XRT (black filled circles) and XMM-Newton (green circle). The original measurements are folded using ephemerides from Schmidtke et al. (2019). Grey open circles and filled squares represent the data obtained over two consecutive orbital cycles covering the period from October 2012 to November 2014. Bottom: zoomed part of the light curve obtained in 2019. The blue open points represent the OGLE data in the I band. |
3.1. Timing analysis
The light curve of SXP 1062 in the 3−79 keV energy band based on the NuSTAR data is shown in Fig. 2. No strong variability except that arising from the pulsations from the source are seen. The averaged count rate after background subtraction is ∼0.35 cnt s−1 in each module. The long exposure and comparatively high flux level allowed us to easily see individual pulses and determine the spin period of the source as Ps = 979.50(7) s using the phase-connection technique (Deeter et al. 1981). Here we used the average pulse profile of the source found by folding of the co-added light curve of the two NuSTAR units in the 3–79 keV energy band with initial period determined using epoch folding as a template, and then determined the time of arrival for each of 56 individual pulses by fitting this template to the light curve. The period was then determined by fitting the times of arrival with a constant period model: tn = n × Pspin. Considering that the folded template also has some uncertainty, this was added as systematic error to individual light-curve points when performing the fit. To account for possible systematic effects associated with the distortion of the template due to error in the initially assumed period, we repeated the entire procedure 100 times assuming periods between 978 and 982 s to obtain the template. The final reported period value and uncertainty are then the mean and the standard deviation of the best-fit values within this sample. No evidence for spin-up was found, which is not surprising given the short duration of the NuSTAR observation and estimated uncertainties for times of arrival for individual pulses (on average ∼17 s). We note that the final period value is about 100 s shorter than was measured during the last long-term monitoring of the source about five years ago (González-Galán et al. 2018).
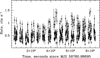 |
Fig. 2. Light curve of SXP 1062 obtained with NuSTAR in the 3–79 keV energy range. The total count rate for both modules is shown with 100 s time binning. |
Using the XMM-Newton data collected 27 days later and following the same techniques, we were able to confirm the long-term spin-up trend discovered with the NuSTAR data. At the same time, the measured period Ps = 981.8(2) (estimated using the same procedure) is somewhat longer than that derived from the NuSTAR observation, implying an average spin-down between the two observations at the level of about −0.085(8) s d−1. The observed spin-down is actually not surprising as the source was apparently accreting at a significantly lower rate for at least one week between the two period measurements (see below).
Folding the X-ray light curves of the source obtained with XMM-Newton and NuSTAR in different energy bands with the corresponding spin periods we were able to study the evolution of the pulse profile shape as a function of energy (Figs. 3 and 4). As can be seen, the pulse profiles during the two observations (and in different energy bands) are quite different. In the XMM-Newton data the pulse profiles are complex consisting of three broad peaks, whereas at higher energies they are very similar in four energy bands from 3 to 79 keV and consist of two main peaks and a plateau around phase 0.5, that can be considered as third, much weaker peak (which was stronger during the XMM-Newton observation at lower energies). Pulsed fraction determined as PF = (Fmax − Fmin)/(Fmax + Fmin), where Fmax and Fmin are maximum and minimum fluxes in the pulse profile, respectively, is quite high (∼40% in the XMM-Newton bands and ∼60% in the NuSTAR data) and does not appear to depend on energy during a given observation.
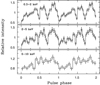 |
Fig. 3. Pulse profile of SXP 1062 in different energy bands from the XMM-Newton observation at luminosity Lbol = 1.4 × 1037 erg s−1. |
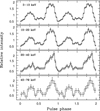 |
Fig. 4. Pulse profile of SXP 1062 in different energy bands from the NuSTAR observation at luminosity Lbol = 2.4 × 1037 erg s−1. |
3.2. Spectral analysis
The spectral properties of SXP 1062 are well studied in the standard X-ray band below ∼10 keV. In particular, it was shown that the spectrum can be described by the standard absorbed power law with the possible presence of a soft excess below 1 keV and an iron Kα emission line at 6.4 keV (see, e.g., Hénault-Brunet et al. 2012; Sturm et al. 2013). Taking into account multiple hints for an ultra-strong magnetic field in SXP 1062, the presence of either electron or proton CRSF in the source spectrum is expected above 10 keV.
The broadband spectrum obtained with the Swift/XRT and NuSTAR instruments turned out to be typical of XRPs and is presented in Fig. 5. The continuum can be modeled with a phenomenological model (like a power law with high-energy exponential cutoff, CUTOFFPL in XSPEC) or with a physically motivated model (e.g., thermal Comptonization, THCOMP in XSPEC). In our analysis we use the more commonly applied CUTOFFPL model, which also has the smallest number of free parameters.
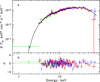 |
Fig. 5. a: broadband spectrum of SXP 1062 from simultaneous Swift/XRT and NuSTAR observations, and b: corresponding residuals from the best-fit model. Green, red, and blue crosses represent data obtained from Swift/XRT, NuSTAR-FPMA/B, respectively. The solid line shows the best-fit model consisting of an absorbed power law with a high-energy cutoff and an iron emission line. |
The continuum was modified with a Gaussian emission line at 6.4 keV to account for the iron line and with photo-electric absorption at low energies (PHABS in XSPEC). To take into account possible differences in absolute normalization in the two NuSTAR modules and the Swift/XRT telescope, cross-normalization constants were introduced into the model. The spectrum can be described well with this simple model and no evidence of any narrow feature that could be associated with a putative cyclotron line was found. The resulting best-fit parameters are NH = (7.4 ± 0.8) × 1022 cm−2, photon index Γ = 0.63 ± 0.06, and e-folding energy Ecut = 18.8 ± 1.2 keV. The position and width of the iron line were frozen at 6.4 keV and 0.01 keV, respectively, resulting in a line flux of (1.1 ± 0.3) × 10−5 erg s−1 cm−2. The C-statistic value for a given approximation is 2052 for 2127 degrees of freedom. The unabsorbed broadband flux F0.3 − 100 keV = (5.6 ± 0.1) × 10−11 erg s−1 cm−2 corresponds to a luminosity L = (2.41 ± 0.05) × 1037 erg s−1.
The observed broadband spectral model was used to determine the bolometric correction Kbol = 3.9 required to convert the fluxes measured with Swift/XRT in the 0.5−10 keV range to the broad 0.5−100 keV range. In our study we assume that this correction factor does not depend on the source luminosity, which appears justified considering the relative stability of the source spectrum in the soft X-ray band (González-Galán et al. 2018). However, this assumption should be taken with caution. Because no broadband spectral data are available at low fluxes, the actual spectrum of SXP 1062 can be slightly softer there, which may result in a smaller bolometric correction factor, and hence lower luminosity.
Because the simultaneous Swift observations were too short, we performed a pulse-phase resolved spectral analysis using only NuSTAR data and the model described above. The absorption column density and the iron line energy and width were fixed to the values derived from the phase-averaged spectrum. The spectra at different pulse phases do not show strong variations, as is also evident from the similarity of the pulse profiles in different energy bands. No features possibly associated with a CRSF were found in the phase-resolved spectra either.
A study of the spectral evolution of the source during the periastron passage in 2014 by González-Galán et al. (2018) revealed that soon after the peak of the outburst the absorption column density had significantly increased for a short time. The authors interpreted this as obscuration of the NS by the Be star disk material. Our current monitoring with the XRT telescope confirms a sharp increase in the NH value from being consistent with zero to (6.8 ± 2.5) × 1022 cm−2 between MJD 58778.76 (ObsID 00048719112) and 58781.85 (ObsID 00048719113), assuming a simple absorbed power-law model. In the following observation the absorption column density was found to keep a low value.
One month after the NuSTAR pointing we observed SXP 1062 with XMM-Newton. The EPIC spectra in the 0.5−10 keV band are described well with a combination of the power-law and blackbody models modified by photo-electric absorption (PHABS(BB+POW) in XSPEC; see Fig. 6). The resulting best-fit parameters are very similar to the results obtained earlier using XMM-Newton data (e.g., Sturm et al. 2013): NH = (0.22 ± 0.02) × 1022 cm−2, the photon index Γ = 0.82 ± 0.02, and the blackbody temperature kTbb = 0.20 ± 0.01 keV with a C-statistic value of 4525 for 4752 degrees of freedom. Because the EPIC pn, MOS1, and MOS2 data were fitted simultaneously, cross-normalization factors were introduced to the model with resulting values consistent with unity within 2–3%. The unabsorbed bolometrically corrected flux from SXP 1062 in this observation is (3.32 ± 0.05) × 10−11 erg s−1 cm−2, which corresponds to a luminosity L = (1.43 ± 0.02) × 1037 erg s−1, i.e., comparable to the NuSTAR observation and an order of magnitude higher than the value obtained from the combination of three preceding XRT observations.
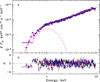 |
Fig. 6. XMM-Newton spectrum of SXP 1062 obtained on MJD 58809 after its re-brightening. The EPIC pn, MOS1, and MOS2 data are shown with black, red, and blue points, respectively. The solid magenta curve corresponds to the best-fit model consisting of the blackbody (shown with the dashed curve) and absorbed power-law components. |
4. Discussion and conclusions
We presented here the results of the long-term monitoring in soft X-rays and the first dedicated observations in the hard X-rays of the young XRP SXP 1062 during its periastron passage in October 2019. The source was found in a bright state on October 22, which coincides with the predictions based on the orbital ephemerides of Schmidtke et al. (2019) derived from the optical photometry of the counterpart. The main results can be summarized as follows:
-
The first broadband spectrum of the source was obtained, and turned out to be typical for accreting pulsars and revealed no features that could be associated with cyclotron lines.
-
The observed pulse profiles show little variation with energy, although comparison of NuSTAR and XMM-Newton data suggests that there is some evolution with flux.
-
The pulsar spin period had decreased by ∼10% from the previous measurements five years before.
-
Soon after the peak of the outburst the accretion rate unexpectedly dropped by an order of magnitude, reaching the lowest value (∼1036 erg s−1) typically observed at the end of the orbital cycle.
-
During an observation about 20 days later, the source re-appeared at roughly the same luminosity and started to decrease its luminosity in the following observation.
The reason for such a strong spin-up of SXP 1062 and its timing are unknown. A natural explanation would be that we missed an outburst activity of the source which led to the transfer of a large amount of angular momentum to the NS. However, the absence of high-quality monitoring X-ray observations covering the time span between 2014 and 2019 imply that this hypothesis cannot be verified based on available data. Here we only note that despite the large absolute spin-up magnitude, the average spin-up rate of ∼0.05 s d−1 is in fact lower than the highest values reported by González-Galán et al. (2018), which were observed, however, over shorter periods of time. Nevertheless, the long-term spin-up in apparent quiescence is very intriguing and is definitely worth further investigation and requires continued monitoring of the source.
Regardless of the physical origin of the spin-up, it was accompanied by an even more puzzling behavior of SXP 1062 during the current outburst. Soon after our NuSTAR observation was completed, we discovered that the source flux dropped by about a factor of 10 for several subsequent XRT observations. The origin of this drop is unclear, with either an occultation or absorption event or an intrinsic drop of the mass accretion rate being the most obvious options. Considering the relatively slow decay of the accretion rate during the previous outburst and rapid restoration to typically observed levels, the former option appears to be more plausible. The NH required to cause an order of magnitude drop of the flux in the 0.3–10 keV range is around 1024 cm−2 (assuming the intrinsic source spectrum is the same as in the peak of the outburst). Although rather high for XRPs, examples of BeXRPs exhibiting similar behavior are known in the literature. For instance, SXP 5.05 in the SMC during the detailed monitoring of its outburst in 2013 with Swift/XRT also revealed strong dips in the X-ray light curve appearing soon after the periastron passage (Coe et al. 2015). The observed absorption column NH reached values as high as few 1023 cm−2. The authors interpreted this behavior as an occultation of the NS by the circumstellar disk around the Be star that is perpendicular to the orbital plane (Coe et al. 2015; Brown et al. 2019), and a similar scenario could be realized for SXP 1062. It is worth noting that the similarity of the behavior between these two sources is not only in the X-ray light curves. In particular, both sources show significant variability in the near-infrared magnitudes clearly associated with the corresponding X-ray flux drops (see I-band light curves in Coe et al. 2015; Schmidtke & Cowley 2020).
Alternatively, the observed flux variations could be associated with intrinsic variations in the accretion rate. Such variability is not uncommon among XRPs; however, in this case it is unclear why the behavior of SXP 1062 changed compared to that during the previous orbital cycle. We note that in addition to possible changes in the structure of the circumstellar disk of the primary, the stability of the accretion can be affected by an interaction of the accretion flow with the magnetosphere. The main difference between the two cycles appears to be the significantly shortened spin period. This suggests that the source must be relatively close to spin equilibrium, and thus the radius of the magnetosphere must be close to the co-rotation radius. One could therefore expect accretion to become unstable at low rates, leading to the onset of the “propeller” effect in the current cycle (Illarionov & Sunyaev 1975; Tsygankov et al. 2016). The available statistics do not allow us to verify whether the accretion indeed switched off completely at some stage during the dip and to estimate the corresponding propeller luminosity. However, it is interesting to compare the observed flux with the theoretically expected transitional luminosity. For B ∼ 1013 − 1015 G it lies in the range ∼1032 − 1036 erg s−1, so a rather extreme field of ∼1015 G would thus be required to explain the observed flux drop as the onset of a propeller at the observed luminosity. We conclude thus that an obscuration of the source by structures in the wind of the primary or simply wind density fluctuations around the pulsar appear to be a more plausible cause for the observed variability.
Acknowledgments
The authors thank the referee for the useful comments and suggestions that helped to improve the paper. This work was supported by the grant 14.W03.31.0021 of the Ministry of Science and Higher Education of the Russian Federation. We also acknowledge the support from the Academy of Finland travel grants 324550 (SST), 316932 (AAL), 322779 (JP), 317552 and 331951 (SST, JP), the Vilho, Yrjö and Kalle Väisälä Foundation (SST), the German Academic Exchange Service (DAAD) travel grants 57405000 and 57525212 (VD), and the Netherlands Organization for Scientific Research Veni Fellowship (AAM). The authors would like to acknowledge networking support by the COST Actions CA16214 and CA16104. We grateful to the NuSTAR, XMM-Newton and Swift teams for approving our TOO/DDT proposals.
References
- Arnaud, K. A. 1996, in Astronomical Data Analysis Software and Systems V, eds. G. H. Jacoby, & J. Barnes (San Francisco: ASP), ASP Conf. Ser., 101, 17 [NASA ADS] [Google Scholar]
- Basko, M. M., & Sunyaev, R. A. 1975, A&A, 42, 311 [NASA ADS] [Google Scholar]
- Brown, R. O., Coe, M. J., Ho, W. C. G., & Okazaki, A. T. 2019, MNRAS, 486, 3078 [NASA ADS] [CrossRef] [Google Scholar]
- Burrows, D. N., Hill, J. E., Nousek, J. A., et al. 2005, Space Sci. Rev., 120, 165 [NASA ADS] [CrossRef] [Google Scholar]
- Coe, M. J., Bartlett, E. S., Bird, A. J., et al. 2015, MNRAS, 447, 2387 [NASA ADS] [CrossRef] [Google Scholar]
- Colpi, M., Geppert, U., & Page, D. 2000, ApJ, 529, L29 [Google Scholar]
- Deeter, J. E., Boynton, P. E., & Pravdo, S. H. 1981, ApJ, 247, 1003 [NASA ADS] [CrossRef] [Google Scholar]
- Doroshenko, V., Santangelo, A., Suleimanov, V., et al. 2010, A&A, 515, A10 [NASA ADS] [CrossRef] [EDP Sciences] [Google Scholar]
- Ducci, L., Pizzochero, P. M., Doroshenko, V., et al. 2015, A&A, 578, A52 [NASA ADS] [CrossRef] [EDP Sciences] [Google Scholar]
- Evans, P. A., Beardmore, A. P., Page, K. L., et al. 2009, MNRAS, 397, 1177 [NASA ADS] [CrossRef] [Google Scholar]
- Fu, L., & Li, X.-D. 2012, ApJ, 757, 171 [NASA ADS] [CrossRef] [Google Scholar]
- Gehrels, N. 1986, ApJ, 303, 336 [NASA ADS] [CrossRef] [Google Scholar]
- Gehrels, N., Chincarini, G., Giommi, P., et al. 2004, ApJ, 611, 1005 [NASA ADS] [CrossRef] [Google Scholar]
- González-Galán, A., Oskinova, L. M., Popov, S. B., et al. 2018, MNRAS, 475, 2809 [NASA ADS] [CrossRef] [Google Scholar]
- Graczyk, D., Pietrzyński, G., Thompson, I. B., et al. 2014, ApJ, 780, 59 [NASA ADS] [CrossRef] [Google Scholar]
- Haberl, F., Sturm, R., Filipović, M. D., Pietsch, W., & Crawford, E. J. 2012, A&A, 537, L1 [NASA ADS] [CrossRef] [EDP Sciences] [Google Scholar]
- Harrison, F. A., Craig, W. W., Christensen, F. E., et al. 2013, ApJ, 770, 103 [NASA ADS] [CrossRef] [Google Scholar]
- Hénault-Brunet, V., Oskinova, L. M., Guerrero, M. A., et al. 2012, MNRAS, 420, L13 [NASA ADS] [Google Scholar]
- Igoshev, A. P., & Popov, S. B. 2018, MNRAS, 473, 3204 [NASA ADS] [CrossRef] [Google Scholar]
- Ikhsanov, N. R. 2012, MNRAS, 424, L39 [NASA ADS] [Google Scholar]
- Illarionov, A. F., & Sunyaev, R. A. 1975, A&A, 39, 185 [NASA ADS] [Google Scholar]
- Maitra, C., Haberl, F., Filipović, M. D., et al. 2019, MNRAS, 490, 5494 [NASA ADS] [CrossRef] [Google Scholar]
- Mushtukov, A. A., Suleimanov, V. F., Tsygankov, S. S., & Poutanen, J. 2015, MNRAS, 454, 2539 [Google Scholar]
- Popov, S. B., & Turolla, R. 2012, MNRAS, 421, L127 [NASA ADS] [Google Scholar]
- Schmidtke, P. C., & Cowley, A. P. 2020, ATel, 13426, 1 [NASA ADS] [Google Scholar]
- Schmidtke, P. C., Cowley, A. P., & Udalski, A. 2012, ATel, 4596, 1 [NASA ADS] [Google Scholar]
- Schmidtke, P. C., Cowley, A. P., & Udalski, A. 2019, ATel, 12890, 1 [NASA ADS] [Google Scholar]
- Serim, M. M., Şahiner, Ç., Çerri-Serim, D., Inam, S., & Baykal, A. 2017, MNRAS, 471, 4982 [NASA ADS] [CrossRef] [Google Scholar]
- Shakura, N. I. 1975, Sov. Astron. Lett., 1, 223 [NASA ADS] [Google Scholar]
- Shakura, N. I., Postnov, K. A., Kochetkova, A. Y., & Hjalmarsdotter, L. 2013, Phys. Usp., 56, 321 [Google Scholar]
- Sturm, R., Haberl, F., Oskinova, L. M., et al. 2013, A&A, 556, A139 [NASA ADS] [CrossRef] [EDP Sciences] [Google Scholar]
- Tsygankov, S. S., Lutovinov, A. A., Doroshenko, V., et al. 2016, A&A, 593, A16 [NASA ADS] [CrossRef] [EDP Sciences] [Google Scholar]
- Tsygankov, S. S., Mushtukov, A. A., Suleimanov, V. F., et al. 2017, A&A, 608, A17 [NASA ADS] [CrossRef] [EDP Sciences] [Google Scholar]
- Udalski, A. 2008, Acta Astron., 58, 187 [NASA ADS] [Google Scholar]
- Wachter, K., Leach, R., & Kellogg, E. 1979, ApJ, 230, 274 [Google Scholar]
All Figures
|
Fig. 1. Top: bolometrically corrected orbital light curve of SXP 1062 obtained in 2019 with Swift/XRT (black filled circles) and XMM-Newton (green circle). The original measurements are folded using ephemerides from Schmidtke et al. (2019). Grey open circles and filled squares represent the data obtained over two consecutive orbital cycles covering the period from October 2012 to November 2014. Bottom: zoomed part of the light curve obtained in 2019. The blue open points represent the OGLE data in the I band. |
| In the text | |
|
Fig. 2. Light curve of SXP 1062 obtained with NuSTAR in the 3–79 keV energy range. The total count rate for both modules is shown with 100 s time binning. |
| In the text | |
|
Fig. 3. Pulse profile of SXP 1062 in different energy bands from the XMM-Newton observation at luminosity Lbol = 1.4 × 1037 erg s−1. |
| In the text | |
|
Fig. 4. Pulse profile of SXP 1062 in different energy bands from the NuSTAR observation at luminosity Lbol = 2.4 × 1037 erg s−1. |
| In the text | |
|
Fig. 5. a: broadband spectrum of SXP 1062 from simultaneous Swift/XRT and NuSTAR observations, and b: corresponding residuals from the best-fit model. Green, red, and blue crosses represent data obtained from Swift/XRT, NuSTAR-FPMA/B, respectively. The solid line shows the best-fit model consisting of an absorbed power law with a high-energy cutoff and an iron emission line. |
| In the text | |
|
Fig. 6. XMM-Newton spectrum of SXP 1062 obtained on MJD 58809 after its re-brightening. The EPIC pn, MOS1, and MOS2 data are shown with black, red, and blue points, respectively. The solid magenta curve corresponds to the best-fit model consisting of the blackbody (shown with the dashed curve) and absorbed power-law components. |
| In the text | |
Current usage metrics show cumulative count of Article Views (full-text article views including HTML views, PDF and ePub downloads, according to the available data) and Abstracts Views on Vision4Press platform.
Data correspond to usage on the plateform after 2015. The current usage metrics is available 48-96 hours after online publication and is updated daily on week days.
Initial download of the metrics may take a while.