Fig. 5.
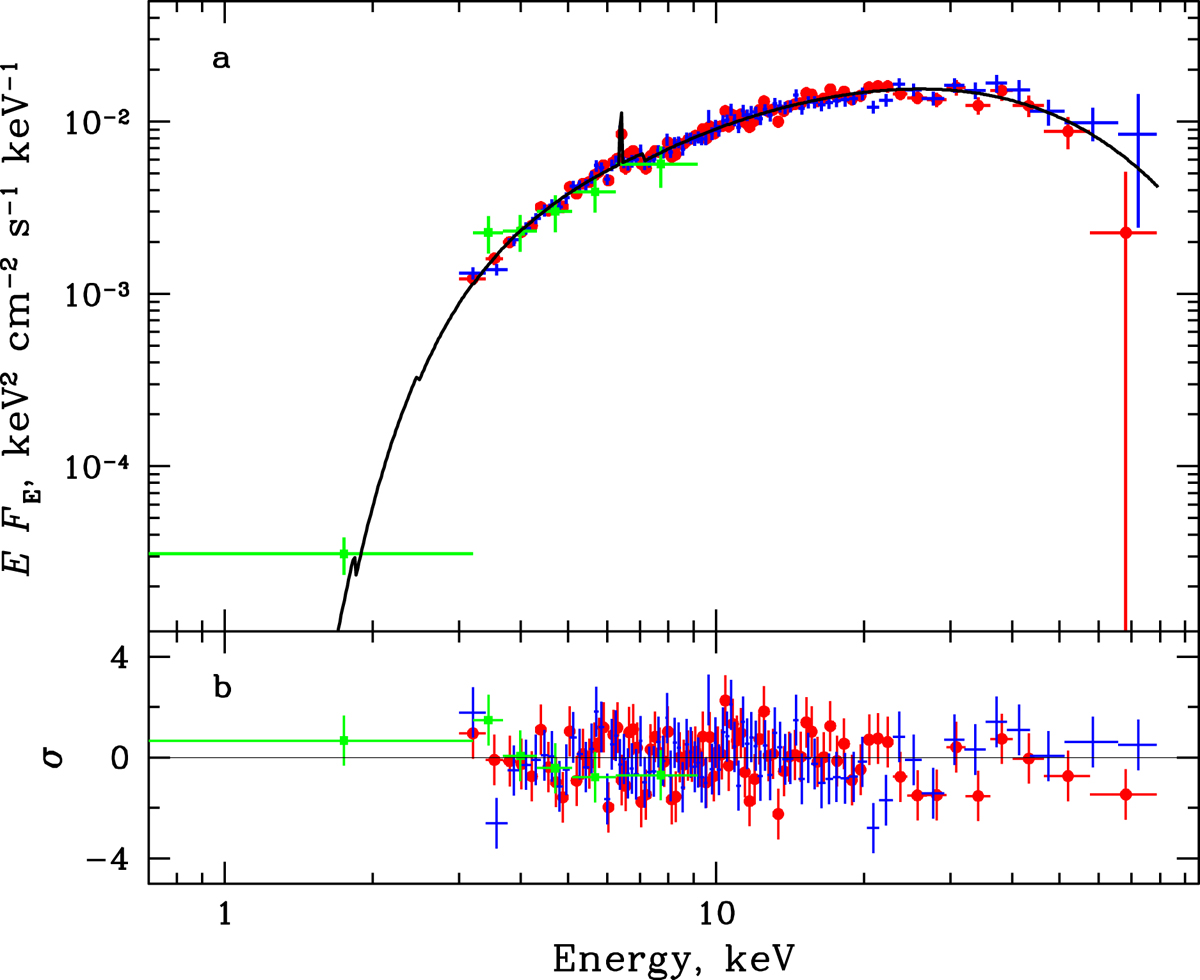
a: broadband spectrum of SXP 1062 from simultaneous Swift/XRT and NuSTAR observations, and b: corresponding residuals from the best-fit model. Green, red, and blue crosses represent data obtained from Swift/XRT, NuSTAR-FPMA/B, respectively. The solid line shows the best-fit model consisting of an absorbed power law with a high-energy cutoff and an iron emission line.
Current usage metrics show cumulative count of Article Views (full-text article views including HTML views, PDF and ePub downloads, according to the available data) and Abstracts Views on Vision4Press platform.
Data correspond to usage on the plateform after 2015. The current usage metrics is available 48-96 hours after online publication and is updated daily on week days.
Initial download of the metrics may take a while.