Free Access
Fig. 6.
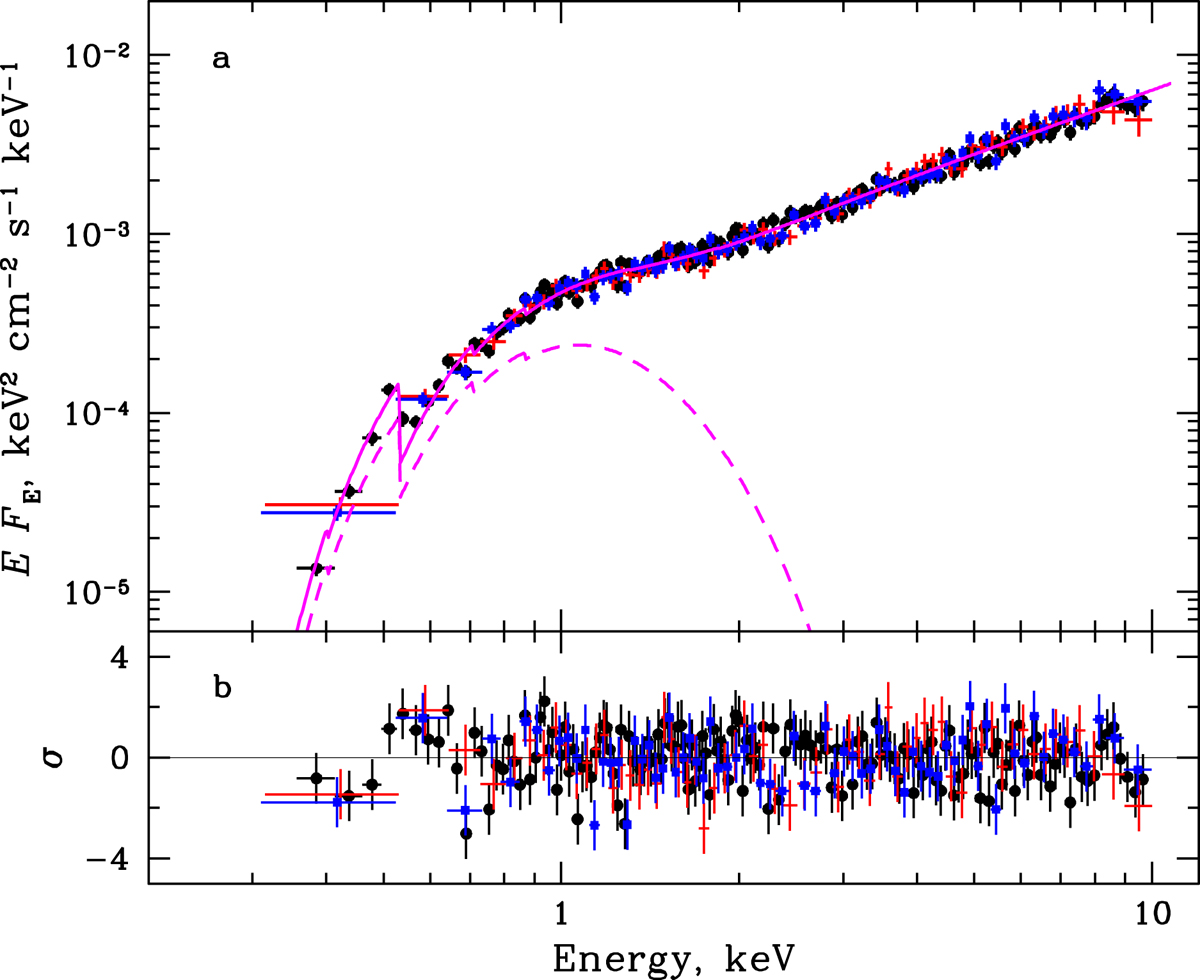
XMM-Newton spectrum of SXP 1062 obtained on MJD 58809 after its re-brightening. The EPIC pn, MOS1, and MOS2 data are shown with black, red, and blue points, respectively. The solid magenta curve corresponds to the best-fit model consisting of the blackbody (shown with the dashed curve) and absorbed power-law components.
Current usage metrics show cumulative count of Article Views (full-text article views including HTML views, PDF and ePub downloads, according to the available data) and Abstracts Views on Vision4Press platform.
Data correspond to usage on the plateform after 2015. The current usage metrics is available 48-96 hours after online publication and is updated daily on week days.
Initial download of the metrics may take a while.