Fig. 1.
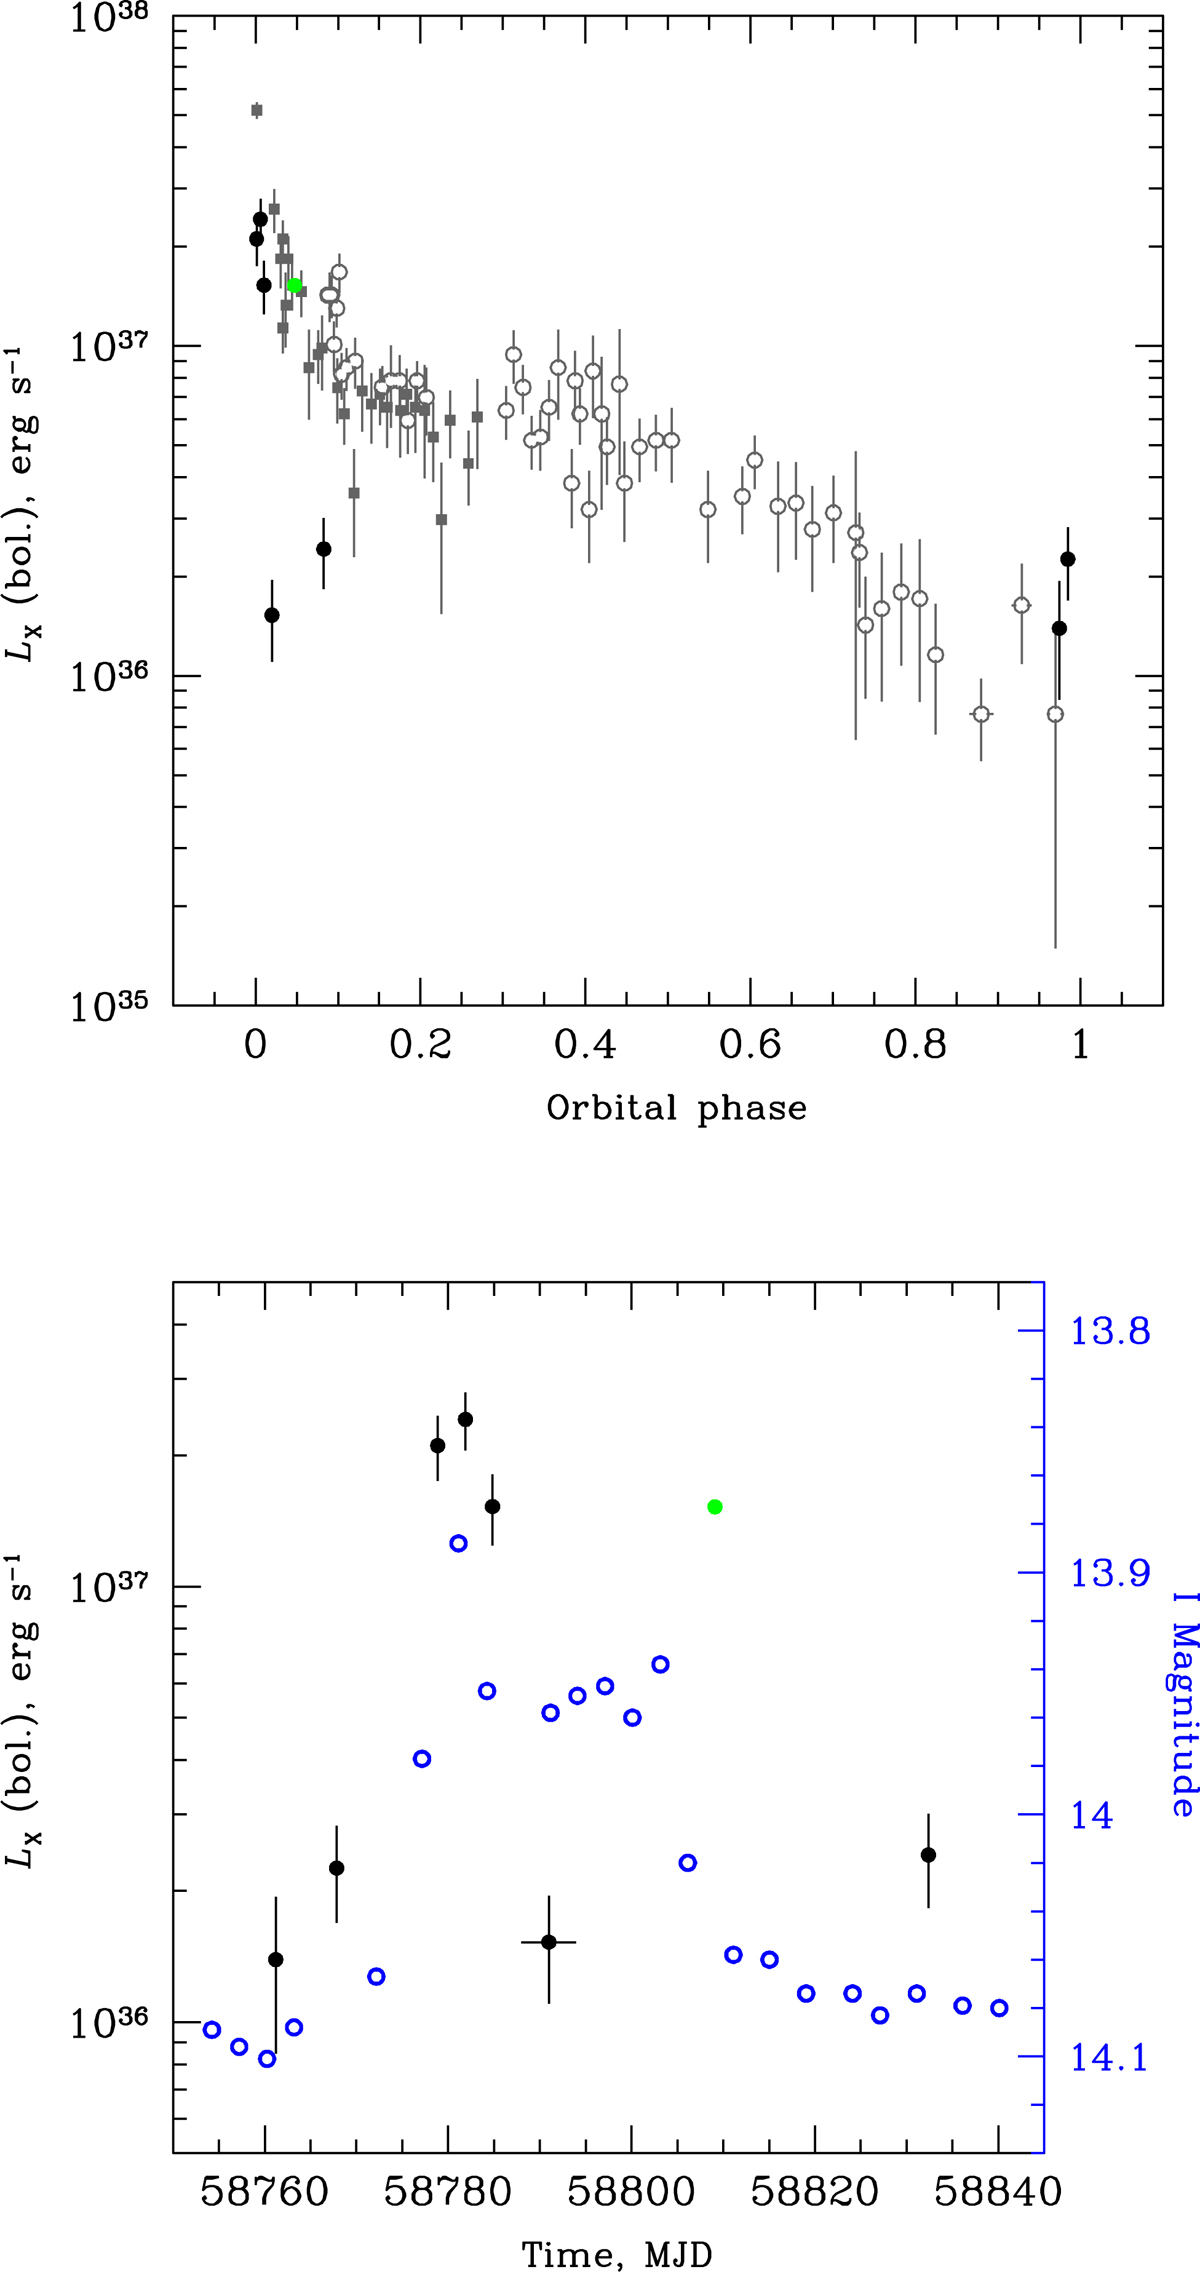
Top: bolometrically corrected orbital light curve of SXP 1062 obtained in 2019 with Swift/XRT (black filled circles) and XMM-Newton (green circle). The original measurements are folded using ephemerides from Schmidtke et al. (2019). Grey open circles and filled squares represent the data obtained over two consecutive orbital cycles covering the period from October 2012 to November 2014. Bottom: zoomed part of the light curve obtained in 2019. The blue open points represent the OGLE data in the I band.
Current usage metrics show cumulative count of Article Views (full-text article views including HTML views, PDF and ePub downloads, according to the available data) and Abstracts Views on Vision4Press platform.
Data correspond to usage on the plateform after 2015. The current usage metrics is available 48-96 hours after online publication and is updated daily on week days.
Initial download of the metrics may take a while.