| Issue |
A&A
Volume 634, February 2020
|
|
|---|---|---|
| Article Number | A99 | |
| Number of page(s) | 12 | |
| Section | Astrophysical processes | |
| DOI | https://doi.org/10.1051/0004-6361/201935666 | |
| Published online | 13 February 2020 | |
The giant outburst of 4U 0115+634 in 2011 with Suzaku and RXTE
Minimizing cyclotron line biases
1
Dr. Karl Remeis-Sternwarte & ECAP, Universität Erlangen-Nürnberg, Sternwartstr. 7, 96049 Bamberg, Germany
e-mail: This email address is being protected from spambots. You need JavaScript enabled to view it.
2
ISDC Data Center for Astrophysics, University of Geneva, 16 chemin d’Écogia, 1290 Versoix, Switzerland
3
Department of Physics, University of Maryland Baltimore County, Baltimore, MD 21250, USA
4
CRESST and NASA Goddard Space Flight Center, Astrophysics Science Division, Code 661, Greenbelt, MD 20771, USA
5
European Space Astronomy Centre (ESA/ESAC), Science Operations Department, Villanueva de la Cañada, Madrid, Spain
6
Center for Astrophysics and Space Sciences, University of California, San Diego, La Jolla, CA 92093, USA
7
Institut für Astronomie und Astrophysik, Universität Tübingen, Sand 1, 72076 Tübingen, Germany
8
Massachusetts Institute of Technology, Kavli Institute for Astrophysics, Cambridge, MA 02139, USA
9
Department of Physics, Makerere University, PO Box 7062, Kampala, Uganda
10
Instituto de Física de Cantabria, CSIC-Universidad de Cantabria, 39005 Santander, Spain
11
Instituto Universitario de Física Aplicada a las Ciencias y las Tecnologías, University of Alicante, PO Box 99, 03080 Alicante, Spain
12
Department of Physics and Astronomy, George Mason University, Fairfax, VA, USA
13
Space Science Division, Naval Research Laboratory, Washington DC 20375, USA
Received:
11
April
2019
Accepted:
13
December
2019
Abstract
We present an analysis of X-ray spectra of the high-mass X-ray binary 4U 0115+634 as observed with Suzaku and RXTE in 2011 July, during the fading phase of a giant X-ray outburst. We used a continuum model consisting of an absorbed cutoff power law and an ad hoc Gaussian emission feature centered around 8.5 keV, which we attribute to cyclotron emission. Our results are consistent with a fundamental cyclotron absorption line centered at ∼10.2 keV for all observed flux ranges. At the same time we rule out significant influence of the 8.5 kev Gaussian on the parameters of the cyclotron resonant scattering feature, which are not consistent with the cyclotron line energies or the depths of previously reported flux-dependent descriptions. We also show that some continuum models can lead to artificial line-like residuals in the analyzed spectra, which are then misinterpreted as unphysically strong cyclotron lines. Specifically, our results do not support the existence of a previously claimed additional cyclotron feature at ∼15 keV. Apart from these features, we find for the first time evidence for a He-like Fe XXV emission line at ∼6.7 keV and weak H-like Fe XXVI emission close to ∼7.0 keV.
Key words: X-rays: binaries / pulsars: individual: 4U 0115+634 / magnetic fields / accretion, accretion disks
© ESO 2020
1. Introduction
Be X-ray binaries (BeXRBs) consist of a neutron star and a Be-type companion star and are a subclass of high-mass X-ray binaries (HMXBs). Mass transfer from the equatorial disk of the optical companion onto the neutron star leads to violent X-ray outbursts. These outbursts are classified either as regular type I outbursts associated with the periastron passage of the neutron star, or giant, type II outbursts which are stochastic and less frequent (see, e.g., Finger & Prince 1997) and due to strong mass transfer onto the compact object. Once the transferred matter has reached the Alfvén radius of the neutron star, it follows the magnetic field lines of the compact object and is channeled onto the magnetic poles of the neutron star (Lamb et al. 1973). Due to the strong surface magnetic fields of neutron stars on the order of a few 1012 G, the energy of the electrons perpendicular to the direction of the B-field is quantized in discrete Landau levels. Resonant scattering processes of X-ray photons with these electrons results in cyclotron resonance scattering features (CRSFs, or cyclotron lines) in the X-ray spectra of some X-ray pulsars. The cyclotron line energy is a function of the magnetic field strength at the emission region. The respective energies of the fundamental and harmonic CRSFs are given by the 12-B-12 rule, that is, ECRSF, 0 ∼ 11.6 keV × B/1012 G (e.g., Mészáros 1992; Caballero & Wilms 2012; Staubert et al. 2019) and multiples.
The source 4U 0115+634 consists of a neutron star with a pulse period of ∼3.6 s (Cominsky et al. 1978) which is in a ∼24.3 d orbit (Bildsten et al. 1997) with its Be-type companion V635 Cas (Negueruela & Okazaki 2001). Since its discovery with the Uhuru satellite (Giacconi et al. 1972), it has displayed sporadic type II outbursts which are separated by several years of quiescence (Müller et al. 2013, hereafter M13). These outbursts typically last one to two months (e.g., Tamura et al. 1992; Heindl et al. 1999; Nakajima et al. 2006; Tsygankov et al. 2007; M13). The observed value of the fundamental cyclotron line energy for 4U 0115+634 of ∼11 keV (White et al. 1983; see Wheaton et al. 1979 for the first detection of a CRSF in 4U 0115+634, which was actually the harmonic at ∼20.1 keV) is rather low compared to other known cyclotron line sources (see, e.g., Staubert et al. 2019). However, in contrast, no source other than 4U 0115+634 is known to show four additional cyclotron line harmonics in its spectrum (Heindl et al. 1999; Santangelo et al. 1999; Ferrigno et al. 2009), making this source an ideal target for testing theories on the luminosity dependency of the cyclotron line energy, which traces the magnetic field at the location where most of the X-rays are emitted.
As widely discussed in the literature, there are at least two accretion regimes for X-ray pulsars, which are separated by the so-called critical luminosity Lcrit (e.g., Basko & Sunyaev 1976; Staubert et al. 2007; Becker et al. 2012; Mushtukov et al. 2015; Postnov et al. 2015, and references therein). Sources at lower accretion rates, that is, sources with X-ray luminosities LX ≲ Lcrit, are expected to exhibit a positive correlation between ECRSF, 0 and LX (e.g., Her X-1, Staubert et al. 2007, GX 304−1, Klochkov et al. 2012; Rothschild et al. 2017). Here, as the mass accretion rate increases the accretion column decreases in height, and therefore the X-rays are emitted in regions where the local B-field is larger. In contrast, for sources where LX ≳ Lcrit a negative correlation is expected (e.g., V 0332+53, Tsygankov et al. 2006; Mowlavi et al. 2006), that is, higher mass accretion rates lead to larger accretion columns. 4U 0115+634 had originally been seen as the prototype for this group of high-luminosity sources (e.g., Nakajima et al. 2006; Tsygankov et al. 2007; Müller et al. 2010; Li et al. 2012). However, M13 showed that the inferred behavior of the cyclotron line in 4U 0115+634 strongly depends on the choice of the broadband continuum model used to describe the X-ray spectra. Specifically, M13 showed that if the popular negative and positive exponent power-law (NPEX) model is used to describe data from 4U 0115+634, strong cyclotron lines are found. However, the model components corresponding to these lines do not describe the actual shapes of the cyclotron lines, but rather erroneously model part of the underlying continuum emission. Since the continuum shape of 4U 0115+634 is luminosity-dependent, the result is the strong cyclotron line variability claimed in many earlier papers. In contrast, the model used by M13 results in a constant cyclotron line energy for all observed flux levels in 4U 0115+634, that is, the previously observed anti-correlation vanishes. The dependency of the cyclotron line parameters on the continuum model was later confirmed by Boldin et al. (2013).
Here, we present an analysis of data taken during a giant outburst of 4U 0115+634 in 2011 with Suzaku and RXTE. These data were previously analyzed by Iyer et al. (2015), who claim the detection of complex and strong cyclotron lines. In Sect. 2 we summarize the observations and describe the data-extraction process. In Sect. 3 we present the results of the spectral analysis of the X-ray spectra. Specifically, we show in Sect. 4 that unphysically strong and complex cyclotron lines are not needed to describe the data, and that these strong lines imply a much larger intrinsic source continuum flux than is observed. Using the continuum model of M13 on the other hand results in more physical cyclotron lines that are consistent with earlier measurements. We summarize our results and draw conclusions in Sect. 5.
2. Observations and data reduction
The 2011 outburst of 4U 0115+634 started on June 10 (MJD 55722), after more than three years of quiescence, at which point MAXI-GSC detected a significant increase of the X-ray flux (Yamamoto et al. 2011). The outburst lasted about 40 days and exceeded a flux of ∼300 mCrab in the 15–50 keV band of the BAT instrument onboard the Neil Gehrels Swift Observatory (Fig. 1; Krimm et al. 2013). The source was observed by Suzaku on 2011 July 5 (Obs-ID 406048010, 24 ks, epoch I in the remainder of this work) and 2011 July 8 (Obs-ID 406049010, 42 ks, epoch II in the remainder of this work). During the latter observation, RXTE observed 4U 0115+634 twice (see Fig. 1; Obs-IDs 96032-01-04-00 and -01, 13 ks and 1 ks, respectively).
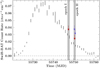 |
Fig. 1. Swift-BAT daily light curve of 4U 0115+634 (15–50 keV) during its 2011 June/July outburst. The arrows mark the midtimes of the observations by Suzaku (red) and RXTE (blue). The defined data epochs I and II are indicated by vertical gray bands. |
Suzaku had two main detector assemblies. The X-Ray Imaging Spectrometer (XIS, Koyama et al. 2007) consisted of four Si-based X-ray charge coupled device (CCD) cameras, XIS0–XIS3, where XIS2 was no longer operational since a micro-meteorite hit in 20061. The three remaining CCDs covered the energy range between 0.2 and 12 keV. The Hard X-Ray Detector (HXD, Takahashi et al. 2007) extended the energy range of Suzaku up to ∼600 keV and consisted of two instruments: the PIN silicon diodes (PIN) were mainly sensitive below ∼60 keV, while the GSO/BGO phoswich counter (GSO) was sensitive above ∼40 keV.
The event data of both observations were reprocessed by aepipeline as provided by the HEASOFT software package (v. 6.25). The version of the HEASARC calibration database (CALDB) used for the X-ray telescopes (XRT) was 20110630, for the XIS 20181010 and for the HXD 20110913.
First, we corrected the attitude using aeattcor2 and applied the result to the XIS events using xiscoord. The images extracted using xselect were checked for pile-up using pileest called with a grade migration parameter (alpha) of 0.5. We used the pile-up-images to create extraction regions for each XIS and editing mode as follows: the source region was represented by an annulus with a 90″ outer radius. To avoid pile-up fractions above 4% the inner radius had to be 45″ for observation 406048010 and 55″ for 406049010. The larger excluding radius is a result of the overall increased pile-up fraction during the second observation, although the source was weaker compared to the first observation (compare Fig. 1). This is due to the fact that the XIS normal clock mode options were set to 1/4 window burst during the first observation, while the burst option was removed during the second, which doubled the exposure time per frame from 1 s to 2 s. The two background regions for each XIS and mode were circles with a radius of 60″ located near the borders of the chips. After having extracted the events filtered by these regions using xselect, we added the spectra of the different editing modes.
For spectral analysis, we used data from XIS0, XIS1, and XIS3 in the energy range 0.8–9 keV. The recent calibration update (20181010) focused on improving known calibration features around the Si K edge at ∼1.84 keV (Okazaki et al. 2018). This update introduced a jump in the relation of the incident photon energy and pulse height, which was attributed to charge losses in the depletion layer of the CCDs. We investigated the updated calibration and found that significant residuals around the Si K edge are no longer present in the spectra of XIS0 and XIS3 for both considered observations (see Fig. A.1). Furthermore, the new calibration seems to reduce calibration features around the Au M edge at 2.22 keV in these XISs as well2. Unfortunately, the residuals around both features are still present in XIS1 (see Fig. A.1). Thus, we excluded the energy ranges 1.73–1.95 keV and 2.16–2.37 keV for XIS1 during the analysis. The spectra were rebinned according to Nowak et al. (2011), such that each energy bin has a signal-to-noise ratio (S/N) of 8 at least and a minimum number of channels close to the half-width half-maximum of the spectral resolution. Data from the PIN instrument were used in the energy range 16–55 keV for spectral fitting and rebinned to a S/N of 5.
The non X-ray background (NXB) spectral extraction based on model events and the cosmic X-ray background (CXB) simulation were performed using the hxdpinxbpi tool. To obtain a background spectrum of the PIN, we combined the version 2.0 of the “tuned” NXB and the CXB, which was simulated using the model as described in Boldt (1987). As PIN response we used the epoch 11 response file (20110601) for the XIS nominal position. Because of an insufficient S/N, we did not use the data from the GSO instrument of the HXD.
For the analysis of RXTE data, data from the top layer of unit 2 of the Proportional Counter Array (PCA, Jahoda et al. 2006) were used. Since the launch of RXTE in 1995 until the 2011 outburst of 4U 0115+634, the calibration of the remaining Proportional Counter Units (PCUs) became complicated with the aging of the instruments. Nevertheless, PCU2 is still known as the best-calibrated unit (Jahoda et al. 2006). The spectra of both observations, which were performed during the second Suzaku observation (epoch II), were reduced using the HEASOFT software package (v. 6.25) and standard data-reduction pipelines (Wilms et al. 2006, and references therein). The event times were filtered excluding the first 30 min since the start of the South Atlantic Anomaly (SAA) passages and with an elevation angle of greater than 10° above the Earth’s limb. After having combined the spectra of both observations, we added 1% systematic uncertainties to all channels below 7 keV (see Fig. A.2) due to calibration issues near the Xe L-edge at 4.5 keV, uncertainties in the PCA background estimation (Jahoda et al. 2006), or possible inaccurately assigned energies to the channel boundaries (García et al. 2014). Channels in the energy range of 3.5 keV–50 keV were used for spectral analysis and were grouped into bins with a minimum S/N of 1. Data from the High Energy X-ray Timing Experiment (HEXTE, Rothschild et al. 1998) were not used here since the rocking mechanism, which is crucial to measure the detector background, was switched off completely in 2010 April.
3. Spectral analysis
Data modeling in this work was performed with the Interactive Spectral Interpretation System (ISIS, Houck & Denicola 2000) version 1.6.2-41. All uncertainties are given at the 90% confidence level unless stated otherwise.
3.1. Spectral model
We used the same approach as M13 to model the broadband X-ray spectra of 4U 0115+634: a cutoff power law, called CutoffPL in ISIS and XSPEC (Arnaud 1996), which has the form
 (1)
(1)
with the photon index, Γ, and the folding energy Efold. We normalized the CutoffPL model to the unabsorbed photon flux, FPL, integrated over the 3–50 keV energy range. The cutoff power law was modified by a broad Gaussian emission feature around 8.5 keV. This is more commonly known as the “10 keV feature” and has been observed in 4U 0115+634 before (see, e.g., Ferrigno et al. 2009; Müller et al. 2012) and in many other X-ray pulsars (see, e.g., Coburn et al. 2002), even though the origin of this feature is still under discussion and remains unclear. Here, the normalization of the Gaussian corresponds to its bolometric photon flux, F10 keV (technically derived by integrating over the 1–25 keV energy range).
We modeled the various cyclotron lines present in the spectra of 4U 0115+634 using two models implementing different line profiles of the absorption line-like features. The first model, CYCLABS, represents pseudo-Lorentzian profiles given by (Mihara et al. 1990):
 (2)
(2)
where ECRSF is the centroid energy, WCRSF is the width of the feature, and τCRSF is the optical depth. The second model, GABS, implements a Gaussian optical depth profile given by3
 (3)
(3)
where DCRSF is the strength and σCRSF the Gaussian width of the cyclotron line. In the remainder of this paper, we label the parameters of the cyclotron lines for both models with the number of the respective harmonic, where “0” denotes the fundamental line.
We emphasize that the cyclotron line strength, DCRSF, of the GABS model is not the optical depth at line center. At E = ECRSF the optical depth is
 (4)
(4)
which is equivalent to the optical depth parameter of the CYCLABS model, τCRSF. In a similar manner, the width parameters WCRSF and σCRSF are related to each other, but not identical.
The Suzaku-XIS spectra also show source intrinsic emission lines of iron between 6 keV and 7 keV. We modeled these lines using Gaussians with their centroid energies, EFe, widths, σFe, and equivalent widths, EWFe, as a measure of their X-ray flux. We label these parameters further according to the observed transition or ion; for example, Kα or XXV. The calculation of the equivalent widths was based on the unabsorbed model flux, that is, the source intrinsic flux.
In order to account for the interstellar absorption affecting primarily the XIS spectra, we used tbnew, an updated version of tbabs 4, incorporating abundances by Wilms et al. (2000) and cross sections by Verner & Yakovlev (1995). The equivalent hydrogen column density is denoted as NH.
Since the flux normalizations of the different instruments are not perfectly known, we introduced the cross-calibration constants cXIS0, cXIS1, cXIS3 and cPIN. We chose XIS3 to be the reference instrument and thus set cXIS3 = 1. To account for the cross calibration between the Suzaku and RXTE data, we introduced the constant cPCA referring to the combined spectrum of the two PCA observations.
3.2. Modeling strategy
The fundamental cyclotron line of 4U 0115+634 is known to be around 11 keV (White et al. 1983). Unfortunately, this energy is within the data gap between Suzaku-XIS and -PIN, that is, between 9 and 16 keV. Therefore, in order to avoid a fit degeneracy between this cyclotron line and the remaining spectral parameters of 4U 0115+634, we first performed a simultaneous fit of epoch II, where RXTE observed the source twice during the corresponding Suzaku observation.
We used the continuum parameters of M13 as initial values for the fit. Using a pure continuum model without any emission lines or CRSFs, emission line-like residuals at 6–7 keV and broad absorption line-like residuals around ∼11 keV, ∼22 keV, and ∼33 keV are visible (see insets and panels b of Fig. 2, respectively). The absorption features represent the fundamental CRSF and two of its higher harmonics. Therefore, we added three cyclotron line features to our model using two different descriptions, the CYCLABS-model (Eq. (2)) and the GABS-model (Eq. (3)), resulting in two separate fits. Following M13 we fixed the width in both fits (WCRSF and σCRSF, respectively) of the fundamental, the first, and second harmonic CRSF to 2 keV, 2 keV, and 4 keV, respectively, to avoid parameter degeneracies with the continuum parameters.
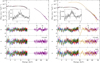 |
Fig. 2. Observed spectra and best-fit model of epoch I (left) and epoch II (right). The two panels marked (a) show the Suzaku spectra (XIS0: green; XIS1: red; XIS3: blue; PIN: purple) and in case of epoch II (right) the combined RXTE spectrum (PCA: orange). The black line is the best-fit model. Each inset zooms into the iron line region between 5 and 8 keV and shows the residual flux with respect to a model without any fluorescence lines. The modeled fluorescence lines are shown in gray. Panels marked (b) show the residuals of a fit to a model without the cyclotron lines included. The arrows labeled En mark the best-fit position of the nth cyclotron line (if significant within the error bars, see Table 1). Panels c and d: residuals of our best-fits using CYCLABS and GABS to model the cyclotron lines, respectively. |
In order to model the emission of iron at 6–7 keV we added a single Gaussian to the model. After an initial fit we found a centroid energy of  keV, which is not consistent with emission from neutral iron at 6.4 keV. Its width of
  eV is too broad to be intrinsically narrow and therefore is due to the astrophysics of the source. In epoch I the Gaussian’s width of
  eV is even broader. Such broad iron lines are usually not observed in HMXBs (σFe ≲ 150 eV, see, e.g., Giménez-García et al. 2015 or Torrejón et al. 2010 for comprehensive studies). In a Chandra observation of the BeXRB A 0535+262, Reynolds & Miller (2010) discovered fluorescence lines from highly ionized iron besides a narrow emission line from neutral iron. In a spectrum recorded by an X-ray instrument with lower spectral resolution, these lines would blend into a single broad emission line at a higher centroid energy than 6.4 keV as we found here for 4U 0115+634. We thus replaced the single broad Gaussian with two Gaussians with a fixed width of 1 eV, that is, the emission lines can be considered to be intrinsically narrow as expected. The centroid energies of these lines of ∼6.4 keV and ∼6.7 keV (see Table 1) are consistent with fluorescent Kα emission from neutral Fe and He-like Fe XXV, respectively. Finally, we accounted for the contribution of an iron Kβ transition by adding a Gaussian with its centroid energy and equivalent width tied relative to the fit parameters of the neutral Kα emission line (EFe Kβ = EFe Kα + 0.656 keV and EWFe Kβ = 0.16 × EWFe Kα, respectively).
Our final model is able to describe the combined fit of the Suzaku and RXTE data of epoch II well ( = 1.44 with 574 degrees of freedom, d.o.f., using CYCLABS;
  = 1.51 with 574 d.o.f. using GABS). The best-fit parameters are listed in Table 1.
Final parameters of the spectral analysis.
We then performed a fit to the epoch I data, consisting of a single Suzaku observation, with the initial parameters provided by the best-fit model from epoch II. We fixed the parameters of the fundamental CRSF, as it lies in the gap between the XIS and PIN. While the epoch II model fits the epoch I data acceptably well for the most part, there are some additional weak line-like residuals around 7 keV in the XIS spectrum requiring a fourth narrow Gaussian to be added to the model. We associate this emission with H-like Fe XXVI. The final best-fit to the data of epoch I again results in a good description of the data ( = 1.29 with 516 d.o.f. using CYCLABS;
  = 1.29 with 516 d.o.f. using GABS). See Table 1 for the final fit parameters for both epochs and Fig. 2 for the observed spectra and corresponding model.
3.3. Significances and parameter degeneracies
In order to estimate the significance of the emission feature of ionized iron, we simulated N = 4000 spectra for each epoch on the basis of our model while excluding the corresponding Gaussian component. The neutral Kα line has been included in the simulated spectra and for the significance calculation of Fe XXVI in epoch 1 the Fe XXV line has been included as well. Each simulated spectrum was then fitted once without and once including the Gaussian component. An improvement in the fit goodness, Δ , higher than the observed Δχ2 was then counted as a false positive detection. No false positives were found for He-like Fe XXV around 6.7 keV in epoch I or epoch II (Δχ2 = 65.86 with 516 d.o.f. and Δχ2 = 24.51 with 574 d.o.f., respectively) corresponding to significances of ≥3.66σ for both epochs. For H-like Fe XXVI in epoch I, 16 false positives were found in the simulation (Δχ2 = 8.9 with 516 d.o.f.), which corresponds to a significance of ∼2.87σ.
We investigated the strength of possible parameter degeneracies between the fundamental cyclotron line around 10.2 keV and the 8.5 keV Gaussian, that is, the 10 keV feature (see Sect. 4.3 for its detailed discussion). This investigation is possible for epoch II only due to the fixed CRSF parameters during epoch I. In order to reveal any possible degeneracies we sampled the parameter space using a Markov chain Monte Carlo (MCMC) method after Goodman & Weare (2010). We used the implementation emcee by Foreman-Mackey et al. (2013), which has been ported into ISIS by M. A. Nowak5. We used 2000 iteration steps and 100 walkers per free parameter, which were initially distributed randomly within the allowed parameter space. The algorithm converged after 1200 steps and thus the first 60% of the parameter chain was ignored in the following. After having investigated all possible 2D probability distributions of the chain, we do not find significant degeneracy between the Gaussian’s width or flux with the CRSFs parameters. The only significant degeneracies we find, as shown in Fig. 3, were present between the Gaussian’s centroid energy, E10 keV, and the fundamental cyclotron line energy, ECRSF, 0, and its depth, τCRSF, 0 (CYCLABS) or DCRSF, 0 (GABS). The best-fit parameter values found by χ2-minimization (crosses in Fig. 3) are in very good agreement with the MCMC contours. Their respective uncertainties as derived from the χ2-landscape are however too symmetric compared to the elliptical contour shapes. For the remainder of this work, we therefore consider the uncertainties of the Gaussian’s centroid energy, E10 keV, the fundamental cyclotron line energy, ECRSF, 0, and its depth, τCRSF, 0, during epoch II to be larger by a factor of two in order to cover the asymmetric MCMC contours. However, we note that even without increasing the uncertainties, the degeneracies do not bias our discussions and conclusions in the following sections. The contours further show a shift of +0.15 keV in the Gaussian’s centroid energy when using the GABS CRSF model instead of the CYCLABS model. However, this is negligible compared to the uncertainty of the Gaussian’s centroid energy and does not bias our discussions either.
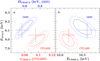 |
Fig. 3. Two-dimensional probability contours between the fitted parameters of the fundamental cyclotron line (a depth, τCRSF, 0 (CYCLABS) and DCRSF, 0 (GABS); b energy, ECRSF, 0) and the centroid energy, E10 keV, of the 10 keV feature calculated by a MCMC method for epoch II and both CRSF models (CYCLABS, red; GABS, blue). The contours correspond to the 68% (solid line), 90% (dashed line), and 99% confidence levels (dotted line) according to the MCMC walker distribution. The crosses are our best-fit parameters and their uncertainties using χ2-minimization (see Table 1). |
4. Discussion
During the following discussions, the luminosity, L, and the mass-accretion rate, Ṁ, of 4U 0115+634 are needed. From the measured fluxes FPL and F10 keV of the power law and the 10 keV feature, respectively (see Table 1), we calculated the total 3–50 keV luminosity of 3.5 × 1037 erg s−1 and 2.5 × 1037 erg s−1 during epoch I and epoch II, respectively, using the distance of  kpc determined by Bailer-Jones et al. (2018) from the Gaia DR2 parallax measurements and consistent with earlier distance estimates of 7 kpc (Negueruela & Okazaki 2001; Riquelme et al. 2012). Assuming that all potential energy is released into radiation, we calculated the mass-accretion rate,
 (5)
(5)
during epoch I and epoch II to be 1.9 × 10¹⁷ g s−1 and 1.3 × 10¹⁷ g s−1, respectively, assuming a neutron star radius of R = 106 cm and a mass of M = 1.4 M⊙ of the neutron star.
4.1. Iron line region
The feature causing the emission residuals at ∼6–7 keV, displayed in more detail in the inset of Fig. 2, has previously been modeled by a single Gaussian using data of coarse spectral resolution (RXTE-PCA, E/ΔE ≈ 6 in the iron line region). The feature has been interpreted as a narrow iron Kα fluorescence line at ∼6.4 keV with an equivalent width of ∼50–60 eV (M13) or larger (e.g., Tsygankov et al. 2007; Li et al. 2012; Boldin et al. 2013).
Due to the improved energy resolution of the Suzaku-XIS spectra (E/ΔE ≈ 50 in the iron line region) compared to earlier observations, we found the line centroid energy to be blueshifted by 160−210 eV with respect to neutral iron Kα emission and an intrinsic broadening of the line by σFe ≈ 200−400 eV (see Table 1 for the values of both data epochs). As argued during the spectral analysis (Sect. 3.2) we proposed that this emission is actually a blend of two or three emission lines by highly ionized iron rather than a single blueshifted and broad neutral iron Kα line. In an alternative scenario, the neutral iron line would originate from material around the neutron star, such as for example an accretion disk where its intrinsic rotation causes a broadening of the line. However, in the following we show that this scenario is in contradiction with the observed blueshift of the line centroid energy.
Emission lines emerging from an accretion disk should be Doppler shifted according to the binary motion. The orbital velocity of the neutron star projected on the line of sight,
 (6)
(6)
depends on the projected semimajor axis, a sin i, where i is the inclination of the orbital plane, Porb is the orbital period, e is the eccentricity, ω is the longitude of periastron, and θ(t) is the true anomaly, which is found by solving Kepler’s equation. Using the orbital parameters6 of 4U 0115+634, we calculated the Doppler shift ΔE = Erestv(t)/c, where Erest = 6.4 keV is the emission line energy at rest, c the speed of light, and t at the time of the Suzaku observations, to ΔE ≈ 3 eV. This is orders of magnitude weaker than the observed shift of 210(70) eV (epoch I) or 160(60) eV (epoch II) and is therefore in contradiction to line emission from an accretion disk.
4.2. CYCLABS versus GABS
We analyzed the spectra using two different models, CYCLABS (Eq. (2)) and GABS (Eq. (3)), for the shape of the CRSFs. The corresponding best-fit parameters for the three CRSFs detected in the data are in good agreement among both models (see Table 1): the optical depths and line strengths follow Eq. (4) within 2σ confidence and the centroid energies for the higher harmonics agree within 1.2σ confidence. The fundamental CRSF energy in epoch II seems to differ by 3σ between GABS and CYCLABS. This is due to the degeneracy between the centroid energy of the 10 keV feature and the fundamental CRSF energy. However, the MCMC contours clearly show that the energies agree within the 68% contour when projected onto the CRSF energy (Fig. 3).
Since the CRSF parameters are in agreement between both models and the corresponding goodness of fit does not allow us to favor one of these models over the other, we use the results of the CYCLABS model in the following discussions, not least in order to enable comparison with earlier works that used the same model (e.g., Nakajima et al. 2006; M13).
The continuum and iron line parameters are in excellent agreement (≤1.3σ) when using the CYCLABS or the GABS model for the shape of the CRSFs. This is expected since they model narrow features compared to the broad-band X-ray continuum of 4U 0115+634. We note a marginal shift of ∼0.15 keV in the centroid energy of the 8.5 keV Gaussian between both models (see Fig. 3), which is due to the detected degeneracy with the fundamental CRSF.
4.3. The 10 keV feature
Additional spectral components below and around 10 keV on top of the underlying cutoff power-law continuum are commonly detected in the X-ray spectra of highly magnetized neutron star X-ray binaries. In many cases, these features can be modeled by a black-body component with temperatures kT between 1 and 2 keV (see, e.g., Ballhausen et al. 2016 for KS 1947+300, Caballero et al. 2007, 2013 for A 0535+26, Kühnel et al. 2013, 2017 for GRO J1008−57, or Rothschild et al. 2017 for GX 304−1). The black-body flux relative to the power law seems to depend on luminosity and ranges from 10% up to 100%. In other cases, it is necessary to add a Gaussian feature in emission or in absorption (see, e.g., Ferrigno et al. 2009 for 4U 0115+634, Suchy et al. 2008 for Cen X-3, Vasco et al. 2013 for Her X-1, Fürst et al. 2014 for Vela X-1, and a systematic study in Coburn et al. 2002). However, these Gaussians correct some significant but energetically marginal feature due to their lower relative fluxes compared to a source with black-body components.
The flux of the Gaussian centered at 8.5 keV, which we needed to describe the Suzaku and RXTE spectra of 4U 0115+634 (see Sect. 3.1), was ∼35% and ∼51% of that of the power law during Epochs I and II, respectively (see Table 1). This is much too strong to be due to “photon spawning” caused by photons produced by electrons excited into higher Landau levels and then de-exciting down to the fundamental level (see, e.g., Schwarm et al. 2017a; Isenberg et al. 1998 for detailed calculations of the line shape) and comparable to the black-body flux seen in other sources. Thus, we tried to replace the Gaussian with such a black-body spectrum. However, this attempt failed with an insufficient goodness of fit ( > 2) due to strong residuals below 10 keV. In order to understand this failed fit, Fig. B.1 compares the 8.5 keV Gaussian to a black body with kT = 2.7 keV and the same relative flux as in the Gaussian of epoch I. One can see that the width of the Gaussian is narrower than that of the black body. Since both features contain the same flux, that is, their areas are equal, the Gaussian “sticks out” on top of the continuum in contrast to the black body.
We conclude that the Gaussian centered around 8.5 keV in the spectra of 4U 0115+634 is peculiar compared to other accreting pulsars: it has a strong contribution to the overall continuum compared to known “10 keV features” and is incompatible to the black-body components detected in other sources. This might point to a distinct physical origin. In the remainder of this section, we propose cyclotron cooling as the physical origin of this Gaussian feature following discussions and results by Ferrigno et al. (2009) and Farinelli et al. (2016). In contrast to cyclotron absorption lines, where photons excite the electrons and are therefore observed as absorption features, cyclotron cooling is based on collisional excitation within the plasma, which results in an additional emission of photons at the cyclotron energy, that is, cyclotron emission.
According to Arons et al. (1987), cyclotron emission can be the dominant cooling channel in the accretion column once the plasma temperature and cyclotron energy are comparable. This enables the excitation of the first Landau level of electrons due to collisions with protons inside the plasma. The de-excitation will emit a photon at the cyclotron energy which will effectively cool the plasma. This cyclotron emission provides seed photons for bulk and thermal Comptonization inside the accretion column. The self-consistent physical model by Becker & Wolff (2007, and references therein) uses analytical approximations in order to calculate the emerging X-ray spectrum from these seed photons and those from Bremsstrahlung and black-body emission.
The self-consistent model proposed by Becker & Wolff (2007, and references therein) was first implemented by Ferrigno et al. (2009) and applied to the BeppoSAX spectrum of 4U 0115+634 during its 1999 outburst. However, it was concluded that the assumptions and restrictions of the Becker & Wolff (2007) model are not sufficient to explain the complex X-ray continuum spectrum of 4U 0115+634. An extension of the Becker & Wolff (2007) model was developed by Farinelli et al. (2016, 2012), who used some analytical approximations of the original model in combination with numerical methods, which allowed them to include variations of the magnetic field along the column and to approximate the cyclotron emission by a Gaussian line instead of a Dirac function. These authors applied their so-called COMPMAG model to the same BeppoSAX data of 4U 0115+634 as previously analyzed by Ferrigno et al. (2009), among others. Farinelli et al. (2016) found that their model was able to describe the 0.1–100 keV spectrum of a few sources including 4U 0115+634 at different flux states, without the introduction of any further emission components7. In particular, a prominent bump in the spectrum around 9 keV was due to significant cyclotron emission predicted by the model. Their best-fit width of cyclotron emission of 2.4 keV is explained by broadening of the intrinsic cyclotron emission by for example magnetic field gradients inside the column. Due to the similarity of the findings of Farinelli et al. (2016) and the parameters of our Gaussian component around 8.5 keV (the “10 keV feature”), we argue that this component accounts for cyclotron emission as part of our phenomenological model.
Two issues with this scenario remain, which are the difference between the fundamental cyclotron absorption line energy of ECRSF, 0 = 10.2 keV and the centroid energy of the cyclotron emission at E10 keV ∼ 8.5 keV, which is not expected at first glance. The reason why cyclotron emission seems to be dominant in 4U 0115+634 but not in other sources is also unclear. One explanation of the former issue was put forward by Tsygankov et al. (2018), who argue that cyclotron emission cannot escape at the resonant energy, owing to the high scattering cross section. Emission is then preferentially detectable at lower energy, where it can more easily escape. Ferrigno et al. (2009) proposed that cyclotron emission appears at higher altitudes in the column than the formation of the CRSFs, where the magnetic field strength and thus the cyclotron energy are lower compared to closer to the surface. Assuming a dipole magnetic field, the magnetic field strength, B(h), as a function of the height, h, above the surface is
 (7)
(7)
where B0 is the surface magnetic field strength and R the neutron star’s radius. Cyclotron emission is important as long as the B-field energy is comparable to the plasma temperature, which increases the occurrence of collisions inside the column (Arons et al. 1987). The temperature of plasma in the accretion column is of the order of several keV (Basko & Sunyaev 1976; Ferrigno et al. 2009) with a slow decrease with height (e.g., Fig. 5 of Basko & Sunyaev 1976 or West et al. 2017). As the rate of production of cyclotron photons scales as e−Ecyc/kT (see Eq. (114) of Becker & Wolff 2007), it is plausible that cyclotron emission is more effective a few hundreds meters above the surface if one assumes that cyclotron absorption features are imprinted at the base of the column.
We note that conditions for cyclotron emission change as soon as the magnetic field strength of the neutron star is higher than that of 4U 0115+634. A B-field more than twice as strong as that of 4U 0115+634 (i.e., a CRSF at ≳21 keV), which is the case for most cyclotron line sources (see, e.g., the review by Staubert et al. 2019), results in a cyclotron energy that is significantly higher than the plasma temperature throughout the column and therefore hampers collisional excitation of the Landau level. Thus if cyclotron emission takes place in accretion columns this would explain why the spectrum of 4U 0115+634 is dominated by cyclotron emission in contrast to that of other sources with stronger magnetic fields. We note that the case of GX 304−1 at low luminosity might be different, as discussed in Tsygankov et al. (2018), because a high temperature can be reached in a tenuous accretion stream, where thermal cooling is inefficient and the Landau level can be collisionally populated. While cyclotron emission could explain both the issues raised above, we stress that detailed and self-consistent calculations are needed to fully investigate this idea.
4.4. Energy dependence of the fundamental CRSF
Previous work on 4U 0115+634 (e.g., Nakajima et al. 2006; Müller et al. 2010; Li et al. 2012) found an anti-correlation between the fundamental cyclotron line energy and the X-ray flux. However, M13 found that this apparent anti-correlation depends on the choice of the continuum model. These latter authors argued in favor of an absorbed cutoff power law with a 10 keV emission feature, as used in this analysis, for which the anti-correlation vanishes. As noted in the previous section, the data gap of Suzaku between XIS and PIN does not allow us to directly study the behavior of the fundamental cyclotron line between the data epochs I and II. Nonetheless, in the following we are able to determine whether our results are consistent with the anti-correlation between the fundamental line energy and the source’s flux as found by for example Nakajima et al. (2006) or instead, consistent with the uncorrelated parameters found by M13.
In epoch I, where we only have Suzaku data available, we had fixed the energy and depth of the fundamental cyclotron line, ECRSF, 0 and τCRSF, 0, respectively, to the results of our combined analysis of the Suzaku and RXTE data of epoch II (see Sect. 3). In order to investigate an evolution of the CRSF from epochs I to II despite the data gap between XIS and PIN, we calculated χ2-contours between these parameters in epoch I. The resulting contour map is shown in Fig. 4. The best-fit values of the CRSF energy and depth of epoch II (blue cross) are consistent within the 1σ 2D contour calculated for epoch I and the possible CRSF energy range is 8.2–12.2 keV (90% confidence). This justifies our approach of fixing the parameters of the fundamental CRSF parameters in epoch I to the best-fit values from epoch II.
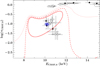 |
Fig. 4. χ2-contour-map (solid line: 68% confidence; dashed: 90%; dotted: 99%) between the fundamental CRSF energy, ECRSF, 0, and its depth, τCRSF, 0, in epoch I (red) and epoch II (blue). The blue cross marks the best-fit values from epoch II with their respective uncertainties (see Table 1). The CRSF parameters found by Nakajima et al. (2006, Table 4; circles) and by Müller et al. (2013, Table 2; diamonds) are added for comparison. The filled symbols mark parameters obtained at a source luminosity similar to Epoch I and Epoch II. |
However, the contour maps alone do not allow us to favor one of the two claimed evolutions of the CRSF parameters with the source’s flux. Therefore, we compare the parameter combinations enclosed by the contours with the energies and depths of the fundamental CRSF as found by Nakajima et al. (2006) and M13 (circles and diamonds in Fig. 4, respectively). In particular, we focus on their parameters derived from observations of 4U 0115+634 at a similar 3–50 keV luminosity level (filled symbols in Fig. 4) during epochs I and II. Neither the χ2-contours of epoch I nor those of epoch II are consistent with the values expected from the anti-correlation as found by Nakajima et al. (2006) with at least 99% confidence. Instead, our results are in excellent agreement with the findings of M13. Therefore, using the continuum model of M13 to describe the Suzaku-data results in CRSF energies which are in agreement with expectations from a constant behavior rather than implying an anti-correlation of the CRSF energy with luminosity. However, we note that we cannot exclude a change in the fundamental CRSF energy between epochs I and II on the level of a few keV as a consequence of the data gap between Suzaku-XIS and -PIN (see the contours for epoch I in Fig. 4). To our knowledge, no one has claimed a CRSF-to-luminosity correlation on this energy scale yet. Although the theory by Becker et al. (2012) explains changes of the CRSF energy with the mass-accretion rate as seen in other accreting pulsars, the fundamental CRSF energy of 4U 0115+634 around 10–11 keV is so low that the regimes of Coulomb and radiation braking according to their theory can no longer be distinguished (see Fig. 2 (right) of Becker et al. 2012).
4.5. The question of a second fundamental CRSF
Iyer et al. (2015, I15 for the remainder of this section) analyzed data from various satellites and instruments during the 2011 outburst of 4U 0115+634. In particular these latter authors analyzed the simultaneous observations by RXTE (96032-01-04-00) and Suzaku (406049010) restricted to the time interval where both observations overlapped (about ∼13 ks). We analyzed these data as well (epoch II in this work), but using the full available on-source time and a second RXTE observation (96032-01-04-01). Since our best fit using a common set of parameters is acceptable (see Table 1), we find that restricting the data to the overlapping interval is not necessary, allowing us to increase the S/N.
The continuum model chosen by I15 differs from our choice: these latter authors used a combination of a low-temperature black body and a power law with a high-energy cutoff (cutoffpl, see Eq. (1)) without the need for a broad Gaussian at 8.5 keV. Apart from the known Fe Kα line and the known CRSFs, I15 found absorption-like residuals around ∼15 keV, which they interpreted as a second fundamental cyclotron line. They attributed this feature to the second magnetic pole of the neutron star, which might have a higher magnetic field strength than the other pole due to asymmetries in the magnetic field configuration. I15 argued that the superposition of both fundamental lines might have caused the observed anti-correlation of the 11 keV line in the past. However, as described in the previous section, a CRSF at energies higher than 11 keV would worsen the best-fit of epoch II significantly, i.e., we find no indication for a second fundamental CRSF at 15 keV. In order to understand this difference, we compare and investigate the continuum and CRSF parameters of our work and the work by I15 in the following.
We implemented the model used by I15 as defined in their Sect. 3 and the parameters given in their Tables 4 and 5 for the simultaneous Suzaku and RXTE observations. Since the detector response files might have been updated since 2015, we re-fitted their model to our extracted spectra. The resulting parameters are very similar to those reported in I15. For the power-law normalization (which is missing in I15), we find a flux of  photons keV−1 cm−2 s−1 at 1 keV. In contrast to the fit goodness of 688/469 (χ2/d.o.f.) reported by I15 (their Table 4), their model fitted to our extraction results in a worse goodness of 975/571 (with 1% systematic uncertainties added to the full PCA energy range as in I15). This is due to the higher S/N of our data, since we did not restrict the observations to the overlapping time interval. We base the following discussion on their best-fit parameters (Iyer et al. 2015, Table 4 and 5).
The integrated flux over the continuum model of I15 while excluding the CRSF components is about twice as high as over our model (8.6 × 10⁻⁹ erg s−1 cm−2 vs. 4.1 × 10⁻⁹ erg s−1 cm−2 in the 1–100 keV energy range). This is due to a significantly higher continuum flux between 5 and 50 keV (see gray shaded region in Fig. 5a) caused by the negative photon index8 of Γ = −1.25 found by these authors, which results in an increasing photon flux with energy, ignoring the exponential cut-off. For illustration purposes, we included in Fig. 5a the model-independent photon flux observed during epoch II,  . Following Nowak et al. (2005) and Houck (2018, Sect. 7.2), the unfolded flux in spectral bin h is given by
 (8)
(8)
where C(h) is the observed counts in this bin, B(h) is the background count, t is the exposure time, ΔE(h) is the energy range contributing to detector bin h, A(E) is the detector effective area at energy E, and R(h, E) is the redistribution function of the detector. Equation (8) assumes that the source flux is constant in the interval ΔE(h), which is a reasonable approximation for photon energies E ≳ 1 keV and typical CCD detector resolution (see Sect. 7.2 of Houck 2018). As shown in Fig. 5a, the observed flux does not agree with the continuum model of I15, while it follows our continuum model almost perfectly with the exception of small deviations as expected at the CRSF energies (see Fig. 2b for the residuals). Since I15 claim to have found a good description of the spectra, further components in their full model must have reduced their continuum flux to the observed values. As shown in Fig. 5b, the difference between the continua appears as a broad line-like absorption feature centered at ∼15 keV. We find that the shape of the second fundamental CRSF at 15 keV and the first harmonic around 20 keV both claimed by I15 (see purple and blue lines in Fig. 5b) are very similar in width and depth compared to the difference of the continua (black line). Once the continuum model by I15 is modified by these two CRSFs, the difference between this and our continuum model is almost negligible (see Fig. 5c). In fact, as shown in Table 2 these two components absorb ∼65% of the total flux of the baseline continuum, while in our model all CRSF components absorb only ∼4% in total. Thus, we conclude that the excessive flux of the continuum model by I15 is erroneously corrected by their claimed CRSFs. This argument is consistent with one made earlier by some of the present authors in relation to the interpretation of the CRSFs of 4U 0115+634 (Müller et al. 2013).
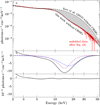 |
Fig. 5. Comparison between the continuum models by Iyer et al. (2015) and this work for epoch II (RXTE and Suzaku). (a) Unabsorbed continuum model, i.e., without emission lines and CRSFs assumed by I15 (their best-fit parameters; dashed line) and this work (solid line). The continua differ significantly between 5 and 50 keV (gray shaded region). The source’s flux observed during epoch II with all instruments, unfolded using Eq. (8) and corrected for X-ray absorption, is shown for comparison (red data). (b) Difference between the continuum in this work and that of I15 (black solid line). The shapes of the CRSFs at 15 keV (purple dashed line) and the first harmonic around 20 keV (blue dashed-and-dotted line) inferred from the parameters by I15 are shown for comparison. (c) difference between the continuum-only of this work and the I15 continuum with their CRSFs at 15 keV and 20 keV included. |
Comparison of the photon fluxes absorbed by the fundamental cyclotron line, E0, and its higher harmonics, E1 and E2, during epoch II as derived from the models by Iyer et al. (2015) and this work.
5. Conclusions and summary
Here we analyze two sets of spectral data for the giant outburst of 4U 0115+634 in 2011, which were taken during the fading phase of the outburst. The spectra can be described with an absorbed cutoff power law modified by a Gaussian emission feature around 8.5 keV, narrow emission lines from neutral and ionized iron, and three cyclotron features at ∼10 keV, ∼21, and 33 keV, respectively.
One of the main aims of this work is to study the behavior of the CRSFs in comparison with previous findings for this source (e.g., Nakajima et al. 2006; Tsygankov et al. 2007; Müller et al. 2010; Li et al. 2012). In contrast to claims in earlier publications, M13 showed that the energy of the fundamental CRSF does not exhibit a correlation with the source flux. These latter authors argue that the previously claimed anti-correlation is due to the use of an insufficient continuum model, which causes the cyclotron line components to erroneously correct for the continuum shape. Boldin et al. (2013) confirmed that the choice of the continuum model strongly influences the best-fit parameters of the cyclotron lines. For the Suzaku data analyzed here, we reject the CRSF energies as expected from an anti-correlation (see Sect. 4.4) and thus confirm the results of M13.
Iyer et al. (2015) proposed that the discrepancy in the literature concerning the behavior of the fundamental CRSF could be caused by flux-dependent contributions of two fundamental cyclotron lines located at ∼10.5 keV and ∼15 keV, respectively. These authors base this conclusion on an analysis of simultaneous Suzaku and RXTE data for the 2011 outburst. However, applying the model by M13 to the same data (epoch II), we find no evidence of a second fundamental cyclotron line. Instead, we have shown that the line-like feature at 15 keV seen by Iyer et al. (2015) is again caused by the choice of the phenomenological continuum model (see Fig. 5). Based on the unphysically large fraction of the continuum flux absorbed by the CRSF features claimed by Iyer et al. (2015), we therefore conclude that there is no second fundamental line in the spectrum of 4U 0115+634.
On a more general note, we strongly suggest checking all cyclotron line parameters found by fitting phenomenological models to observed X-ray spectra against physically expected parameter ranges. For example, if one can assume that the magnetic field is constant in the region in which the CRSF is formed, then sophisticated Monte Carlo simulations used to derive accurate cross-sections for cyclotron scattering (Schwarm et al. 2017b) show that the width, ΔE, of a fundamental CRSF with the centroid energy E can be approximated by the full Doppler width for thermal cyclotron line broadening (see also Meszaros & Nagel 1985),
 (9)
(9)
where T is the electron temperature, θ is the angle between the incident photon trajectory and the magnetic field, me is the electron rest mass, c the speed of light, and kB is the Boltzmann constant. Assuming kBT = 7.94 keV, based on the modeling of the X-ray spectrum of 4U 0115+634 with a bulk and thermal Comptonization model (Ferrigno et al. 2009), we find a relative width of 30% at maximum (cos θ = 1), which translates to ∼3 keV for the CRSFs in 4U 0115+634. In case of higher harmonic lines, the thermally averaged cross-sections calculated by Schwarm et al. (2017b) do not indicate significantly broader lines compared to the fundamental line. Cyclotron lines broader than a few keV can be explained by, for example, a B-field gradient along the line-forming region and specific viewing angles or velocity gradients (e.g., Nishimura 2013, 2014, 2019; Poutanen et al. 2013). These effects should, however, influence all CRSFs present in the spectrum. In summary, care must be taken as soon as any CRSF component is significantly broader than ΔE/E > 30%−40% or when the relative widths of multiple detected CRSFs are significantly different from each other.
A similar check is possible for the depth of the cyclotron line. As shown by Harding & Daugherty (1991), for photons close to the resonant frequency, the first order absorption cross section is a very good approximation for the inelastic one-photon scattering cross section, and therefore magnetic Compton scattering in the line core can be approximated as an absorption process. Therefore, using the fitted value for τCRSF, that is, the optical depth in the core of the cyclotron line, we can estimate the residual flux, r, around the position of a cyclotron line at energy ECRSF to
 (10)
(10)
where WCRSF is the width of the cyclotron line, Fν is the emergent flux including cyclotron scattering, and F0 the input continuum flux without a CRSF. In the Monte Carlo simulations performed by Schwarm et al. (2017b), only 1–10% of the initial photons undergo resonant scattering, that is, r ≳ 90%. Consequently, we would expect τCRSF ≲ 0.1 for the observed optical depths9. From our best-fit model of the spectra of Epoch II, the calculated residual fluxes after Eq. (10) are ≥78% for all three detected cyclotron lines (see Table 2). These values together with the fitted optical depths of τCRSF ≤ 0.24 (see Table 1) are in excellent agreement with the expectations from the simulations by Schwarm et al. (2017b). Although spawned photons from higher harmonics, which originate from multi-photon scattering and from the radiative de-excitation of electrons excited into higher levels, can affect the shape of the fundamental line (Isenberg et al. 1998), they can only decrease its depth. We note that residual fluxes down to r ≳ 36% have been observed for GX 304−1 (Rothschild et al. 2017), which can be obtained by, for example, a higher optical depth at the line-forming region. However, the CRSFs are not expected to absorb a significant fraction of the total broad-band continuum flux, which is the case for the model by Iyer et al. (2015). We conclude that the CRSF parameters that these latter authors found are due to a degeneracy between the continuum modeling and the CRSF modeling when unphysical values for the CRSF are allowed. In summary, the choice of a phenomenological model for the X-ray spectrum of an accreting neutron star may cause strong discrepancies relative to the theoretically expected values for the CRSF parameters. In particular, an erroneous shape or an overestimation of the X-ray flux is sometimes corrected by the introduction of further strong absorption components, which are probably not real. We stress that we do not claim that our choice of the phenomenological continuum model for 4U 0115+634 describes its true X-ray spectrum best. However, in contrast to other continua the model applied here yields CRSF parameters which are consistent with theoretical expectations. These conclusions desperately call out for a self-consistent model for both the spectral continuum and the cyclotron resonant scattering features.
A similar improvement can be seen in the document describing the latest XIS CALDB files, see https://heasarc.gsfc.nasa.gov/docs/heasarc/caldb/suzaku/docs/xis/20180807_sikedge_xisrmfgen.pdf.
The ISIS implementation of emcee is distributed via the ISISscripts at http://www.sternwarte.uni-erlangen.de/isis
τ = MJD 54531.7709(0.0603), ω = 48.67(4)°, and  yr−1 (Li et al. 2012), Porb = 24.317037(62) d (Bildsten et al. 1997), e = 0.3402(4) and a sin i = 140.14(16) lt − s (Rappaport et al. 1978).
However, a partial covering medium was needed to level out residuals in 4U 0115+634.
The photon index, Γ, as defined in Eq. (1) and implemented in XSPEC is found to be positive for almost all accreting pulsars (see, e.g., Bildsten et al. 1997).
We note that the definition of the optical depth depends on the chosen phenomenological absorption model (e.g., Staubert et al. 2019, and references therein). For instance, the optical depths of the CYCLABS- and GABS-model (see Eqs. (2) and (3)) are linked by Eq. (4).
Acknowledgments
We acknowledge funding by the European Space Agency under contract number C4000115860/15/NL/IB, by the Bundesministerium für Wirtschaft und Technologie under Deutsches Zentrum für Luft- und Raumfahrt grants 50OR0808, 50OR0905, 50OR1113, and 50OR1207, and by the Deutscher Akademischer Austauschdienst. MTW is supported by the NASA Astrophysical Data Analysis Program and the Chief of Naval Research. VG is supported through the Margarethe von Wrangell fellowship by the ESF and the Ministry of Science, Research and the Arts Baden-Württemberg. SMN and JMT acknowledge Spanish Ministerio de Ciencia, Tecnología e Innovación (MICINN) through the grant ESP2016-76683-C3-1-R and ESP2017-85691-P, respectively. We thank John E. Davis for the development of the SLxfig module, which was used to create all figures in the paper. We thank the anonymous referee for her/his constructive comments on how to improve our paper.
References
- Arnaud, K. A. 1996, ASP Conf. Ser., 101, 17 [Google Scholar]
- Arons, J., Klein, R. I., & Lea, S. M. 1987, ApJ, 312, 666 [NASA ADS] [CrossRef] [Google Scholar]
- Bailer-Jones, C. A. L., Rybizki, J., Fouesneau, M., et al. 2018, AJ, 156, 58 [NASA ADS] [CrossRef] [Google Scholar]
- Ballhausen, R., Kühnel, M., Pottschmidt, K., et al. 2016, A&A, 591, A65 [NASA ADS] [CrossRef] [EDP Sciences] [Google Scholar]
- Basko, M. M., & Sunyaev, R. A. 1976, MNRAS, 175, 395 [NASA ADS] [CrossRef] [Google Scholar]
- Becker, P. A., & Wolff, M. T. 2007, ApJ, 654, 435 [NASA ADS] [CrossRef] [Google Scholar]
- Becker, P. A., Klochkov, D., Schönherr, G., et al. 2012, A&A, 544, A123 [NASA ADS] [CrossRef] [EDP Sciences] [Google Scholar]
- Bildsten, L., Chakrabarty, D., Chiu, J., et al. 1997, ApJS, 113, 367 [NASA ADS] [CrossRef] [Google Scholar]
- Boldin, P. A., Tsygankov, S. S., & Lutovinov, A. A. 2013, Astron. Lett., 39, 375 [NASA ADS] [CrossRef] [Google Scholar]
- Boldt, E. 1987, IAU Symp., 124, 611 [NASA ADS] [CrossRef] [Google Scholar]
- Caballero, I., & Wilms, J. 2012, Mem. Soc. Astron. It., 83, 230 [NASA ADS] [Google Scholar]
- Caballero, I., Kretschmar, P., Santangelo, A., et al. 2007, A&A, 465, L21 [NASA ADS] [CrossRef] [EDP Sciences] [Google Scholar]
- Caballero, I., Pottschmidt, K., Marcu, D. M., et al. 2013, ApJ, 764, L23 [NASA ADS] [CrossRef] [Google Scholar]
- Coburn, W., Heindl, W. A., Rothschild, R. E., et al. 2002, ApJ, 580, 394 [NASA ADS] [CrossRef] [Google Scholar]
- Cominsky, L., Clark, G. W., Li, F., et al. 1978, Nature, 273, 367 [NASA ADS] [CrossRef] [Google Scholar]
- Farinelli, R., Ceccobello, C., Romano, P., & Titarchuk, L. 2012, A&A, 538, A67 [NASA ADS] [CrossRef] [EDP Sciences] [Google Scholar]
- Farinelli, R., Ferrigno, C., Bozzo, E., & Becker, P. A. 2016, A&A, 591, A29 [NASA ADS] [CrossRef] [EDP Sciences] [Google Scholar]
- Ferrigno, C., Becker, P. A., Segreto, A., et al. 2009, A&A, 498, 825 [NASA ADS] [CrossRef] [EDP Sciences] [Google Scholar]
- Finger, M. H., & Prince, T. A. 1997, AIP Conf. Proc., 410, 57 [NASA ADS] [CrossRef] [Google Scholar]
- Foreman-Mackey, D., Hogg, D. W., Lang, D., & Goodman, J. 2013, PASP, 125, 306 [CrossRef] [Google Scholar]
- Fürst, F., Pottschmidt, K., Wilms, J., et al. 2014, ApJ, 780, 133 [NASA ADS] [CrossRef] [Google Scholar]
- García, J. A., McClintock, J. E., Steiner, J. F., et al. 2014, ApJ, 794, 73 [NASA ADS] [CrossRef] [Google Scholar]
- Giacconi, R., Murray, S., Gursky, H., et al. 1972, ApJ, 178, 281 [NASA ADS] [CrossRef] [Google Scholar]
- Giménez-García, A., Torrejón, J. M., Eikmann, W., et al. 2015, A&A, 576, A108 [NASA ADS] [CrossRef] [EDP Sciences] [Google Scholar]
- Goodman, J., & Weare, J. 2010, Appl. Math. Comput. Sci., 5, 65 [Google Scholar]
- Harding, A. K., & Daugherty, J. K. 1991, ApJ, 374, 687 [NASA ADS] [CrossRef] [Google Scholar]
- Heindl, W. A., Coburn, W., Gruber, D. E., et al. 1999, ApJ, 521, L49 [NASA ADS] [CrossRef] [Google Scholar]
- Houck, J. C. 2018, ISIS 1.0 Technical Manual, Chandra X-Ray Observatory Center, MIT Center for Space Research, Cambridge, USA, http://space.mit.edu/asc/isis/manual.html [Google Scholar]
- Houck, J. C., & Denicola, L. A. 2000, ASP Conf. Ser., 216, 591 [Google Scholar]
- Isenberg, M., Lamb, D. Q., & Wang, J. C. L. 1998, ApJ, 505, 688 [NASA ADS] [CrossRef] [Google Scholar]
- Iyer, N., Mukherjee, D., Dewangan, G. C., et al. 2015, MNRAS, 454, 741 [NASA ADS] [CrossRef] [Google Scholar]
- Jahoda, K., Markwardt, C. B., Radeva, Y., et al. 2006, ApJS, 163, 401 [NASA ADS] [CrossRef] [Google Scholar]
- Klochkov, D., Doroshenko, V., Santangelo, A., et al. 2012, A&A, 542, L28 [NASA ADS] [CrossRef] [EDP Sciences] [Google Scholar]
- Koyama, K., Tsunemi, H., Dotani, T., et al. 2007, PASJ, 59, 23 [Google Scholar]
- Krimm, H. A., Holland, S. T., Corbet, R. H. D., et al. 2013, ApJS, 209, 14 [NASA ADS] [CrossRef] [Google Scholar]
- Kühnel, M., Müller, S., Kreykenbohm, I., et al. 2013, A&A, 555, A95 [NASA ADS] [CrossRef] [EDP Sciences] [Google Scholar]
- Kühnel, M., Falkner, S., Grossberger, C., et al. 2016, Acta Pol., 56, 41 [NASA ADS] [CrossRef] [Google Scholar]
- Kühnel, M., Fürst, F., Pottschmidt, K., et al. 2017, A&A, 607, A88 [NASA ADS] [CrossRef] [EDP Sciences] [Google Scholar]
- Lamb, F. K., Pethick, C. J., & Pines, D. 1973, ApJ, 184, 271 [NASA ADS] [CrossRef] [Google Scholar]
- Li, J., Wang, W., & Zhao, Y. 2012, MNRAS, 423, 2854 [NASA ADS] [CrossRef] [Google Scholar]
- Mészáros, P. 1992, High-Energy Radiation from Magnetized Neutron Stars (Chicago, USA: University of Chicago Press) [Google Scholar]
- Meszaros, P., & Nagel, W. 1985, ApJ, 298, 147 [NASA ADS] [CrossRef] [Google Scholar]
- Mihara, T., Makishima, K., Ohashi, T., et al. 1990, Nature, 346, 250 [NASA ADS] [CrossRef] [Google Scholar]
- Mowlavi, N., Kreykenbohm, I., Shaw, S., et al. 2006, A&A, 451, 817 [NASA ADS] [CrossRef] [EDP Sciences] [Google Scholar]
- Müller, S., Obst, M., Kreykenbohm, I., et al. 2010, Proc. Eighth INTEGRAL Workshop “The Restless Gamma-ray Universe” PoS(INTEGRAL2010), 116 [Google Scholar]
- Müller, S., Kühnel, M., Caballero, I., et al. 2012, A&A, 546, A125 [NASA ADS] [CrossRef] [EDP Sciences] [Google Scholar]
- Müller, S., Ferrigno, C., Kühnel, M., et al. 2013, A&A, 551, A6 [NASA ADS] [CrossRef] [EDP Sciences] [Google Scholar]
- Mushtukov, A. A., Suleimanov, V. F., Tsygankov, S. S., & Poutanen, J. 2015, MNRAS, 447, 1847 [NASA ADS] [CrossRef] [Google Scholar]
- Nakajima, M., Mihara, T., Makishima, K., & Niko, H. 2006, ApJ, 646, 1125 [NASA ADS] [CrossRef] [Google Scholar]
- Negueruela, I., & Okazaki, A. T. 2001, A&A, 369, 108 [NASA ADS] [CrossRef] [EDP Sciences] [Google Scholar]
- Nishimura, O. 2013, PASJ, 65, 84 [NASA ADS] [CrossRef] [Google Scholar]
- Nishimura, O. 2014, ApJ, 781, 30 [NASA ADS] [CrossRef] [Google Scholar]
- Nishimura, O. 2019, PASJ, 71, 42 [NASA ADS] [CrossRef] [Google Scholar]
- Nowak, M. A., Wilms, J., Heinz, S., et al. 2005, ApJ, 626, 1006 [NASA ADS] [CrossRef] [Google Scholar]
- Nowak, M. A., Hanke, M., Trowbridge, S. N., et al. 2011, ApJ, 728, 13 [NASA ADS] [CrossRef] [Google Scholar]
- Okazaki, K., Hayashida, K., Nakajima, H., et al. 2018, SPIE Conf. Ser., 10709, 107091F [Google Scholar]
- Postnov, K. A., Gornostaev, M. I., Klochkov, D., et al. 2015, MNRAS, 452, 1601 [NASA ADS] [CrossRef] [Google Scholar]
- Poutanen, J., Mushtukov, A. A., Suleimanov, V. F., et al. 2013, ApJ, 777, 115 [NASA ADS] [CrossRef] [Google Scholar]
- Rappaport, S., Clark, G. W., Cominsky, L., et al. 1978, ApJ, 224, L1 [NASA ADS] [CrossRef] [Google Scholar]
- Reynolds, M. T., & Miller, J. M. 2010, ApJ, 723, 1799 [NASA ADS] [CrossRef] [Google Scholar]
- Riquelme, M. S., Torrejón, J. M., & Negueruela, I. 2012, A&A, 539, A114 [NASA ADS] [CrossRef] [EDP Sciences] [Google Scholar]
- Rothschild, R. E., Blanco, P. R., Gruber, D. E., et al. 1998, ApJ, 496, 538 [NASA ADS] [CrossRef] [Google Scholar]
- Rothschild, R. E., Kühnel, M., Hemphill, P., et al. 2017, MNRAS, 466, 2752 [NASA ADS] [CrossRef] [Google Scholar]
- Santangelo, A., Segreto, A., Giarrusso, S., et al. 1999, ApJ, 523, L85 [NASA ADS] [CrossRef] [Google Scholar]
- Schwarm, F. W., Ballhausen, R., Falkner, S., et al. 2017a, A&A, 601, A99 [NASA ADS] [CrossRef] [EDP Sciences] [Google Scholar]
- Schwarm, F. W., Schönherr, G., Falkner, S., et al. 2017b, A&A, 597, A3 [NASA ADS] [CrossRef] [EDP Sciences] [Google Scholar]
- Staubert, R., Shakura, N. I., Postnov, K., et al. 2007, A&A, 465, L25 [NASA ADS] [CrossRef] [EDP Sciences] [Google Scholar]
- Staubert, R., Trümper, J., Kendziorra, E., et al. 2019, A&A, 622, A61 [NASA ADS] [CrossRef] [EDP Sciences] [Google Scholar]
- Suchy, S., Pottschmidt, K., Wilms, J., et al. 2008, ApJ, 675, 1487 [NASA ADS] [CrossRef] [Google Scholar]
- Takahashi, T., Abe, K., Endo, M., et al. 2007, PASJ, 59, 35 [NASA ADS] [CrossRef] [EDP Sciences] [Google Scholar]
- Tamura, K., Tsunemi, H., Kitamoto, S., et al. 1992, ApJ, 389, 676 [NASA ADS] [CrossRef] [Google Scholar]
- Torrejón, J. M., Schulz, N. S., Nowak, M. A., & Kallman, T. R. 2010, ApJ, 715, 947 [NASA ADS] [CrossRef] [Google Scholar]
- Tsygankov, S. S., Lutovinov, A. A., Churazov, E. M., & Sunyaev, R. A. 2006, MNRAS, 371, 19 [NASA ADS] [CrossRef] [Google Scholar]
- Tsygankov, S. S., Lutovinov, A. A., Churazov, E. M., & Sunyaev, R. A. 2007, Astron. Lett., 33, 368 [NASA ADS] [CrossRef] [Google Scholar]
- Tsygankov, S. S., Rouco, Escorial A., Suleimanov, V. F., et al. 2018, MNRAS, 483, L144 [Google Scholar]
- Vasco, D., Staubert, R., Klochkov, D., et al. 2013, A&A, 550, A111 [NASA ADS] [CrossRef] [EDP Sciences] [Google Scholar]
- Verner, D. A., & Yakovlev, D. G. 1995, A&AS, 109, 125 [NASA ADS] [Google Scholar]
- West, B. F., Wolfram, K. D., & Becker, P. A. 2017, ApJ, 835, 130 [NASA ADS] [CrossRef] [Google Scholar]
- Wheaton, W. A., Doty, J. P., Primini, F. A., et al. 1979, Nature, 282, 240 [NASA ADS] [CrossRef] [Google Scholar]
- White, N. E., Swank, J. H., & Holt, S. S. 1983, ApJ, 270, 711 [NASA ADS] [CrossRef] [Google Scholar]
- Wilms, J., Allen, A., & McCray, R. 2000, ApJ, 542, 914 [NASA ADS] [CrossRef] [Google Scholar]
- Wilms, J., Nowak, M. A., Pottschmidt, K., et al. 2006, A&A, 447, 245 [NASA ADS] [CrossRef] [EDP Sciences] [Google Scholar]
- Yamamoto, T., Nakajima, M., Mihara, T., et al. 2011, ATel, 3430 [Google Scholar]
Appendix A: Suzaku-XIS and RXTE-PCA calibration
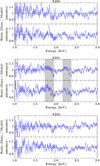 |
Fig. A.1. Effect of the updated Suzaku-XIS calibration (20181010) on the residuals around the Si- and Au-edges. The residuals were calculated from our best fit to epoch I (upper panels) and epoch II (lower panels) as listed in Table 1. The energy ranges in gray mark the bins, which were ignored in the XIS1 spectra during spectral analysis (Sect. 3). For display purposes, the channel binning has been reduced by a factor of two as described in Sect. 2. |
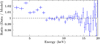 |
Fig. A.2. Ratio of the combined RXTE-PCA spectra to our best-fit model for epoch II. Features on a 1–2% level are visible below 7 keV, the existence of which is not confirmed by the Suzaku-XIS spectra (see Fig. 2). Similar features have been seen in combined PCA spectra of the Crab pulsar (Fig. 8, García et al. 2014) or of GRO J1008−57 (Fig. 3, Kühnel et al. 2016). |
Appendix B: The 10 keV feature vs. a black body
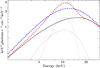 |
Fig. B.1. Comparison of the spectral shapes of the 8.5 keV Gaussian (red dotted line) and a black body with kT = 2.7 keV (blue dotted line). The total flux is the same for both components. When added to the cutoff power-law continuum (black solid line) the Gaussian is much more prominent (red dashed line) than the black body (blue dashed line). We note that the spectra are shown as radiated power (νFν) over the energy E = hν. |
All Tables
Comparison of the photon fluxes absorbed by the fundamental cyclotron line, E0, and its higher harmonics, E1 and E2, during epoch II as derived from the models by Iyer et al. (2015) and this work.
All Figures
|
Fig. 1. Swift-BAT daily light curve of 4U 0115+634 (15–50 keV) during its 2011 June/July outburst. The arrows mark the midtimes of the observations by Suzaku (red) and RXTE (blue). The defined data epochs I and II are indicated by vertical gray bands. |
| In the text | |
|
Fig. 2. Observed spectra and best-fit model of epoch I (left) and epoch II (right). The two panels marked (a) show the Suzaku spectra (XIS0: green; XIS1: red; XIS3: blue; PIN: purple) and in case of epoch II (right) the combined RXTE spectrum (PCA: orange). The black line is the best-fit model. Each inset zooms into the iron line region between 5 and 8 keV and shows the residual flux with respect to a model without any fluorescence lines. The modeled fluorescence lines are shown in gray. Panels marked (b) show the residuals of a fit to a model without the cyclotron lines included. The arrows labeled En mark the best-fit position of the nth cyclotron line (if significant within the error bars, see Table 1). Panels c and d: residuals of our best-fits using CYCLABS and GABS to model the cyclotron lines, respectively. |
| In the text | |
|
Fig. 3. Two-dimensional probability contours between the fitted parameters of the fundamental cyclotron line (a depth, τCRSF, 0 (CYCLABS) and DCRSF, 0 (GABS); b energy, ECRSF, 0) and the centroid energy, E10 keV, of the 10 keV feature calculated by a MCMC method for epoch II and both CRSF models (CYCLABS, red; GABS, blue). The contours correspond to the 68% (solid line), 90% (dashed line), and 99% confidence levels (dotted line) according to the MCMC walker distribution. The crosses are our best-fit parameters and their uncertainties using χ2-minimization (see Table 1). |
| In the text | |
|
Fig. 4. χ2-contour-map (solid line: 68% confidence; dashed: 90%; dotted: 99%) between the fundamental CRSF energy, ECRSF, 0, and its depth, τCRSF, 0, in epoch I (red) and epoch II (blue). The blue cross marks the best-fit values from epoch II with their respective uncertainties (see Table 1). The CRSF parameters found by Nakajima et al. (2006, Table 4; circles) and by Müller et al. (2013, Table 2; diamonds) are added for comparison. The filled symbols mark parameters obtained at a source luminosity similar to Epoch I and Epoch II. |
| In the text | |
|
Fig. 5. Comparison between the continuum models by Iyer et al. (2015) and this work for epoch II (RXTE and Suzaku). (a) Unabsorbed continuum model, i.e., without emission lines and CRSFs assumed by I15 (their best-fit parameters; dashed line) and this work (solid line). The continua differ significantly between 5 and 50 keV (gray shaded region). The source’s flux observed during epoch II with all instruments, unfolded using Eq. (8) and corrected for X-ray absorption, is shown for comparison (red data). (b) Difference between the continuum in this work and that of I15 (black solid line). The shapes of the CRSFs at 15 keV (purple dashed line) and the first harmonic around 20 keV (blue dashed-and-dotted line) inferred from the parameters by I15 are shown for comparison. (c) difference between the continuum-only of this work and the I15 continuum with their CRSFs at 15 keV and 20 keV included. |
| In the text | |
|
Fig. A.1. Effect of the updated Suzaku-XIS calibration (20181010) on the residuals around the Si- and Au-edges. The residuals were calculated from our best fit to epoch I (upper panels) and epoch II (lower panels) as listed in Table 1. The energy ranges in gray mark the bins, which were ignored in the XIS1 spectra during spectral analysis (Sect. 3). For display purposes, the channel binning has been reduced by a factor of two as described in Sect. 2. |
| In the text | |
|
Fig. A.2. Ratio of the combined RXTE-PCA spectra to our best-fit model for epoch II. Features on a 1–2% level are visible below 7 keV, the existence of which is not confirmed by the Suzaku-XIS spectra (see Fig. 2). Similar features have been seen in combined PCA spectra of the Crab pulsar (Fig. 8, García et al. 2014) or of GRO J1008−57 (Fig. 3, Kühnel et al. 2016). |
| In the text | |
|
Fig. B.1. Comparison of the spectral shapes of the 8.5 keV Gaussian (red dotted line) and a black body with kT = 2.7 keV (blue dotted line). The total flux is the same for both components. When added to the cutoff power-law continuum (black solid line) the Gaussian is much more prominent (red dashed line) than the black body (blue dashed line). We note that the spectra are shown as radiated power (νFν) over the energy E = hν. |
| In the text | |
Current usage metrics show cumulative count of Article Views (full-text article views including HTML views, PDF and ePub downloads, according to the available data) and Abstracts Views on Vision4Press platform.
Data correspond to usage on the plateform after 2015. The current usage metrics is available 48-96 hours after online publication and is updated daily on week days.
Initial download of the metrics may take a while.