Fig. A.2.
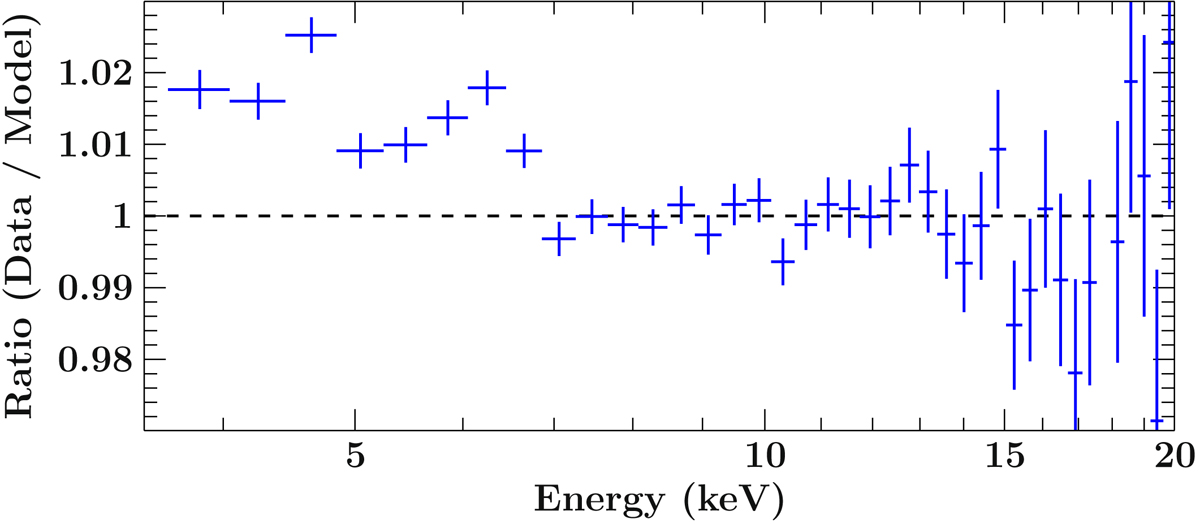
Ratio of the combined RXTE-PCA spectra to our best-fit model for epoch II. Features on a 1–2% level are visible below 7 keV, the existence of which is not confirmed by the Suzaku-XIS spectra (see Fig. 2). Similar features have been seen in combined PCA spectra of the Crab pulsar (Fig. 8, García et al. 2014) or of GRO J1008−57 (Fig. 3, Kühnel et al. 2016).
Current usage metrics show cumulative count of Article Views (full-text article views including HTML views, PDF and ePub downloads, according to the available data) and Abstracts Views on Vision4Press platform.
Data correspond to usage on the plateform after 2015. The current usage metrics is available 48-96 hours after online publication and is updated daily on week days.
Initial download of the metrics may take a while.