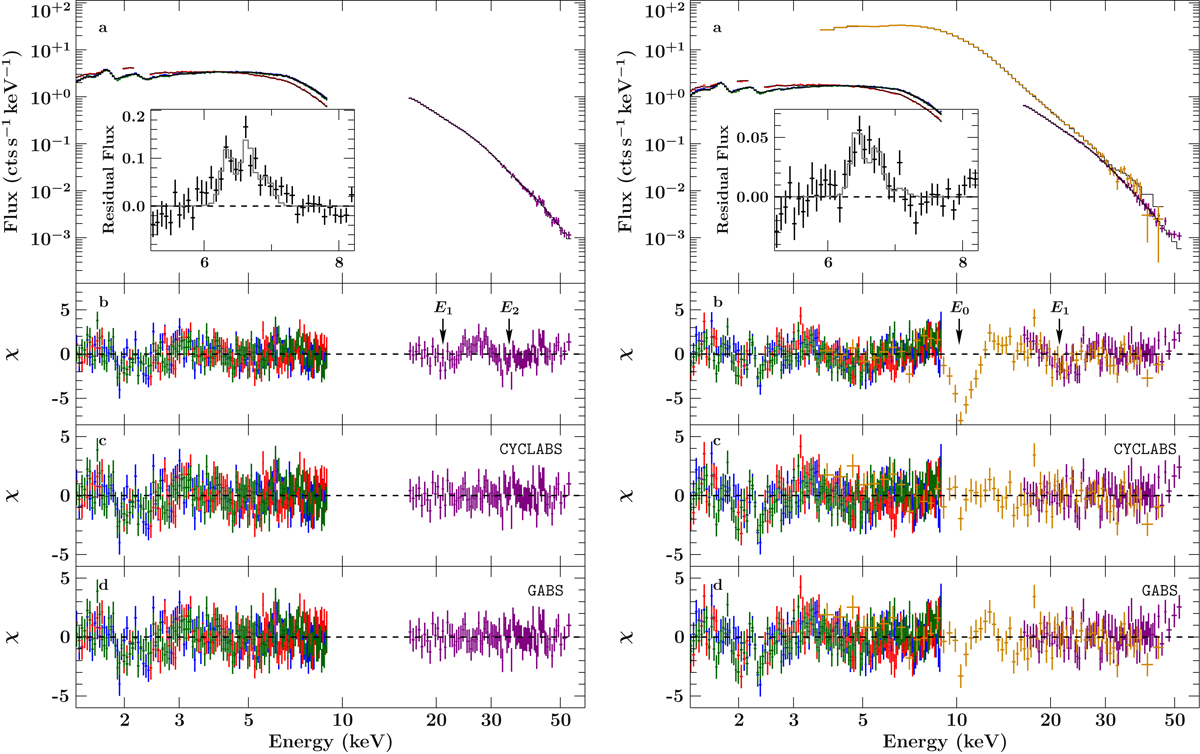
Fig. 2.

Observed spectra and best-fit model of epoch I (left) and epoch II (right). The two panels marked (a) show the Suzaku spectra (XIS0: green; XIS1: red; XIS3: blue; PIN: purple) and in case of epoch II (right) the combined RXTE spectrum (PCA: orange). The black line is the best-fit model. Each inset zooms into the iron line region between 5 and 8 keV and shows the residual flux with respect to a model without any fluorescence lines. The modeled fluorescence lines are shown in gray. Panels marked (b) show the residuals of a fit to a model without the cyclotron lines included. The arrows labeled En mark the best-fit position of the nth cyclotron line (if significant within the error bars, see Table 1). Panels c and d: residuals of our best-fits using CYCLABS and GABS to model the cyclotron lines, respectively.
Current usage metrics show cumulative count of Article Views (full-text article views including HTML views, PDF and ePub downloads, according to the available data) and Abstracts Views on Vision4Press platform.
Data correspond to usage on the plateform after 2015. The current usage metrics is available 48-96 hours after online publication and is updated daily on week days.
Initial download of the metrics may take a while.


