Fig. 5.
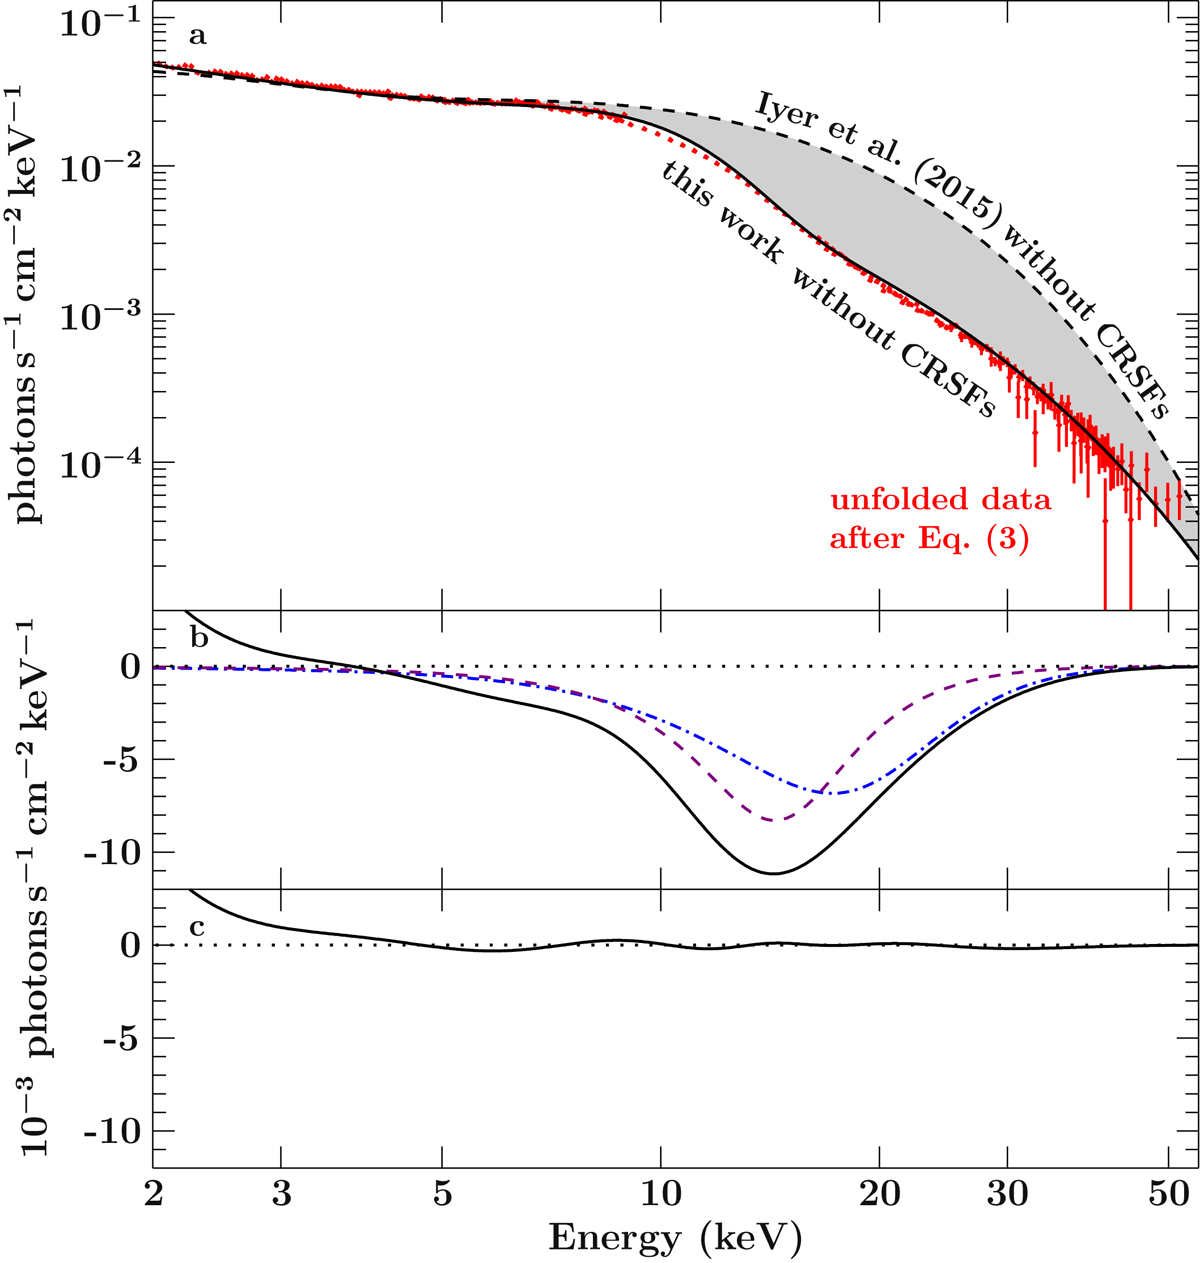
Comparison between the continuum models by Iyer et al. (2015) and this work for epoch II (RXTE and Suzaku). (a) Unabsorbed continuum model, i.e., without emission lines and CRSFs assumed by I15 (their best-fit parameters; dashed line) and this work (solid line). The continua differ significantly between 5 and 50 keV (gray shaded region). The source’s flux observed during epoch II with all instruments, unfolded using Eq. (8) and corrected for X-ray absorption, is shown for comparison (red data). (b) Difference between the continuum in this work and that of I15 (black solid line). The shapes of the CRSFs at 15 keV (purple dashed line) and the first harmonic around 20 keV (blue dashed-and-dotted line) inferred from the parameters by I15 are shown for comparison. (c) difference between the continuum-only of this work and the I15 continuum with their CRSFs at 15 keV and 20 keV included.
Current usage metrics show cumulative count of Article Views (full-text article views including HTML views, PDF and ePub downloads, according to the available data) and Abstracts Views on Vision4Press platform.
Data correspond to usage on the plateform after 2015. The current usage metrics is available 48-96 hours after online publication and is updated daily on week days.
Initial download of the metrics may take a while.