| Issue |
A&A
Volume 630, October 2019
Rosetta mission full comet phase results
|
|
|---|---|---|
| Article Number | A22 | |
| Number of page(s) | 16 | |
| Section | Planets and planetary systems | |
| DOI | https://doi.org/10.1051/0004-6361/201834764 | |
| Published online | 20 September 2019 | |
VIRTIS-H observations of the dust coma of comet 67P/Churyumov-Gerasimenko: spectral properties and color temperature variability with phase and elevation
1
LESIA,
Observatoire de Paris, PSL Research University, CNRS, Sorbonne Université, Université Paris-Diderot, Sorbonne Paris Cité,
5 place Jules Janssen,
92195 Meudon,
France
e-mail: This email address is being protected from spambots. You need JavaScript enabled to view it.
2
INAF-IAPS, Istituto di Astrofisica e Planetologia Spaziali,
Via del fosso del Cavaliere, 100,
00133 Rome, Italy
3
Institute for Planetary Research, Deutsches Zentrum für Luft- und Raumfahrt (DLR),
Rutherfordstrasse 2,
12489
Berlin, Germany
4
Departement of Physics, Oxford University,
Parks Rd,
OX13PJ, Regno Unito, Oxford, UK
Received:
3
December
2018
Accepted:
9
January
2019
Abstract
We analyze 2–5 μm spectroscopic observations of the dust coma of comet 67P/Churyumov-Gerasimenko obtained with the Visible InfraRed Thermal Imaging Spectrometer (VIRTIS-H) instrument on board Rosetta from 3 June to 29 October 2015 at heliocentric distances rh = 1.24–1.55 AU. The 2–2.5 μm color, bolometric albedo, and color temperature were measured using spectral fitting. Data obtained at α = 90° solar phase angle show an increase in bolometric albedo (0.05–0.14) with increasing altitude (0.5–8 km), accompanied by a possible marginal decrease in color and color temperature. Possible explanations include dark particles on ballistic trajectories in the inner coma and radial changes in particle composition. In the phase angle range 50°–120°, phase reddening is significant (0.031%/100 nm deg−1) for a mean color of 2%/100 nm at α = 90°, which might be related to the roughness of the dust particles. Moreover, a decrease in color temperature with decreasing phase angle is also observed at a rate of ~0.3 K deg−1, consistent with the presence of large porous particles, with low thermal inertia, and showing a significant day-to-night temperature contrast. Comparing data acquired at fixed phase angle (α = 90°), a 20% increase in bolometric albedo is observed near perihelion. Heliocentric variations in dust color are not significant in the time period we analyzed. The measured color temperatures vary from 260 to 320 K, and follow a rh−0.6 variation in the rh = 1.24–1.5 AU range, which is close to the expected rh−0.5 value.
Key words: comets: general / comets: individual: 67P/Churyumov-Gerasimenko / infrared: planetary systems
© D. Bockelée-Morvan et al. 2019
 Open Access article, published by EDP Sciences, under the terms of the Creative Commons Attribution License (http://creativecommons.org/licenses/by/4.0), which permits unrestricted use, distribution, and reproduction in any medium, provided the original work is properly cited.
1 Introduction
The Rosetta mission of the European Space Agency accompanied comet 67P/Churyumov-Gerasimenko (hereafter 67P) between 2014 and 2016 as it approached perihelion (13 August 2015) and receded from the Sun. Several in situ instruments on the Rosetta orbiter were dedicated to the study of the physical and chemical properties of the dust particles released in the coma. The Micro-Imaging Dust Analysis System (MIDAS; Riedler et al. 2007) acquired the 3D topography of 1–50 μm sized dust particles with resolutions down to a few nanometers, and showed that dust particles are agglomerates at all scales, with the smallest subunit sizes of less than 100 nm (Bentley et al. 2016). A highly porous fractal-like aggregate with a fractal dimension Df = 1.7 was collected (Mannel et al. 2016). The Cometary Secondary Ion Mass Analyzer (COSIMA; Kissel et al. 2007) collected dust particles to image them at a resolution of 14 μm and performed secondary ion mass spectroscopy. Both porous aggregates and more compact particles were observed (Langevin et al. 2016; Merouane et al. 2016). The chemical analysis indicates that these particles are made of 50% organic matter in mass, mixed with mineral phases that are mostly anhydrous (Bardyn et al. 2017). Carbon is mainly present as macromolecular material and shows similarities with the insoluble organic matter (IOM) found in carbonaceous chondrites (Fray et al. 2016). The Grain Impact Analyzer and Dust Accumulator (GIADA; Colangeli et al. 2007) measured the scattered light, speed, and momentum of individual particles in the size range of typically 150–800 μm. The majority of the detected dust is described to be porous agglomerates with a mean density of 785 kg m−3 (Fulle et al. 2017). GIADA also detected very low-density, fluffy agglomerates, with properties similar to the MIDAS fractal particles (Fulle et al. 2016).
The remote-sensing instruments on board Rosetta provided complementary information on the dust properties by measuring scattered light or thermal emission from particles. From multicolor imaging using the Optical, Spectroscopic, and Infrared Remote Imaging System (OSIRIS; Keller et al. 2007), spectral slopes were measured both for individual particles (Frattin et al. 2017) and the unresolved dust coma (Bertini et al. 2017). The observed reddening (e.g., typically 11–14%/100 nm at λ = 0.4–0.7 μm for the diffuse coma, Bertini et al. 2017) is characteristic of particles made of absorbing material, such as organics (Kolokolova et al. 2004, and references therein). Individual grains (sizes in the range of centimeters to decimeters) display differing spectra, which may be related to variations in the organic/silicate ratio and the presence of ice (Frattin et al. 2017). The spectral slopes measured on individual grains display variations with heliocentric and nucleocentric distances that could be related to physical processes in the coma affecting the released material (Frattin et al. 2017). However, spectrophotometric data of the diffuse coma obtained with OSIRIS do not show any trend with heliocentric distance and nucleocentric distance (Bertini et al. 2017).
In this paper, we analyze 2–5 μm spectra of continuum radiation from the dust coma acquired with the high spectral resolution channel of the Visible InfraRed Thermal Imaging Spectrometer (VIRTIS-H) on board Rosetta (Coradini et al. 2007). This paper is a follow-up of previous work published by Rinaldi et al. (2016, 2017; VIRTIS-M data) and Bockelée-Morvan et al. (2017; VIRTIS-H data). Although these previous studies provided information on the scattering and thermal properties of the quiescent dust coma of 67P on a few dates, namely March-April 2015 and September 2015, we analyze here a comprehensive set of VIRTIS-H data acquired from June to October 2015 (encompassing perihelion on 13 August 2015), with the heliocentric distance spanning rh = 1.24–1.55 AU. We derive the bolometric albedo and color temperature of the dust coma, as well as the spectral slope between 2 and 2.5 μm following Gehrz & Ney (1992). These parameters, which have been measured for several comets, depend on the size distribution, porosity, and composition of the dust particles (Kolokolova et al. 2004). Measurements obtained one month after perihelion at rh = 1.3 AU and 90° phase angle are consistent with values measured for most comets (Bockelée-Morvan et al. 2017). In this paper, we seek for possible variations with heliocentric distance, altitude, and phase angle.
Section 2 presents the data set. The spectral analysis is described in Sect. 3. Results are given in Sect. 4. A discussion of the observed trends with phase angle and altitude follows in Sect. 5. Appendix B presents expected thermal properties of dust particles and the model we used to interpret the variation in color temperature with phase angle.
2 VIRTIS-H data set
The VIRTIS instrument is composed of two channels: VIRTIS-M, a spectroimager with a visible (VIS; 0.25–1 μm) and an infrared (IR; 1–5 μm) channel operating at moderate spectral resolution (λ/Δλ = 70–380), and VIRTIS-H, a cross-dispersing spectrometer providing spectra with higher spectral resolution capabilities (λ/Δλ = 1300–3500) in eight orders of diffraction covering the range 1.9–5.0 μm (Table 1; Drossart et al. 2000; Coradini et al. 2007). The IR channel of VIRTIS-M underwent a cryocooler failure at the beginning of May 2015. After this date, IR data were only collected with VIRTIS-H, and we focus on these data here.
As for most Rosetta instruments, the line of sight of VIRTIS-H is along the Z-axis of the spacecraft (S/C). The instantaneous field of view (FOV) of this point instrument is 0.58 × 1.74 mrad2 (the larger dimension being along the Y -axis). Details on the calibration process are given in Bockelée-Morvan et al. (2016). The version of the calibration pipeline is CALIBROS–1.2–150126.
VIRTIS-H acquired data cubes of typically 3 h duration in various pointing modes. For coma studies, the main observing modes were (1) limb sounding at a given distance from the comet surface along the comet-Sun line; (2) limb sounding at a few stared positions along the comet-Sun line; (3) limb sounding at a few altitudes and azimuthal angles with respect to the comet-Sun direction; and (4) raster maps (see examples in Bockelée-Morvan et al. 2016). The data used in this paper were obtained with pointing modes 1–3. Dust continuum maps obtained from rasters will be the topic of a future paper.
We considered data cubes acquired from MTP016/STP058 to MTP024/STP089 covering dates from 30 May 2015 (rh = 1.53 AU) to 30 December 2015 (rh = 2.01 AU), that is, from 74 days before perihelion to 139 days after perihelion. In total, 141 data cubes were used, although those acquired after 29 October 2015 turned out to be not appropriate for model fitting of the dust continuum because of low signals (see below). Spectra were obtained by coadding acquisitions in the coma for which the exposure time was typically 3 s. Because we were interested in studying whether spectral characteristics vary with nucleus distance, we co-added acquisitions by ranges of tangent altitude (hereafter referred as to the elevation) with respect to the nucleus surface. This was done when the S/N was high enough, and when the elevation significantly varied during the acquisition of the data cube (i.e., for pointing modes 2–3). In total, 222 spectra were studied. Figure 1 provides information for each of these spectra regarding the heliocentric distance, the S/C distance to nucleus center (Δ), and the S/C-nucleus-Sun angle (referred to as the phase angle). The mean elevation for these spectra is between 0.8 and 21 km, with 64% of the spectra in the 0.8–4 km range, and 30% of the spectra in the 4–10 km range (Fig. 1). For 83% of the spectra, the co-added acquisitions were taken at elevations that differed by less than 0.5 km. For the remaining spectra, elevations ofindividual acquisitions differ by less than 1.5 km. For stared limb pointing, variation in elevation with time is observed, which is due to the mutual effects of the complex shape of the rotating nucleus of 67P and S/C motion. To define the elevation that the spectra refer to, we took the weighted mean of the elevation value of each acquisition, with the weight equal to 1/ρ, where ρ is the distance to nucleus center and is taken equal, for simplicity, to the elevation plus the mean radius of the 67P nucleus of 2 km. Column densities are expected to vary with a law close to 1/ρ, therefore weexpect a larger contribution to the signal from acquisitions with a line-of-sight closer to the nucleus.
Since the VIRTIS-H faint coma signals are affected by stray light coming from the nearby nucleus, a specific strategy has been implemented to manage these effects. Stray light polluted the low-wavelength range of each order, and more significantly, order numbered 0, covering the 4–5 μm range (Table 1). Data cubes obtained at low elevations are the most affected by stray light. An algorithm developed for stray-light removal was applied (Andrieu et al., in prep.). However, in some cases, the algorithm was not able to remove all the stray light, especially in order 0. Therefore, the different orders (which overlap in wavelength coverage) were merged by selecting the sections of the orders that are not significantly affected by stray light. The selected wavelength ranges for each order (Table 1) allow reassembling the entire spectrum in the 2–5 μm range. However, the 4.2–4.5 μm section of order 0 is affected by stray light, but also by CO2 fluorescence emissions, therefore it was not considered for the analysis of the dust continuum radiation. The degree of stray-light pollution was estimated by computing the excess of radiance in order 0 with respect to order 1 at wavelengths where these orders overlap (~4.2 μm). We excluded spectra where this excess exceeded 40%.
At the junction of the selected ranges of the different orders, spectra with low S/N show intensity discrepancies to varying degrees that are due to the instrumental response, which is low at the edges of each order. These defects were found to lead to inaccurate results when performing model fitting of the dust continuum radiation. We defined a criterion based on the ratio of the flux measured at 3 μm in order 4 with respect to the value measured at the same wavelength in order 3. In the initial sample of 222 spectra, this ratio, referred as to TEST3.0, varies between 0.95 and 2.7, with a value close to 1 indicating a high-quality spectrum. We only considered model-fitting results for spectra complying with TEST3.0 < 1.35 (173 spectra among the 222). In the following sections, we also discuss results obtained for the best-quality spectra fulfilling TEST3.0 < 1.1 (49 spectra). For these high-quality spectra, the S/N at 4.65 μm is in the range 30–80 with a few exceptions (the relevant root mean square is computed on the spectrum from the statistics of the residuals between the observed spectrum and model fit (Sect. 3) in the range 4.5–4.8 μm). The S/Ns at 3.3 μm (order 3) and 2.3 μm (order 7) are a factor 3–4 lower. Spectra with S/N at 4.65 μm lower than 12 were not considered. After we excluded spectra with high stray light pollution, we found 99 (49) spectra complying with TEST3.0 < 1.35 (TEST3.0 < 1.1) that were appropriate for model fitting. The covered time period is –71 to +78 d with respect to perihelion (3 June–29 October 2015, rh = 1.24–1.55 AU). The best-quality spectra cover dates from –43 to +78 d. Table A.1 provides information on these 99 spectra, such as VIRTIS-H observation identification number, start time of the data cube, date with respect to perihelion, spacecraft distance to nucleus center, heliocentric distance, and phase angle.
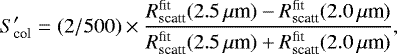
Figure 2 shows two examples of high-quality spectra that are affected by negligible stray light, obtained for the coma on 22 July 2015–8 August 2015 with a S/N of 76 and 50, respectively, at 4.65 μm. The dust continuum consists of scattered sunlight at λ < 3.5 μm and thermal radiation at longer wavelengths. Fluorescence emission bands of H2O, CO2, and 13CO2 are observedin the 2.5–3.0 and 4.2–4.4 μm ranges (see detailed description in Bockelée-Morvan et al. 2015, 2016).
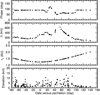 |
Fig. 1 Geometrical information for the data set constituted of averaged limb spectra. From top to bottom: S/C-nucleus-Sun angle (referred to as the phase angle), S/C distance to comet center (Δ), heliocentric distance (rh), and mean elevation (H) of the line of sight. |
VIRTIS-H diffraction orders and selected wavelengths.
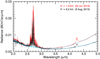 |
Fig. 2 VIRTIS-H spectra of comet 67P obtained at different elevations above the surface. Cube T1_ 00396220410 acquired on 22 July 2015 (rh = 1.27 AU) with a mean elevation H = 1.4 km (red line). Cube T1_00397139303 acquired on 8 August 2015 (rh = 1.25 AU) using selected acquisitions with H = 6.2 km (black line). The phase angle is ~89°
for both spectra. The model fits to the continuum are shown in cyan, with derived parameters (Tcol (K),
A,
|

3 Model fitting
In order to analyze the dust continuum radiation, we followed the approach presented by Bockelée-Morvan et al. (2017), which consists of modeling the dust spectrum as the sum of scattered solar flux and thermal emission (described by a blackbody function). The free parameters of the model fitting are the color temperature Tcol, the spectralindex of the reflectance, which allows us to derive the dust color  in the 2.0–2.5 μm range, and the bolometric albedo A(θ), where θ is the scattering angle (hereafter we instead use the phase angle α = 180° − θ, and assimilate the phase angle to the S/C–comet–sun angle, which is a good approximation given the large S/C distance to the comet). From the color temperature, we can derive the so-called superheating factor Sheat, defined as the ratio of the observed color temperature Tcol to the equilibrium temperature Tequ of a fast-rotating body:
 (1)
(1)
with
 (2)
(2)
where rh is in AU (this unit is used throughout the paper).
The definitions of A(θ) and Sheat follow the prescription of Gehrz & Ney (1992), which allowed us to compare the dust infrared emission properties of 67P to other comets for which these parameters have been measured (Bockelée-Morvan et al. 2017). The bolometric albedo A(θ) is approximately equal to the ratio between the scattered energy by the coma to the total incident energy, and scales proportionally to the geometric albedo times the phase function. Further details can be found in Bockelée-Morvan et al. (2017).
The dust color (or reddening) is measured in percent per 100 nm using the dust reflectance at 2.0 and 2.5 μm:
 (3)
(3)
where  (λ) is the fitted scattered light (Fig. 3) at the wavelength λ divided by the solar flux at λ (Kurucz et al. 1992).
In the fitting process, the spectral region 4.2–4.5 μm showing CO2 emissions and stray light was masked. However, unlike in Bockelée-Morvan et al. (2017), the 3.3–3.6 μm region was kept, as only very faint emission features from organics are observed in this region (Bockelée-Morvan et al. 2016). The model includes a synthetic H2O fluorescence spectrum (described in Bockelée-Morvan et al. 2015 with a rotational temperature of 100 K) with the total intensity used as free parameter, so that the 2.5–3.0 μm region presenting water lines could be considered. Despiking (using median filtering) was applied, which removes spikes such as those seen in the spectrum of Fig. 3, although this was found to be not critical. We checked that the fitting method, which uses the Levenberg–Marquardt χ2 minimization algorithm, provides correct results by applying it to synthetic spectra to which synthetic noise resembling the noise present in 67P spectra was added. When we applied our algorithm to the data set presented in Sect. 2, the best fits had a reduced χ2 very close to 1 (0.94 on average).
Figure 3 shows an example of a model fit to a dust spectrum with a high S/N, with the two components, scattered light and thermal emission, shown separately, and the retrieved free parameters indicated in the caption. The uncertainties in the retrieved parameters are probably somewhat underestimated because they only consider statistical noise and not defects in the spectra that are related to the calibration, for instance, or to possible residual stray light (see Sect. 2). For example, for the fit shown in Fig. 3, the 1σ uncertainties are 0.3, 1, and 4% for Tcol(K), A, and  , respectively (1σ confidence levels were derived as explained in Bockelée-Morvan et al. 2017). Although the noise level is low between 4.5 and 5 μm (S/N = 76), the fit is not fully satisfactory in this spectral region (Fig. 3). A small radiance offset at 3.752 μm is also observed, which corresponds to the junction of the selected wavelength ranges in orders 1 and 2 (Table 1).
It is important to point out that the retrieved free parameters are somewhat correlated because scattered light and thermal emission both contribute to the continuum in a significant fraction of the 2–5 μm spectrum (Fig. 3). A statistical analysis based on contours of equal χ2 shows that Tcol and  (and consequently A) are correlated among them. Dust color and color temperature are negatively correlated, whereas the bolometric albedo and color temperature are positively correlated. As a result, significant flaws somewhere in the spectrum can lead to spurious results that follow this trend (e.g., a lower Tcol combined with higher
  , and lower A). Effectively, we observed that spectra fulfilling the quality test TEST3.0 > 1.1 have lower Tcol, combined with higher
  and lower A, compared to values retrieved for higher quality spectra with TEST3.0 < 1.1. This is further discussed in Sect. 4.1.
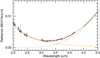 |
Fig. 3 Example of a model fit. The spectrum in black is a VIRTIS-H spectrum of comet 67P obtained on 22 July 2015 (T1_ 00396220410), without the regions excluded from fitting or presenting water and CO2
emission lines (the full spectrum is given in Fig. 2). The model fit to the continuum, which corresponds to the sum of scattered light (plain orange line) and thermal radiation (dashed green line) is shown in red. Retrieved parameters are
Tcol = 295 ± 1 K (corresponding to Sheat = 1.194 ± 0.003),
A = 0.068 ± 0.001, and |

4 Results
Figure 4 shows the bolometric albedo, color, color temperature, and superheating factor as a function of date with respect to perihelion for the 99 spectra with TEST3.0 < 1.35 and stray-light excess < 1.4, as explained in Sect. 2. The different points also characterize the 2–5 μm dust emission at various elevations of the line of sight (as indicated by the color code), and phase angles (cf. overplotted phase information in Figs. 4A, C, and D). We recall that the elevation H corresponds to the altitude of the tangent point (Sect. 2). The results are also listed in Table A.1.
Tcol ranges from 260 to 320 K and approximately follows the  variation expected from the balance between absorbed solar radiation and radiated thermal energy (Fig. 4B). The superheating factor Sheat is typically 1.2 before perihelion (phase angle α of about 90°). However, strong variations of Sheat are observed after perihelion when the Rosetta S/C was flying out of terminator (with α on the order of 60° or reaching 120°). These variations seem to be correlated with changes in the phase angle (Fig. 4C). A strong correlation with phase angle is also observed for the color
  (Fig. 4D). Whereas Sheat decreases with increasing phase angle, the reverse is observed for the color. As for the bolometric albedo, higher values are measured after perihelion (Fig. 4A), which is consistent with the phase function of cometary dust, which has a U shape with a minimum at α = 90–100° (Bertini et al. 2017). However, a trend for higher albedos at higher elevations and/or near perihelion is also suggested (Fig. 4A).
In the subsequent subsections, we analyze elevation/time and phase variations of Tcol, A(θ) and  . We also study the intensity ratio between scattered light and thermal emission. The reference for scattered light is the radiance measured at λ = 2.44 μm, obtained from the median of the radiances between 2.38 and 2.5 μm (order 6, Table 1). For the thermal emission, the reference is the radiance at λ = 4.6 μm (median of radiances between 4.5 and 4.7 μm). The intensity ratio fscatt∕ftherm is obtained by expressing the radiances in units of W m−2 sr−1 Hz−1. If the dust size distribution and composition do not vary with time and in the coma, this ratio is expected to only exhibit a heliocentric dependence proportional to
  at constant phase angle, where BB is the blackbody function at Tcol, which variesas
  . We corrected the derived intensity ratios for this heliocentric dependence assuming Sheat = 1.2 and converted it into the value at 1 AU (fscatt∕ftherm (1 AU)). As discussed at the end of Sect. 3, spectral fitting to spectra presenting some offsets at the junction of the orders can provide inaccurate results. On the other hand, the intensity ratio fscatt∕ftherm (1 AU) is directly measured on the spectra and provides reliable trends.
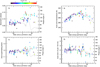 |
Fig. 4 Bolometric albedo (A), color temperature (B), superheating factor (C), and dust color (D) as a function of time with respect to perihelion. The color of the symbols is according to elevation (as indicated in the color bar). The phase angle is plotted as a dashed line in plots A, C, and D. The dashed line in plot B is the color temperature obtained for a value of the superheating factor of 1.19 and a heliocentric variation following
|

4.1 Results at 90° phase angle
In this section, we only consider measurements obtained at phase angles of between 83° and 90° (mean value of 89°). These data were acquired mainly before perihelion. The color temperature follows  K in the heliocentric range rh 1.24–1.5 AU. Considering only the best-quality data (covering 1.24–1.34 AU), we find
 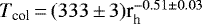 K.
K.
Figure 5 shows the bolometric albedo, color, and superheating factor as a function of elevation H (and rh using a color gradient for the symbols). The results from the highest-quality spectra (TEST3.0 < 1.1) are shown with squares, and the other data (1.1 < TEST3.0 < 1.35) are shown with dots. Sheat and  have mean values of 1.19 ± 0.01 and 2.0 ± 0.2% per 100 nm, respectively. Lower quality spectra show lower Sheat and higher color
  and albedo values that may be inaccurate (see Sect. 3). To test this hypothesis, we performed spectral fitting with the color temperature fixed to a given value. We found that an underevaluation of Sheat by 4% (Sheat = 1.15 instead of 1.2) would decrease the derived albedo by ~60%. Effectively, the albedo derived for the low-quality spectra giving Sheat = 1.15 is lower by this order of magnitude (upper panel of Fig. 5). This means that results from these spectra, especially those for which the derived color
  is well above the mean value, are doubtful a priori. On the other hand, the intensity ratio fscatt∕ftherm(1 AU), which is proportional to the bolometric albedo, presents a similar behavior with elevation and heliocentric distance, although the discrepancies between high- and low-quality spectra are somewhat smaller (Fig. 6). In conclusion, the trend for an enhanced albedo at low heliocentric distance seen in Fig. 5 is likely real, as is the trend for increased superheating with decreasing rh.
A marginal decrease in Sheat and  with increasing elevation H is suggested (best data), with a Pearson correlation coefficient R of –0.34 and –0.40, respectively (Fig. 5). We performed a multi-regression analysis to study variations with both rh and altitude. A weak rh variation in
  is suggested for Sheat, which improves the correlation coefficient with altitude to R = –0.55, with Sheat ∝ H−0.009±0.003. Multi-regression analysis did not provide convincing results for
  : no reliable variation in color with rh could be identified in this data set. Altogether, however, variations in Sheat and
  with H and rh (1.24–1.35 AU) are small.
There is evidence for a significant increase of the bolometric albedo with H (Fig. 5). This is illustrated in Fig. 2, which displays two spectra obtained at H = 1.4 and 6.2 km, the former showing a lower flux ratio fscatt∕ftherm. Since Sheat (or Tcol) shows weak variation with H, the increase in A with H reflects the increase of fscatt∕ftherm(1 AU) with H, shown in Fig. 6. We searched for possible variations in A with rh or seasonal changes, performing a multi-regression analysis to fscatt∕ftherm(1 AU). Comparing data acquired between –2 and 21 d with respect to perihelion to those acquired before (up to the end of July 1015), an average increase of 20% of fscatt∕ftherm(1 AU; and hence of the albedo) is suggested (Fig. 6). The variation with elevation follows fscatt∕ftherm(1 AU) ∝ H+0.27±0.05, where the power-law index is the average of the indexes obtained for the two time periods (Fig. 6). The bolometric albedo measured on the high-quality spectra follows the same variation.
 |
Fig. 5 Variation in bolometric albedo, superheating factor, and color with elevation H. Data obtained with phase angle α = 83–90° are considered. The color is a function of the heliocentric distance, as given by the color bar. Only data with TEST3.0 < 1.35 are plotted. Those with TEST3.0 < 1.1 are shown with large squares. The dashed lines correspond to a power law (for albedo: ∝ H−0.39±0.01) or a linear fit (for superheating factor and color) to the data points with TEST3.0 < 1.1. |
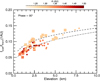 |
Fig. 6 Variation of fscatt∕ftherm (1 AU; deduced from the ratio of the radiances at 2.44 and 4.6 μm, see text) with elevation H for α = 83–90°. The color-coding and symbols are the same as for Fig. 5. Data with TEST3.0 < 1.35 are considered. The dash-dotted and dashed lines correspond to a power-law fit for data obtained between –71 and –10 d with respect to perihelion (∝ H+0.31) and between –2 and 21 d (∝ H+0.22), respectively. |
4.2 Phase variations
The dust color and color temperature exhibit a strong correlation with phase angle. The dust color is larger at large phase angles (Fig. 4C). On the other hand, the reverse is observed for the color temperature, as is best seen in the trend followed by the superheating factor (Fig. 4D). Figure 7 compares two spectra acquired with a one-week interval at α = 72 and 120°. The ratios of the thermal emissions in orders 1 (3.7–4.2 μm) and 0 (4.5–5 μm) present subtle differences (by up to 9%) that are explained by a color temperature higher by 20 K at lowphase. The fitting algorithm also retrieves a bluer color at low phase to match the 3.0–3.5 μm radiances.
We present in Figs. 8B and C the variations in color and superheating factor with phase angle. To avoid clutter at α = 90°, only dates after –2 d with respect to perihelion are plotted. The phase dependences found using the best-quality data are ~0.3 K deg−1 for Tcol, and 0.031%/100 nm deg−1 for the dust color. Significant variations with elevation are not seen.
The bolometric albedo (measured at 2 μm) follows a phase variation that matches the phase function measured at 537 nm by Bertini et al. (2017) during MTP020/STP071 (end of August 2015; Fig. 8A). The VIRTIS data present a large scatter, which prevents further comparison. We note that the dust phase function is expected to be wavelength dependent. The variation in bolometric albedo with elevation at low phases (α < 80°) follows a H0.25 law for the best data, similar to the variation measured at α = 90°, but the data show significant scatter with respect to this variation.
Phase variations of color and color temperature of cometary dust have never been reported in the literature. From detailed analysis and multiple checks, we can rule out biases related to the fitting algorithm and data quality. Because the retrieved parameters are somewhat correlated (Sect. 3), another test was to fix the color temperature according to Eq. (1), with Sheat fixed to the α = 90° value of 1.19 (Sect. 4.1). Despite the increase in χ2 values, the color trend with phase remained. However, the bolometric albedo shows a slight monotonic decrease with decreasing phase angle (i.e., no backscattering enhancement), which is not expected according to scattering models and therefore reassures us that the observed phase variations are real.
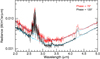 |
Fig. 7 VIRTIS-H spectra of comet 67P obtained at different phase angles (shown in logarithmic scale). Top spectrum (red): cube T1_00399392471 acquired on 28 August 2015 (rh = 1.26 AU,
α = ~72°) with a mean elevation of 4.1 km. Bottom spectrum (black): cube T1_00400433767 acquired on 7 September 2015 (rh = 1.29 AU,
α = ~120°) with a mean elevation of 2.2 km. The model fits to the continuum are shown in cyan, with derived parameters (Tcol (K),
A,
|

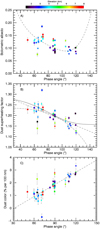 |
Fig. 8 Variation in bolometric albedo A
(top A), superheating factor Sheat
(middle B), and color |

5 Discussion
In summary, the analysis of the dust 2–5 μm continuum radiation from the coma of 67P shows (i) a mean dust color of 2%/100 nm and a superheating factor of 1.19 at 90° phase angle, consistentwith previous VIRTIS-H measurements (Bockelée-Morvan et al. 2017); (ii) a factor 2.5 increase in bolometric albedo with increasing elevation from H = 0.5 to 8 km; (iii) an increase in dust color temperature with decreasing phase angle at a rate of ~0.3 K deg−1; and (iv) spectral phase reddening at a rate of 0.032%/100 nm deg−1. More marginally, decreasing color temperature and color with increasing H are possibly observed, as are 20% higher albedo values after perihelion.
5.1 Phase reddening
The photometric properties of the dust coma present similarities with the nucleus surface. The nucleus of 67P shows a phase reddening that has been observed both in the optical (VIS; 0.5–0.8 μm) and in the near-IR (1–2μm) ranges (Ciarniello et al. 2015; Longobardo et al. 2017; Feller et al. 2016; Fornasier et al. 2016). In the near IR, the nucleus color of 67P is 3.9%/100 nm at α = 90°, with a phase reddening between 0.013 and 0.018%/100 nm deg−1 (Ciarniello et al. 2015; Longobardo et al. 2017). Phase reddening is higher in the VIS (0.04–0.1%/ 100 nm deg−1), with lower values near perihelion associated with a bluing of the surface (Fornasier et al. 2016). For the dust coma, the weighted mean of the VIS values measured by Bertini et al. (2017) using OSIRIS data (excluding spurious MTP026 results) yields 0.025%/100 nm deg−1. This is close to the values that we measured in the near-IR. However, it should be kept in mind that the VIS values are from data with a line of sight perpendicular to the nucleus–S/C vector (Bertini et al. 2017), which means that they pertain to the dust coma in the near-spacecraft environment, whereas the near-IR values characterize the near-nucleus coma. Several lines of evidence show that the dust properties vary with elevation, as discussed later on.
Phase reddening is observed for many solar system bodies, including zodiacal light (Leinert et al. 1981). For planetary surfaces, phase reddening can be interpreted as an effect of multiple scattering. For dark and porous bodies such as 67P, multiple scattering is relevant despite the low albedo because of the increase in scattering surfaces caused by the roughness of the particles present on the nucleus surface (Schröder et al. 2014). Laboratory experiments combined with numerical simulations have indeed highlighted the role of microscopic roughness in producing such a spectral effect (Beck et al. 2012; Schröder et al. 2014). Particle irregularities at a spatial scale smaller than the wavelength are also invoked to explain the phase reddening seen in the visual for interplanetary dust (10–100 μm sized; Schiffer 1985). Then, the phase reddening observed in the coma of 67P could be related to the porous structure of the particles, providing those contributing to scattered light are sufficiently large. The relative similarity in the phase curves of the dust coma and surface (especially the backscattering enhancement) is consistent with the predominance of large and fluffy dust particles in the coma, as discussed by Moreno et al. (2018), Bertini et al. (2019), and Markkanen et al. (2018), for example. Other evidence for relatively large (≥10 μm) scatterers in the coma of 67P include dust tail modeling (Moreno et al. 2017) and the unexpectedly low amount of submicron- and micron-sized particles collected by the Rosetta MIDAS experiment (Mannel et al. 2017).
5.2 Phase variation in color temperature
The color temperature excess with respect to the equilibrium temperature expected for isothermal grains is a common property of cometary atmospheres. The superheating factor measured for 67P of ~1.2 is in the mean of values observed in other comets (Bockelée-Morvan et al. 2017). This temperature excess is usually attributed to submicrometric grains composed of absorbing material (Hanner 2003; Kolokolova et al. 2004). Bockelée-Morvan et al. (2017) showed that this temperature excess could result from the contribution of hot fractal-like aggregates to near-IR thermal emission, these particles having in turn little input to scattered light. In this case, based on Mie modeling, the minimum size of the more numerous and more compact particles would be ≥20 μm (Bockelée-Morvan et al. 2017). The observed decrease in color temperature with increasing phase angle can not be explained by variations of the dust size distribution with solar azimuth angle (Shou et al. 2017), which would induce a phase curve symmetric with respect to α = 90°. On the other hand, this trend can be caused by non-isothermal grains showing day-to-night thermal contrast. This explanation holds for Saturn’s C-ring, whose thermal emission shows variations with solar phase angle (Altobelli et al. 2008; Leyrat et al. 2008).
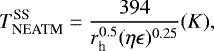
To test this hypothesis, in a first approach we used the near-Earth asteroid thermal model NEATM (Harris 1998) to describe thevariation in temperature over the surface of comet dust particles. NEATM assumes an idealized non-rotating spherical object with a temperature decreasing from a maximum at the subsolar point to zero at the terminator (there is no night-side emission). For low-albedo bodies, the surface temperature at latitude θ′ –π/2 and longitude ϕ′ (subsolar point at θ′ = 90° and ϕ′ = 0°) follows
 (4)
(4)
with
 (5)
(5)
where ϵ is the emissivity (taken equal to 0.9), and η is the so-called beaming parameter, which is used in asteroid studies as a calibration coefficient to account for the effects of thermal inertia, rotation, and surface roughness.  is the temperature at the subsolar point. Thermal emission is calculated considering the surface elements facing the observer, and it therefore depends on the phase angle (Harris 1998). We computed NEATM 3–5 μm spectra for a range of phase angles and η values. By fitting a blackbody to these spectra, we derived color temperatures, and using Eq. (1), the corresponding superheating factors. The phase variation of these computed superheating factors (dash-dotted curve in Fig. 8B) matches the variation measured for 67P dust, and the mean observed value Sheat = 1.19 at α ~90° (Sect. 4.1) is obtained for η = 1.58. We determined η for each of the data points shown in Fig. 8B. Inferred η values do not show significant phase dependence and average out at 1.59 ± 0.17. This value is intermediate between the limiting cases η = 1 (high day-to-night contrast due to low thermal inertia, slowly spinning particles, or spin axis along the Sun direction) and η = 4 (isothermal particles). This suggests that both isothermal and non-isothermal grains contribute to dust thermal emission of 67P in the 3–5 μm wavelength range.
To proceed with interpreting the data, we developed a simple model (Appendix B), considering a bimodal distribution of dust particles consisting of a mixture of isothermal particles and particles presenting day-to-night temperaturecontrast. The diurnal temperature profile of non-isothermal particles is described by the thermal parameter Θ introduced by Spencer et al. (1989), which depends on their thermal properties (which is a function of porosity) and spinning rate. Figure 9 shows examples of diurnal temperature profiles. Expected Θ values for the 67P dust particles are also given in Appendix B (Fig. B.1). The relative contribution of the isothermal particles to the total optical depth is parameterized by the quantity fiso (in the range 0–1), and their physical temperature Tiso is in excess with respect to the equilibrium temperature by a factor fheat∕ϵ0.25. Figure 10 shows the superheating factor and the slope of the phase variation in color temperature as a function of Θ for different values of fiso, considering values of fheat of 1.0 and 1.05. The non-monotonic behavior of the phase dependence for low Θ and fiso values arises because the 3–5 μm wavelength range is more sensitive to high temperatures (e.g., for high day-to-night temperature contrast, only the warm surface areas contribute to the brightness). Best match to the measurements is obtained for Θ ≤ 2, corresponding to a significant day-to-nighttemperature contrast (>1.5). Such low values of Θ imply slowly spinning particles with high porosity, low thermal inertia, or non-spinning particles (Fig. B.1). The relative contribution of isothermal particles is poorly constrained. For Θ = 2.0, solutions with fiso = 0.2–0.4 are found. On the other hand, for Θ = 0.1, a good fit to the data is obtained for fiso = 0.8 (see Fig. 8). We note that a good fit to the color temperature and its phase variation is obtained providing the physical temperature of the isothermal grains is in excess by 8% with respect to the expected equilibrium temperature (i.e., fheat = 1.05, considering an assumed emissivity of 0.9). Therefore, the presence of non-isothermal grains with a day-side surface temperature well above the equilibrium temperature alone cannot explain the superheating factor observed for cometary dust. As discussed before, a possible explanation is a significant contribution of submicron-sized absorbing grains (Hanner 2003), or alternatively, of highly porous fractal-like aggregates with submicron-sized monomers, as these particles can be warmer than more compact particles (Bockelée-Morvan et al. 2017).
A realistic size distribution of the dust particles is obviously not bimodal. It is interesting to estimate the critical radius below which the particles are isothermal, and to compare it to estimated diurnal skin depths (Appendix B, Fig. B.1). Assuming a power law for the size distribution (dN ∝ a−β da, where a is the particle radius), this critical radius acrit depends on the size index β and minimum and maximum sizes of the particles, amin and amax, and can be computed using the inferred relative contribution to the total optical depth of the two populations of particles (fiso and 1–fiso; Leyrat et al. 2008, see equations). acrit increases with increasing amin, amax and fiso, and with decreasing β. We considered size ranges amin = 1–20 μm and amax = 1–10 cm, consistent with constraints obtained for the dust of 67P (Bockelée-Morvan et al. 2017; Mannel et al. 2017; Ott et al. 2017; Schloerb et al. 2017; Moreno et al. 2018; Markkanen et al. 2018). For fiso = 0.8 (solution obtained for Θ = 0.1) and β = 2.5 (β = 3.0), acrit is in the range 0.6–6 cm (0.15–1.7 cm). These values of acrit are on the order of or higher than the estimated diurnal skin depths of ~0.3 cm for slowly spinning and high-porosity particles with Θ = 0.1 (Appendix B, Fig. B.1). For fiso = 0.3 (solution obtained for Θ = 2.0), acrit is in the range 0.09–0.9 cm (0.0015–0.02 cm) for β = 2.5 (β = 3.0). For particles with porosity of 0.5–0.9 and spinning rates consistent with Θ = 2.0, we expect diurnal skin depths from 0.01 to 0.3 cm. Altogether, except for size distributions where the opacity is dominated by small particles (those with β = 3 and amin < 10 μm, or β < 3), we infer that the critical particle size separating isothermal and non-isothermal particles is on the order of or larger than the diurnal skin depth. This is a satisfactory result since we expect particles with sizes smaller than the diurnal skin depth to be isothermal as a result of internal heat transfer.
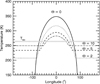 |
Fig. 9 Diurnal temperature profiles at equator of the modeled particles for different values of the thermal parameter Θ. The subsolarpoint is at zero latitude and longitude. For large Θ, the temperature reaches the constant isothermal value Tiso. Calculationsare for rh = 1.35 AU and ϵ = 0.9. |
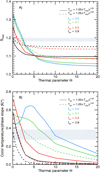 |
Fig. 10 Superheating factor Sheat (A) and phase linear dependence of the color temperature (B) from the thermal model parameterized by the thermal parameter Θ, the optical depth contribution of isothermal particles fiso, and their physical temperature Tiso. The shaded areas correspond to the measurements in the coma of 67P. |
5.3 Radial variation of the bolometric albedo
Measured bolometric albedos for the quiescent dust coma of 67P range between 0.05 and 0.15 at 90° phase angle (Fig. 5) and encompass values measured in other comets, as previously discussed by Bockelée-Morvan et al. (2017). These values correspond to a low geometric albedo and are consistent with dust particles made of dark material (Kolokolova et al. 2004; Bockelée-Morvan et al. 2017, and references therein). The VIRTIS-H observations suggest an increase in dust bolometric albedo with increasing radial distance (Sect. 4). Albedo maps obtained for comets 1P/Halley and 21P/Giacobini-Zinner by combining visible light and thermal infrared images show a similar trend: the albedos increase radially from the nucleus, except along the tail, where the albedos are lower (Telesco et al. 1986; Hammel et al. 1987). Variations in albedo may result from different composition, particle size, shape, and structure. For example, large fluffy grains may have reduced albedos because they induce multiple scattering events that allow more light to be absorbed. For this reason, the lower albedos near the nucleus and in the tail of comets 1P and 21P have been interpreted as due to the presence of large, fluffy grains escaping the nucleus with low velocities and confined in the orbital planes of the comets (Telesco et al. 1986; Hammel et al. 1987). We may thus invoke an enhanced proportion of chunks in the inner coma of 67P, in line with the conclusion obtained by Bertini et al. (2019) from the variation of the backscattering enhancement with nucleocentric distance. During the perihelion period, comet 67P underwent numerous outbursts (Vincent et al. 2016), which likely populated the inner coma with large, slowly moving dust particles, as observed for comet 17P/Holmesafter its massive 2007 outburst (Reach et al. 2010; Boissier et al. 2012). In addition, evidence for particles falling back to the nucleus is plentiful (Keller et al. 2017). Models of the density distribution for a coma dominated by gravitationally bound particles on ballistic trajectories predict an excess of particles in the inner coma with respectto the density expected for free radial outflow (Chamberlain & Hunten 1987; Gerig et al. 2018). There are some hints of such a deviation from free radial outflow in OSIRIS optical images (Gerig et al. 2018), which would be amplified if the observed trend for a lower albedo at smaller cometocentric distances is considered. Deviations are also conspicuous for the dust thermal radiation measured in the microwave, which samples essentially large particles, and shows a steep decrease of the column density at impact parameters below 10 km (Schloerb et al. 2017).
However, we previously argued for radial variations in optical properties of the individual grains, changes in the particle size distribution may also affect the bolometric albedo of the coma. Anomalously high bolometric albedos were measured in the very active comet C/1995 O1 (Hale-Bopp), and during strong jet activity of 1P/Halley, which were found to be correlated with a high silicate 10 μm band contrast and a high superheating factor Sheat, suggesting that the presence of a large amount of small particles was responsible for these high albedos (Tokunaga et al. 1986; Mason et al. 2001; Hanner 2003). Similarly, the rapidly moving 67P outburst ejecta displayed high A and Sheat, together with blue colors, which is characteristics of small particles (Bockelée-Morvan et al. 2017). Mie calculations for a porous mixture of olivine and amorphous carbon at 90° phase angle predict an increase in A from a value of 0.05, when only particle sizes >1 μm are considered, to values up to 0.20 when submicron particles are present. However, the increase in A is expected to be correlated with an increase in superheating factor. This trend between A and Sheat with increasing elevation is not observed (Sect. 4, Fig. 5). Therefore, dust fragmentation is likely not responsible for the increase in A with elevation.
Changes in the albedo may also be related to a change in the particle composition. Particles made of less absorbing material are expected to be brighter, cooler, and bluer. This trend is observed with increasing elevation, which would then imply that evaporation of some dark material took place in the inner coma. Evidence for the degradation of grains in the coma of 67P are still very rare, however (e.g., hydrogen halides and glycine are released from dust, De Keyser et al. 2017; Altwegg et al. 2016). Incidentally, we note that in presence of rapidly subliming (i.e., small and dirty) ice grains, the trend would have been opposite.
The VIRTIS-H observations suggest an increase by ~20% of the bolometric albedo in the −2 to 21 d with respect to perihelion period, when the comet was the most active, possibly associated with an increase of Sheat. This trend would be in line with an increased number of small particles at perihelion time, or alternatively, with enhanced degradation of dark material. The nucleus surface of 67P showed a global enhancement of water-ice content near perihelion (Ciarniello et al. 2016; Fornasier et al. 2016). The observed A increase would be in line with an expected increased amount of icy grains in the inner coma of 67P. On the other hand, this does not explain the trend observed for Sheat.
6 Summary and conclusion
Spectra of the dust 2–4.5 μm continuum radiation were acquired with the VIRTIS-H experiment on board the Rosetta mission to comet 67P. Through spectral fitting, we measured the dust color temperature, bolometric albedo, and 2–2.5 μm color. From the analysis of data acquired from 3 June to 29 October 2015 (rh = 1.24–1.55 AU) at line-of-sight tangent altitudes between 0.5 and 10 km, the following results were obtained:
-
At phaseangles ~90°, the color temperature varied from 260 to 320 K and followed a
 law, close to the
  variation expected from the balance between absorbed solar radiation and radiated thermal energy. A 20% increase in bolometric albedo is observed near perihelion.
 -
A mean dust color of 2%/100 nm and superheating factor of 1.19 are measured at 90° phase angle, consistent with previous VIRTIS-H measurements (Bockelée-Morvan et al. 2017).
-
A decrease in color temperature with increasing phase angle is observed, at a rate of ~0.3 K deg−1. It can be explained by the presence of large porous particles with low thermal inertia, presenting a significant day-to-night temperature contrast.
-
A large spectral phase reddening is measured. The value (0.032%/100 nm deg−1) is higher than values measured for the nucleus in the near IR (0.013–0.018%/100 nm deg−1, Ciarniello et al. 2015; Longobardo et al. 2017). This phase reddening can be related to the roughness of the dust particles.
-
The bolometric albedo was found to increase from 0.05 to 0.14 (i.e., by a factor 2.5) with increasing tangent altitude (so-called elevation in the paper) from 0.5 to 8 km. A decrease in color temperature and color with increasing altitude is marginally observed. Possible explanations include dark particles on ballistic trajectories in the inner coma, and changes in particle composition.
-
Evidence for grain fragmentation, or disappearance of icy grains, is not seen.
In future papers, we seek to explore the infrared continuum images obtained with VIRTIS-H to obtain further constraints on the dust coma of comet 67P.
Acknowledgements
The authors would like to thank the following institutions and agencies that supported this work: the Italian Space Agency (ASI – Italy), the Centre National d’Etudes Spatiales (CNES – France), the Deutsches Zentrum für Luft- und Raumfahrt (DLR – Germany), and the National Aeronautic and Space Administration (NASA – USA). VIRTIS was built by a consortium from Italy, France, and Germany, under the scientific responsibility of the Istituto di Astrofisica e Planetologia Spaziali of INAF, Rome (IT), which also led the scientific operations. The VIRTIS instrument development for ESA has been funded and managed by ASI, with contributions from the Observatoire de Meudon financed by CNES and the DLR. The instrument industrial prime contractor was the former Officine Galileo, now Leonardo company in Campi Bisenzio, Florence, IT. The authors wish to thank the Rosetta Science Ground Segment and the Rosetta Mission Operations Centre for their fantastic support throughout the early phases of the mission. The VIRTIS calibrated data will be available through the ESA Planetary Science Archive (PSA) website. With fond memories of Angioletta Coradini, conceiver of the VIRTIS instrument, our leader and friend. D.B.M. thanks E. Lellouch for enlightening discussions.
Appendix A Additional table
Log of VIRTIS-H observations and retrieved dust spectral and temperature properties.
Appendix B Thermal model for dust particles
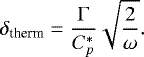
A simple approach, inherited from asteroid studies, was used to model the particle surface temperature as a function of local time. Spencer et al. (1989) showed that for smooth objects with the Sun in the equatorial plane, the diurnal temperature profile can be parameterized by a quantity Θ called thermal parameter. Θ is the function of the thermal inertia Γ, angular rotation rate ω, subsolar equilibrium temperature TSS, emissivity ϵ, and Stefan-Boltzmann constant σ:
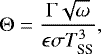 (B.1)
(B.1)
with
 (B.2)
(B.2)
where K is the thermal conductivity and  is the volumetric heat capacity.
The subsolar equilibrium temperature for dark and smooth objects is given by
![Mathematical equation: \begin{equation*} T_{\textrm{SS}} = \frac{394}{r_{\textrm{h}}^{0.5} (\epsilon)^{0.25}} [\textrm{K}].\end{equation*}](/articles/aa/full_html/2019/10/aa34764-18/aa34764-18-eq35.png) (B.3)
(B.3)
Objects with higher Θ will have lower day-to-night temperature contrast, lower subsolar temperature, and maximum temperature in the afternoon. Objects with low thermal inertia and low rotation rate have low Θ and accordingly, high temperature contrasts with maximum temperature near midday.
The diurnal skin depth is given by (Le Gall et al. 2014)
 (B.4)
(B.4)
The surface becomes isothermal with the time of the day and depth for Θ > 50 (Spencer et al. 1989). However, diurnal temperature profiles parameterized by Θ (Spencer et al. 1989) are invalid for objects with sizes in the range or lower than the diurnal skin depth δtherm. Owing to solar heat penetration, they should be isothermal. We computed Θ and δtherm for a range of parameters appropriate to the porous dust aggregates of 67P (Table B.1). The thermal conductivity Kmat, specific heat capacity Cp, and volumetric density ρmat of the material composing the monomers (i.e., subunits) correspond to values measured for carbonaceous meteorites. The adopted ρmat value is also consistent with estimations of the compacted bulk density of the dust particles of 67P (Fulle et al. 2017). The volumetric heat capacity and thermal conductivity of the aggregates depend on their porosity ϕ. We have
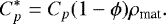 (B.5)
(B.5)
Fixed model parameters.
For the thermal conductivity, we used the empirical formula derived by Arakawa et al. (2017) for highly porous dust aggregates, giving
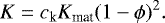 (B.6)
(B.6)
The coefficient of proportionality ck is given in Arakawa et al. (2017). Comparing this with laboratory measurements, Arakawa et al. (2017) found that this porosity dependence can be used for ϕ > 0.5. The thermal conductivity of aggregates derived from this empirical formula is K = 0.00714–0.000285 W m−1 K−1 for ϕ = 0.5–0.9.
Rotation frequencies (ω/2π) of 67P grains have been estimated by dust dynamical simulations (Fulle et al. 2015; Ivanovski et al. 2017a,b), and also measured using the light curves of individual dust particles (Fulle et al. 2015). Computed values for >100 μm size particles range from 0.03 to 4 Hz depending of grain characteristics (shape, size, and density), gas flow environment, and initial conditions (Fulle et al. 2015; Ivanovski et al. 2017a). Measurements in the low-activity phase of the comet show that the most probable rotation frequency of the grains is below 0.15 Hz (Fulle et al. 2015). The simulations show that particles experience oscillations before acquiring a full rotation at a few kilometers from the surface, with the rotation axis perpendicular to the flow direction. Modeling the surface temperature of oscillating grains is beyond the scope of this paper.
The thermal parameter, diurnal skin depth, and thermal inertia for porosities of 0.5–0.9 and rotation frequencies of 0.0001–0.1 Hz are shown in Fig. B.1. Calculations were performed with the parameters given in Table B.1. Thermal inertias are low (8–80 J m−2 K−1 s−1∕2). The diurnal skin depth ranges from ~0.01 to 0.5 cm, and the thermal parameter varies from lower than 1 (strong day-to-night contrast) for slowly rotating grains to values ~30 for relatively compact aggregates (ϕ = 0.5) with a rotation frequency of 0.1 Hz.
Spencer et al. (1989) provided diurnal temperature profiles on the equator as a funtion of Θ. In their Fig. 2, they showed the variation of TMAX/TSS and TMIN/TSS with Θ, where TMAX and TMIN are the maximum and minimum surface temperatures, respectively, and TSS is the subsolar temperature for a non-rotating body (Eq. (B.3)). We describe the surface temperature at latitude θ′ –π/2 and longitude ϕ′ (subsolar point at equator, i.e., θ′ = 90° and ϕ′ = 0°) by
 (B.7)
(B.7)
 (B.8)
(B.8)
where θ′ is in the range (0, π), and ϕ′ is in the range (–π, π). This (θ′, ϕ′) dependence corresponds to NEATM for Θ = 0, and should approximate the temperature distribution when Θ > 0 well, exceptthat the shift of the maximum temperature in the afternoon for nonzero Θ is not represented. TMAX(Θ) and TMIN(Θ) were taken from Spencer et al. (1989). Figure 9 shows diurnal temperature curves for different Θ.
We thencomputed the 3–5 μm thermal emission as a function of phase angle, considering the surface elements facing the observer (cf. NEATM model from Harris 1998). We used a bimodal distribution for the grains, consisting of isothermal grains at T = Tiso (e.g., rapidly spinning dust particles, or grains with size smaller than δtherm), and slowly spinning/low thermal inertia particles, with a temperature profile described by Θ (Eqs. (B.7)–(B.8)). This follows the approach adopted by Leyrat et al. (2008) to explain the phase variation of the color temperature of the Saturn C ring. The relative contribution of isothermal particles is given by fiso, which determines the optical depth contribution of isothermal particles (fiso = τiso/(τiso + τnon-iso)). The optical depth is proportional to the integral over size range of the size distribution times particle cross-section (e.g., Leyrat et al. 2008). The temperature of the isothermal particles is expressed as
 (B.9)
(B.9)
where Tequ, which corresponds to the equilibrium temperature for an emissivity equal to 1, is given in Eq. (1). The parameter fheat allows us to investigate dust particles heated above the equilibrium temperature. This temperature excess is expected for small particles made of absorbing material (Kolokolova et al. 2004, and references therein).
Table B.2 summarizes the free parameters of the model for computing synthesized spectra of dust thermal emission. By fitting a blackbody function to these spectra, the superheating factor as a function of phase angle can be derived and compared to VIRTIS-H measurements.
Free model parameters.
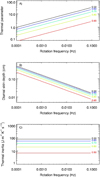 |
Fig. B.1 Thermal parameter Θ, diurnal skin depth δtherm, and thermal inertia Γ as a function of particle rotation frequency. The different curves correspond to different porosities, with values indicated in the plots. |
References
- Altobelli, N., Spilker, L. J., Leyrat, C., & Pilorz, S. 2008, Planet. Space Sci., 56, 134 [NASA ADS] [CrossRef] [Google Scholar]
- Altwegg, K., Balsiger, H., Bar-Nun, A., et al. 2016, Sci. Adv., 2, e1600285 [NASA ADS] [CrossRef] [Google Scholar]
- Arakawa, S., Tanaka, H., Kataoka, A., & Nakamoto, T. 2017, A&A, 608, L7 [NASA ADS] [CrossRef] [EDP Sciences] [Google Scholar]
- Bardyn, A., Baklouti, D., Cottin, H., et al. 2017, MNRAS, 469, S712 [CrossRef] [Google Scholar]
- Beck, P., Pommerol, A., Thomas, N., et al. 2012, Icarus, 218, 364 [NASA ADS] [CrossRef] [Google Scholar]
- Bentley, M. S., Schmied, R., Mannel, T., et al. 2016, Nature, 537, 73 [NASA ADS] [CrossRef] [Google Scholar]
- Bertini, I., La Forgia, F., Tubiana, C., et al. 2017, MNRAS, 469, S404 [CrossRef] [Google Scholar]
- Bertini, I., Forgia, F. L., Fulle, M., et al. 2018, MNRAS, 482, 2924 [Google Scholar]
- Bockelée-Morvan, D., Debout, V., Erard, S., et al. 2015, A&A, 583, A6 [NASA ADS] [CrossRef] [EDP Sciences] [Google Scholar]
- Bockelée-Morvan, D., Crovisier, J., Erard, S., et al. 2016, MNRAS, 462, S170 [Google Scholar]
- Bockelée-Morvan, D., Rinaldi, G., Erard, S., et al. 2017, MNRAS, 469, S443; Erratum: 2017, MNRAS, 469, S842 [CrossRef] [Google Scholar]
- Boissier, J., Bockelée-Morvan, D., Biver, N., et al. 2012, A&A, 542, A73 [NASA ADS] [CrossRef] [EDP Sciences] [Google Scholar]
- Chamberlain, J. W., & Hunten, D. M. 1987, International Geophysics Series, 2nd edn. (Orlando, FL: Academic Press), 36 [Google Scholar]
- Ciarniello, M., Capaccioni, F., Filacchione, G., et al. 2015, A&A, 583, A31 [NASA ADS] [CrossRef] [EDP Sciences] [Google Scholar]
- Ciarniello, M., Raponi, A., Capaccioni, F., et al. 2016, MNRAS, 462, S443 [Google Scholar]
- Colangeli, L., Lopez-Moreno, J. J., Palumbo, P., et al. 2007, Space Sci. Rev., 128, 803 [NASA ADS] [CrossRef] [Google Scholar]
- Consolmagno, G. J., Schaefer, M. W., Schaefer, B. E., et al. 2013, Planet. Space Sci., 87, 146 [NASA ADS] [CrossRef] [Google Scholar]
- Coradini, A., Capaccioni, F., Drossart, P., et al. 2007, Space Sci. Rev., 128, 529 [NASA ADS] [CrossRef] [Google Scholar]
- De Keyser, J., Dhooghe, F., Altwegg, K., et al. 2017, MNRAS, 469, S695 [CrossRef] [Google Scholar]
- Drossart, P., Semery, A., Bouye, M., et al. 2000, Proc. SPIE, 4131, 78 [NASA ADS] [CrossRef] [Google Scholar]
- Feller, C., Fornasier, S., Hasselmann, P. H., et al. 2016, MNRAS, 462, S287 [NASA ADS] [CrossRef] [Google Scholar]
- Fornasier, S., Mottola, S., Keller, H. U., et al. 2016, Science, 354, 1566 [NASA ADS] [CrossRef] [Google Scholar]
- Frattin, E., Cremonese, G., Simioni, E., et al. 2017, MNRAS, 469, S195 [CrossRef] [Google Scholar]
- Fray, N., Bardyn, A., Cottin, H., et al. 2016, Nature, 538, 72 [NASA ADS] [CrossRef] [Google Scholar]
- Fulle, M., Ivanovski, S. L., Bertini, I., et al. 2015, A&A, 583, A14 [NASA ADS] [CrossRef] [EDP Sciences] [Google Scholar]
- Fulle, M., Altobelli, N., Buratti, B., et al. 2016, MNRAS, 462, S2 [CrossRef] [Google Scholar]
- Fulle, M., Della Corte, V., Rotundi, A., et al. 2017, MNRAS, 469, S45 [Google Scholar]
- Gehrz, R. D., & Ney, E. P. 1992, Icarus, 100, 162 [NASA ADS] [CrossRef] [Google Scholar]
- Gerig, S.-B., Marschall, R., Thomas, N., et al. 2018, Icarus, 311, 1 [NASA ADS] [CrossRef] [Google Scholar]
- Hammel, H. B., Telesco, C. M., Campins, H., et al. 1987, A&A, 187, 665 [NASA ADS] [Google Scholar]
- Hanner, M. 2003, J. Quant. Spectr. Rad. Transf., 79, 695 [NASA ADS] [CrossRef] [Google Scholar]
- Harris, A. W. 1998, Icarus, 131, 291 [NASA ADS] [CrossRef] [EDP Sciences] [Google Scholar]
- Ivanovski, S. L., Zakharov, V. V., Della Corte, V., et al. 2017a, Icarus, 282, 333 [NASA ADS] [CrossRef] [Google Scholar]
- Ivanovski, S. L., Della Corte, V., Rotundi, A., et al. 2017b, MNRAS, 469, S774 [CrossRef] [Google Scholar]
- Keller, H. U., Barbieri, C., Lamy, P., et al. 2007, Space Sci. Rev., 128, 433 [NASA ADS] [CrossRef] [Google Scholar]
- Keller, H. U., Mottola, S., Hviid, S. F., et al. 2017, MNRAS, 469, S357 [CrossRef] [Google Scholar]
- Kissel, J., Altwegg, K., Clark, B. C., et al. 2007, Space Sci. Rev., 128, 823 [NASA ADS] [CrossRef] [Google Scholar]
- Kolokolova, L., Hanner, M. S., Levasseur-Regourd, A.-C., & Gustafson, B. Å. S. 2004, in Comets II (Tucson, AZ: University of Arizona Press), 577 [Google Scholar]
- Kurucz, R. L., 1992, in Synthetic Infrared Spectra in Infrared Solar Physics, eds. Rabin D. M. & Jefferies, J. T. (Dordrecht: Kluwer), Proc. IAU Symp., 154 [Google Scholar]
- Langevin, Y., Hilchenbach, M., Ligier, N., et al. 2016, Icarus, 271, 76 [NASA ADS] [CrossRef] [Google Scholar]
- Le Gall, A., Leyrat, C., Janssen, M. A., et al. 2014, Icarus, 241, 221 [NASA ADS] [CrossRef] [Google Scholar]
- Leinert, C., Richter, I., Pitz, E., & Planck, B. 1981, A&A, 103, 177 [NASA ADS] [Google Scholar]
- Leyrat, C., Ferrari, C., Charnoz, S., et al. 2008, Icarus, 196, 625 [NASA ADS] [CrossRef] [Google Scholar]
- Longobardo, A., Palomba, E., Capaccioni, F., et al. 2017, MNRAS, 469, S346 [CrossRef] [Google Scholar]
- Markkanen, J., Agarwal, J., Väisänen, T., Penttilä, A., & Muinonen, K. 2018, ApJ, 868, L16 [NASA ADS] [CrossRef] [Google Scholar]
- Macke, R. J., Consolmagno, G. J., & Britt, D. T. 2011, Meteor. Planet. Sci., 46, 1842 [NASA ADS] [CrossRef] [Google Scholar]
- Mannel, T., Bentley, M. S., Schmied, R., et.al. 2016, MNRAS, 462, S304 [NASA ADS] [CrossRef] [Google Scholar]
- Mannel, T., Bentley, M. S., Boakes, P., et al. 2017, EPSC Abstract, 11, EPSC2017-258 [Google Scholar]
- Mason, C. G., Gehrz, R. D., Jones, T. J., et al. 2001, ApJ, 549, 635 [NASA ADS] [CrossRef] [Google Scholar]
- Merouane, S., Zaprudin, B., Stenzel, O., et al. 2016, A&A, 596, A87 [NASA ADS] [CrossRef] [EDP Sciences] [Google Scholar]
- Moreno, F., Muñoz, O., Gutiérrez, P. J., et al. 2017, MNRAS, 469, S186 [CrossRef] [Google Scholar]
- Moreno, F., Guirado, D., Munz˜, O., et al. 2018, AJ, 156, 237 [NASA ADS] [CrossRef] [Google Scholar]
- Opeil, C. P., Consolmagno, G. J., & Britt, D. T. 2010, Icarus, 208, 449 [NASA ADS] [CrossRef] [Google Scholar]
- Ott, T., Drolshagen, E., Koschny, D., et al. 2017, MNRAS, 469, S276 [CrossRef] [Google Scholar]
- Reach, W. T., Vaubaillon, J., Lisse, C. M., Holloway, M., & Rho, J. 2010, Icarus, 208, 276 [NASA ADS] [CrossRef] [Google Scholar]
- Riedler, W., Torkar, K., Jeszenszky, H., et al. 2007, Space Sci. Rev., 128, 869 [NASA ADS] [CrossRef] [Google Scholar]
- Rinaldi, G., Fink, U., Doose, L., et al. 2016, MNRAS, 462, S547 [CrossRef] [Google Scholar]
- Rinaldi, G., Della Corte, V., Fulle, M., et al. 2017, MNRAS, 469, S598 [CrossRef] [Google Scholar]
- Schiffer, R. 1985, A&A, 148, 347 [NASA ADS] [Google Scholar]
- Schloerb, F. P., Gulkis, S., Biver, N., et al. 2017, AAS/Division for Planetary Sciences Meeting Abstracts, 49, 415.06 [NASA ADS] [Google Scholar]
- Schröder, S. E., Grynko, Y., Pommerol, A., et al. 2014, Icarus, 239, 201 [NASA ADS] [CrossRef] [Google Scholar]
- Shou, Y., Combi, M., Toth, G., et al. 2017, ApJ, 850, 72 [NASA ADS] [CrossRef] [Google Scholar]
- Spencer, J. R., Lebofsky, L. A., & Sykes, M. V. 1989, Icarus, 78, 337 [NASA ADS] [CrossRef] [Google Scholar]
- Telesco, C. M., Decher, R., Baugher, C., et al. 1986, ApJ, 310, L61 [NASA ADS] [CrossRef] [Google Scholar]
- Tokunaga, A. T., Golisch, W. F., Griep, D. M., Kaminski, C. D., & Hanner, M. S. 1986, AJ, 92, 1183 [NASA ADS] [CrossRef] [Google Scholar]
- Vincent, J.-B., A’Hearn, M. F., Lin, Z.-Y., et al. 2016, MNRAS, 462, S184 [CrossRef] [Google Scholar]
All Tables
Log of VIRTIS-H observations and retrieved dust spectral and temperature properties.
All Figures
|
Fig. 1 Geometrical information for the data set constituted of averaged limb spectra. From top to bottom: S/C-nucleus-Sun angle (referred to as the phase angle), S/C distance to comet center (Δ), heliocentric distance (rh), and mean elevation (H) of the line of sight. |
| In the text | |
|
Fig. 2 VIRTIS-H spectra of comet 67P obtained at different elevations above the surface. Cube T1_ 00396220410 acquired on 22 July 2015 (rh = 1.27 AU) with a mean elevation H = 1.4 km (red line). Cube T1_00397139303 acquired on 8 August 2015 (rh = 1.25 AU) using selected acquisitions with H = 6.2 km (black line). The phase angle is ~89°
for both spectra. The model fits to the continuum are shown in cyan, with derived parameters (Tcol (K),
A,
|
| In the text | |
|
Fig. 3 Example of a model fit. The spectrum in black is a VIRTIS-H spectrum of comet 67P obtained on 22 July 2015 (T1_ 00396220410), without the regions excluded from fitting or presenting water and CO2
emission lines (the full spectrum is given in Fig. 2). The model fit to the continuum, which corresponds to the sum of scattered light (plain orange line) and thermal radiation (dashed green line) is shown in red. Retrieved parameters are
Tcol = 295 ± 1 K (corresponding to Sheat = 1.194 ± 0.003),
A = 0.068 ± 0.001, and |
| In the text | |
|
Fig. 4 Bolometric albedo (A), color temperature (B), superheating factor (C), and dust color (D) as a function of time with respect to perihelion. The color of the symbols is according to elevation (as indicated in the color bar). The phase angle is plotted as a dashed line in plots A, C, and D. The dashed line in plot B is the color temperature obtained for a value of the superheating factor of 1.19 and a heliocentric variation following
|
| In the text | |
|
Fig. 5 Variation in bolometric albedo, superheating factor, and color with elevation H. Data obtained with phase angle α = 83–90° are considered. The color is a function of the heliocentric distance, as given by the color bar. Only data with TEST3.0 < 1.35 are plotted. Those with TEST3.0 < 1.1 are shown with large squares. The dashed lines correspond to a power law (for albedo: ∝ H−0.39±0.01) or a linear fit (for superheating factor and color) to the data points with TEST3.0 < 1.1. |
| In the text | |
|
Fig. 6 Variation of fscatt∕ftherm (1 AU; deduced from the ratio of the radiances at 2.44 and 4.6 μm, see text) with elevation H for α = 83–90°. The color-coding and symbols are the same as for Fig. 5. Data with TEST3.0 < 1.35 are considered. The dash-dotted and dashed lines correspond to a power-law fit for data obtained between –71 and –10 d with respect to perihelion (∝ H+0.31) and between –2 and 21 d (∝ H+0.22), respectively. |
| In the text | |
|
Fig. 7 VIRTIS-H spectra of comet 67P obtained at different phase angles (shown in logarithmic scale). Top spectrum (red): cube T1_00399392471 acquired on 28 August 2015 (rh = 1.26 AU,
α = ~72°) with a mean elevation of 4.1 km. Bottom spectrum (black): cube T1_00400433767 acquired on 7 September 2015 (rh = 1.29 AU,
α = ~120°) with a mean elevation of 2.2 km. The model fits to the continuum are shown in cyan, with derived parameters (Tcol (K),
A,
|
| In the text | |
|
Fig. 8 Variation in bolometric albedo A
(top A), superheating factor Sheat
(middle B), and color |
| In the text | |
|
Fig. 9 Diurnal temperature profiles at equator of the modeled particles for different values of the thermal parameter Θ. The subsolarpoint is at zero latitude and longitude. For large Θ, the temperature reaches the constant isothermal value Tiso. Calculationsare for rh = 1.35 AU and ϵ = 0.9. |
| In the text | |
|
Fig. 10 Superheating factor Sheat (A) and phase linear dependence of the color temperature (B) from the thermal model parameterized by the thermal parameter Θ, the optical depth contribution of isothermal particles fiso, and their physical temperature Tiso. The shaded areas correspond to the measurements in the coma of 67P. |
| In the text | |
|
Fig. B.1 Thermal parameter Θ, diurnal skin depth δtherm, and thermal inertia Γ as a function of particle rotation frequency. The different curves correspond to different porosities, with values indicated in the plots. |
| In the text | |
Current usage metrics show cumulative count of Article Views (full-text article views including HTML views, PDF and ePub downloads, according to the available data) and Abstracts Views on Vision4Press platform.
Data correspond to usage on the plateform after 2015. The current usage metrics is available 48-96 hours after online publication and is updated daily on week days.
Initial download of the metrics may take a while.