Fig. 4
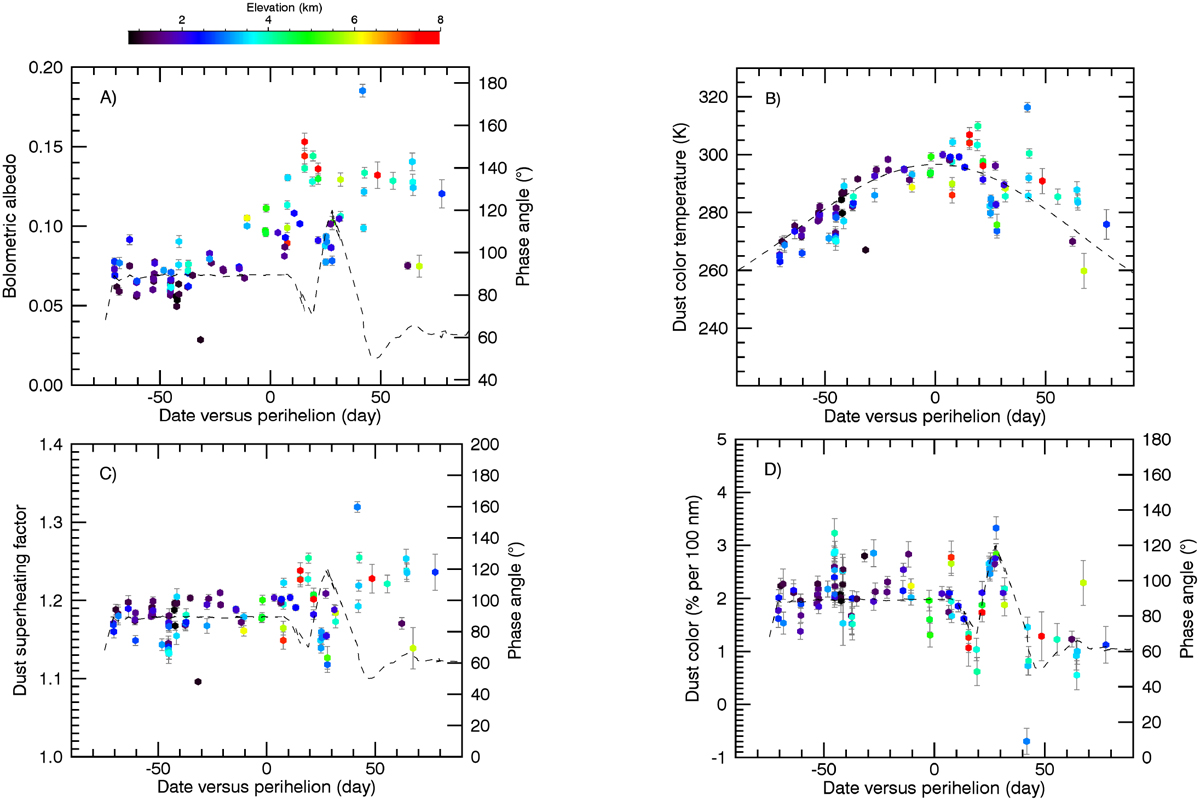
Bolometric albedo (A), color temperature (B), superheating factor (C), and dust color (D) as a function of time with respect to perihelion. The color of the symbols is according to elevation (as indicated in the color bar). The phase angle is plotted as a dashed line in plots A, C, and D. The dashed line in plot B is the color temperature obtained for a value of the superheating factor of 1.19 and a heliocentric variation following
![]() (Eq. (1)). The fitted spectra fulfill the condition TEST3.0
< 1.35.
(Eq. (1)). The fitted spectra fulfill the condition TEST3.0
< 1.35.
Current usage metrics show cumulative count of Article Views (full-text article views including HTML views, PDF and ePub downloads, according to the available data) and Abstracts Views on Vision4Press platform.
Data correspond to usage on the plateform after 2015. The current usage metrics is available 48-96 hours after online publication and is updated daily on week days.
Initial download of the metrics may take a while.