Fig. 5
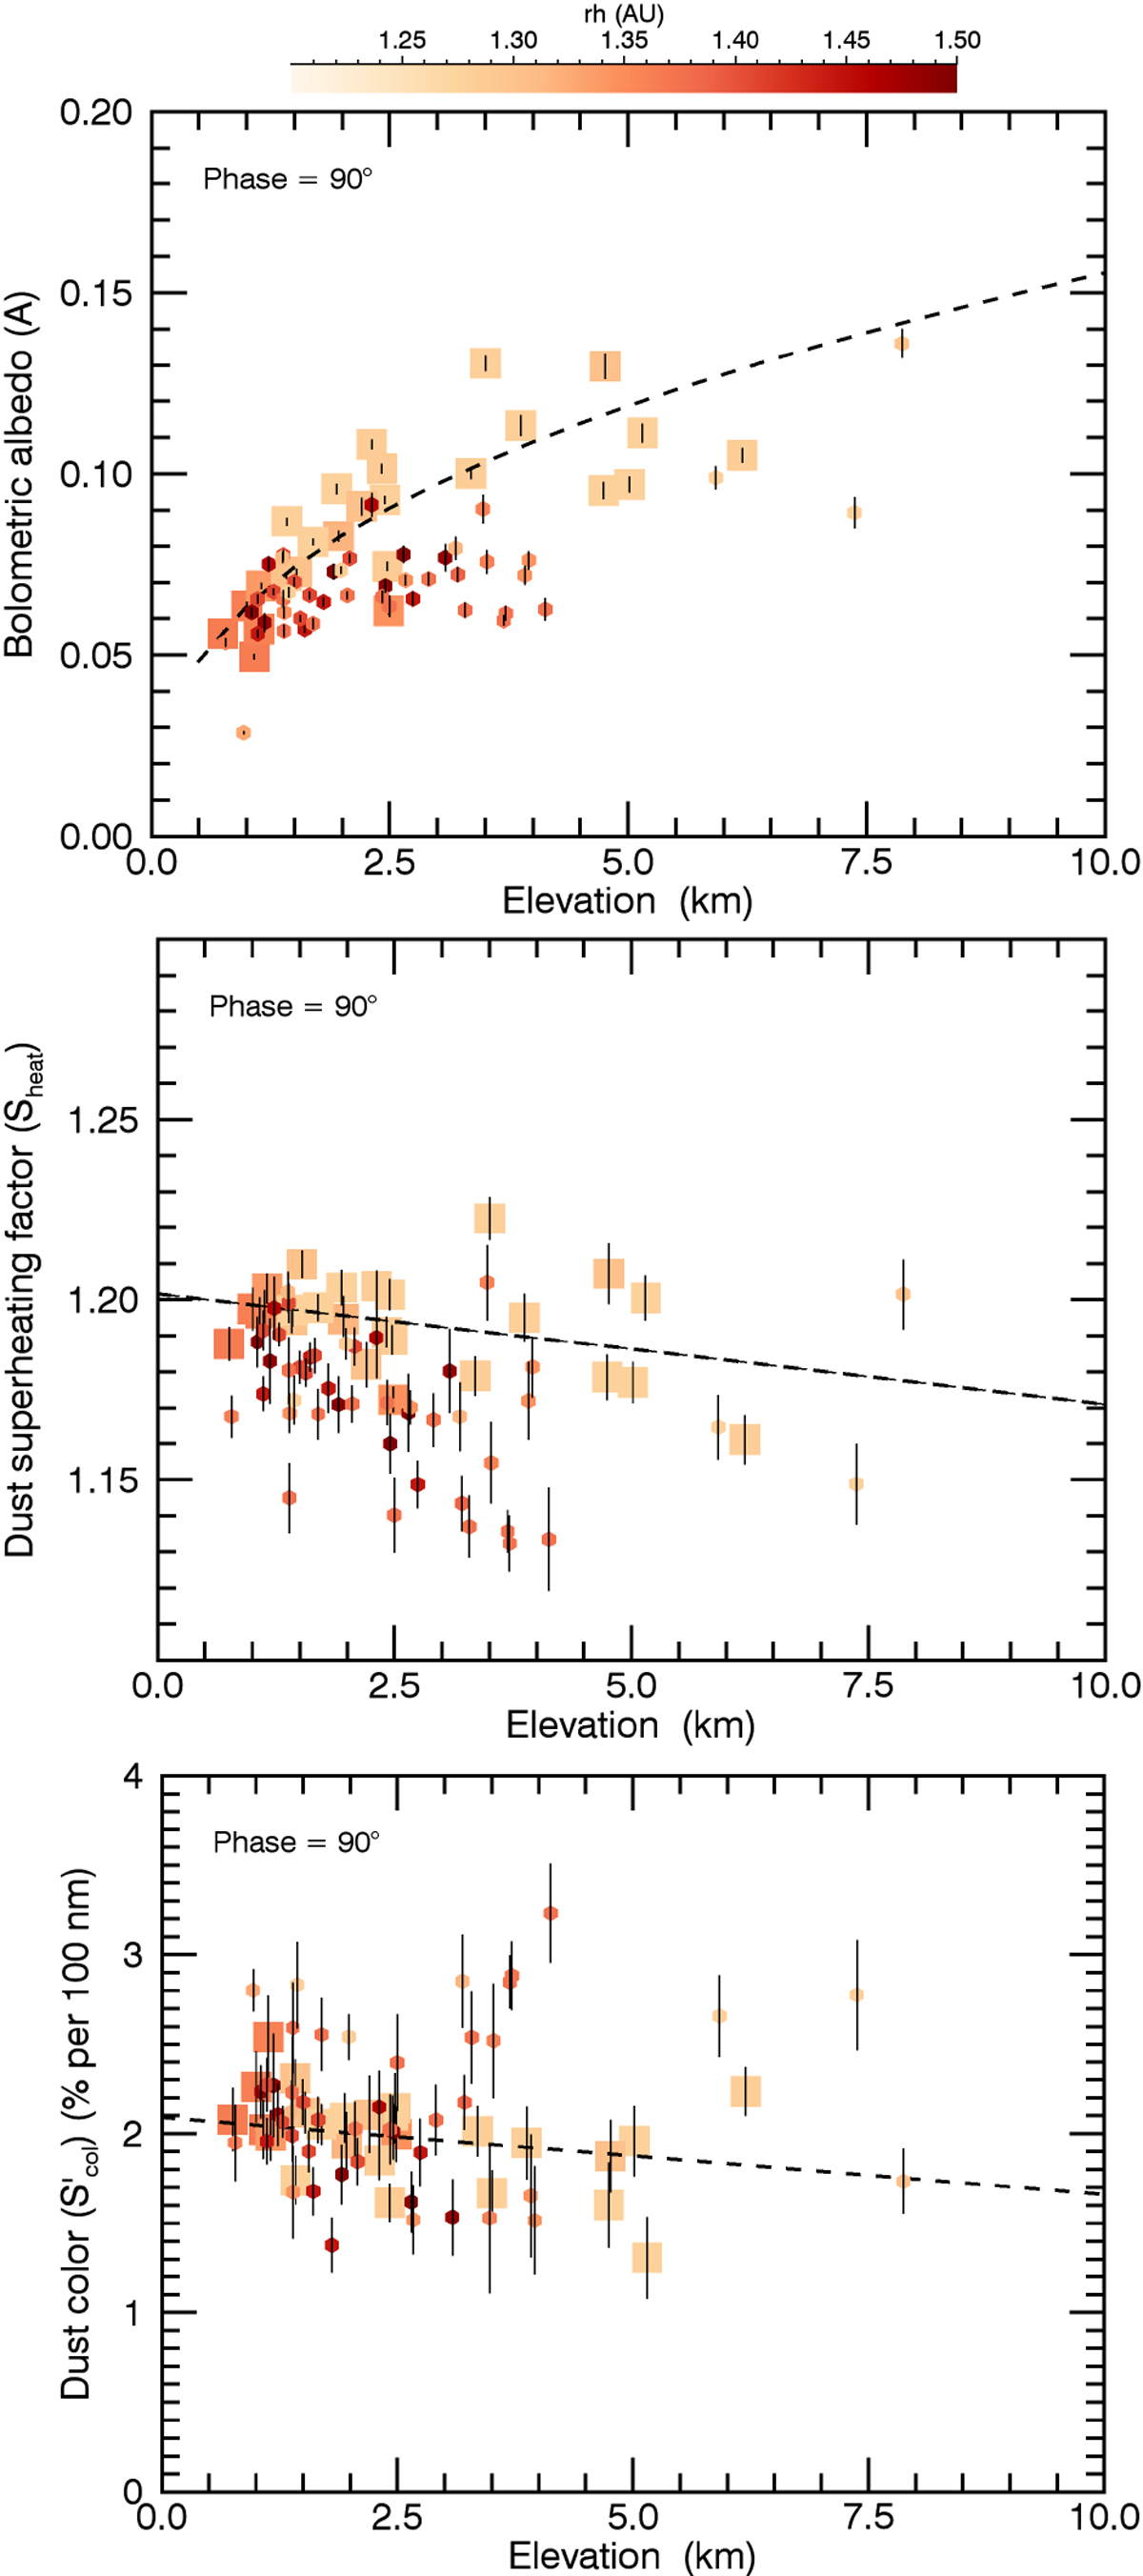
Variation in bolometric albedo, superheating factor, and color with elevation H. Data obtained with phase angle α = 83–90° are considered. The color is a function of the heliocentric distance, as given by the color bar. Only data with TEST3.0 < 1.35 are plotted. Those with TEST3.0 < 1.1 are shown with large squares. The dashed lines correspond to a power law (for albedo: ∝ H−0.39±0.01) or a linear fit (for superheating factor and color) to the data points with TEST3.0 < 1.1.
Current usage metrics show cumulative count of Article Views (full-text article views including HTML views, PDF and ePub downloads, according to the available data) and Abstracts Views on Vision4Press platform.
Data correspond to usage on the plateform after 2015. The current usage metrics is available 48-96 hours after online publication and is updated daily on week days.
Initial download of the metrics may take a while.