Fig. 8
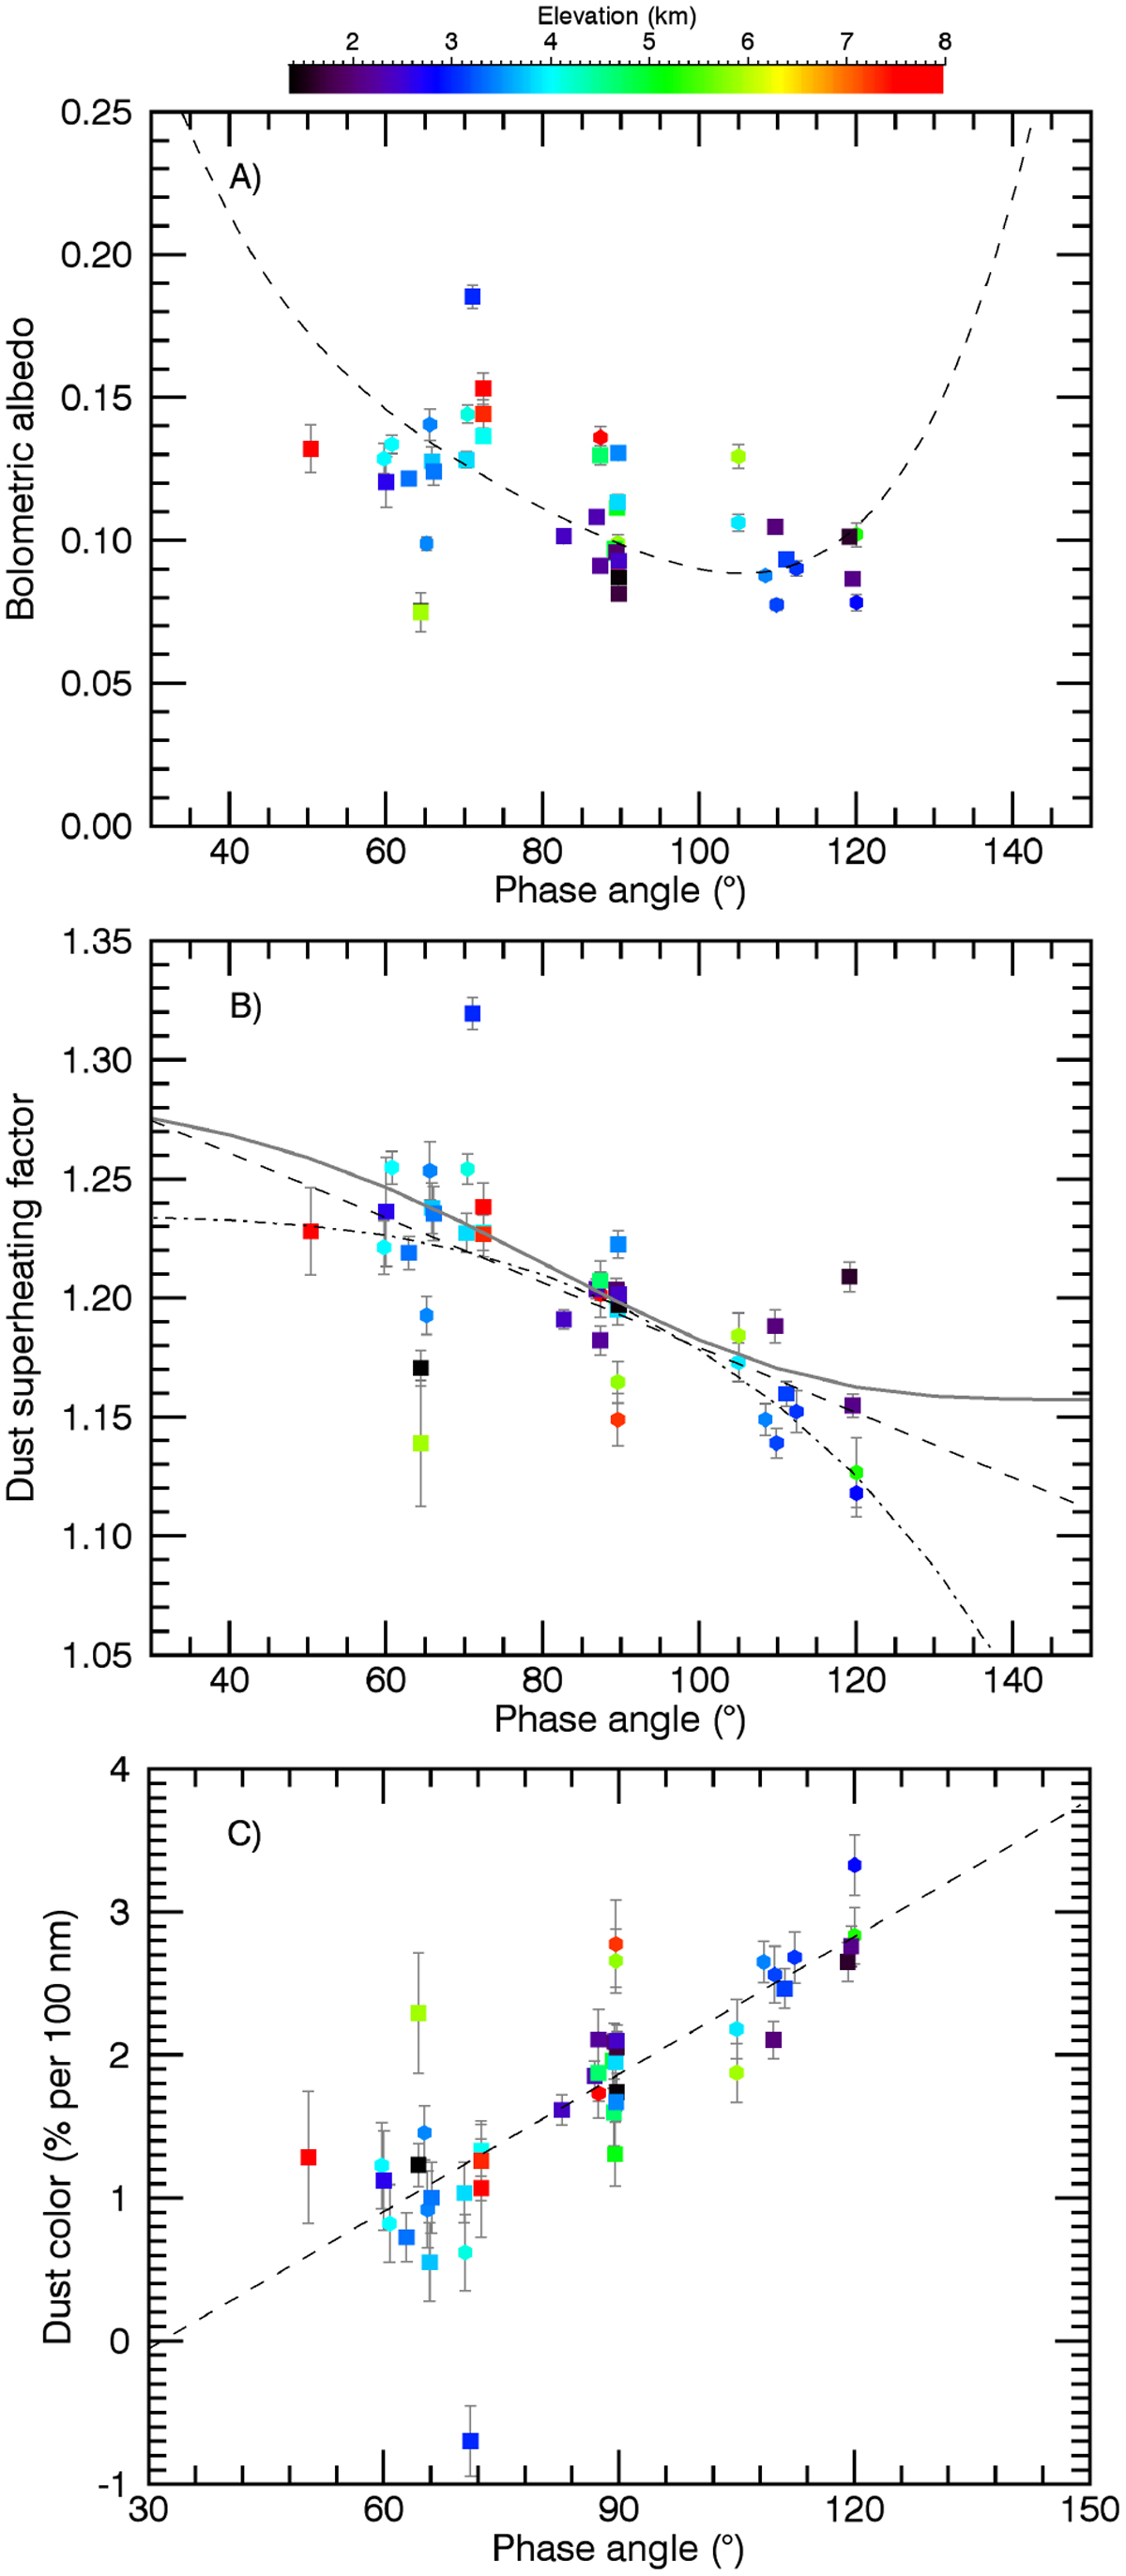
Variation in bolometric albedo A
(top A), superheating factor Sheat
(middle B), and color ![]() (bottom C) with phase angle using data taken after 11 August 2015. Data are from spectra with
TEST3.0 < 1.35; the best data (TEST3.0 < 1.1) are shown with squares. (A) The dashed line is the phase function measured during MTP020 by Bertini et al. (2017; OSIRIS green filter –537 nm). (B) The dashed line is a linear fit to Sheat
data with a slope of –0.0014 deg−1
(–0.33 K deg−1
at rh = 1.35 AU). The dash-dotted line is from the near-Earth asteroid thermal model (NEATM) with beaming parameter
η = 1.6, emissivity ϵ = 0.9, and rh = 1.35 AU. The solid line is from our dust thermal model (Sect. 5.2) with thermal parameter
Θ = 0.1, optical depth fraction of isothermal particles fiso = 0.8,
fheat = 1.05, and ϵ = 0.9. (C) The dashed line is a linear fit to the data giving a phase reddening of 0.032%/100 nm deg−1.
(bottom C) with phase angle using data taken after 11 August 2015. Data are from spectra with
TEST3.0 < 1.35; the best data (TEST3.0 < 1.1) are shown with squares. (A) The dashed line is the phase function measured during MTP020 by Bertini et al. (2017; OSIRIS green filter –537 nm). (B) The dashed line is a linear fit to Sheat
data with a slope of –0.0014 deg−1
(–0.33 K deg−1
at rh = 1.35 AU). The dash-dotted line is from the near-Earth asteroid thermal model (NEATM) with beaming parameter
η = 1.6, emissivity ϵ = 0.9, and rh = 1.35 AU. The solid line is from our dust thermal model (Sect. 5.2) with thermal parameter
Θ = 0.1, optical depth fraction of isothermal particles fiso = 0.8,
fheat = 1.05, and ϵ = 0.9. (C) The dashed line is a linear fit to the data giving a phase reddening of 0.032%/100 nm deg−1.
Current usage metrics show cumulative count of Article Views (full-text article views including HTML views, PDF and ePub downloads, according to the available data) and Abstracts Views on Vision4Press platform.
Data correspond to usage on the plateform after 2015. The current usage metrics is available 48-96 hours after online publication and is updated daily on week days.
Initial download of the metrics may take a while.