Fig. 3
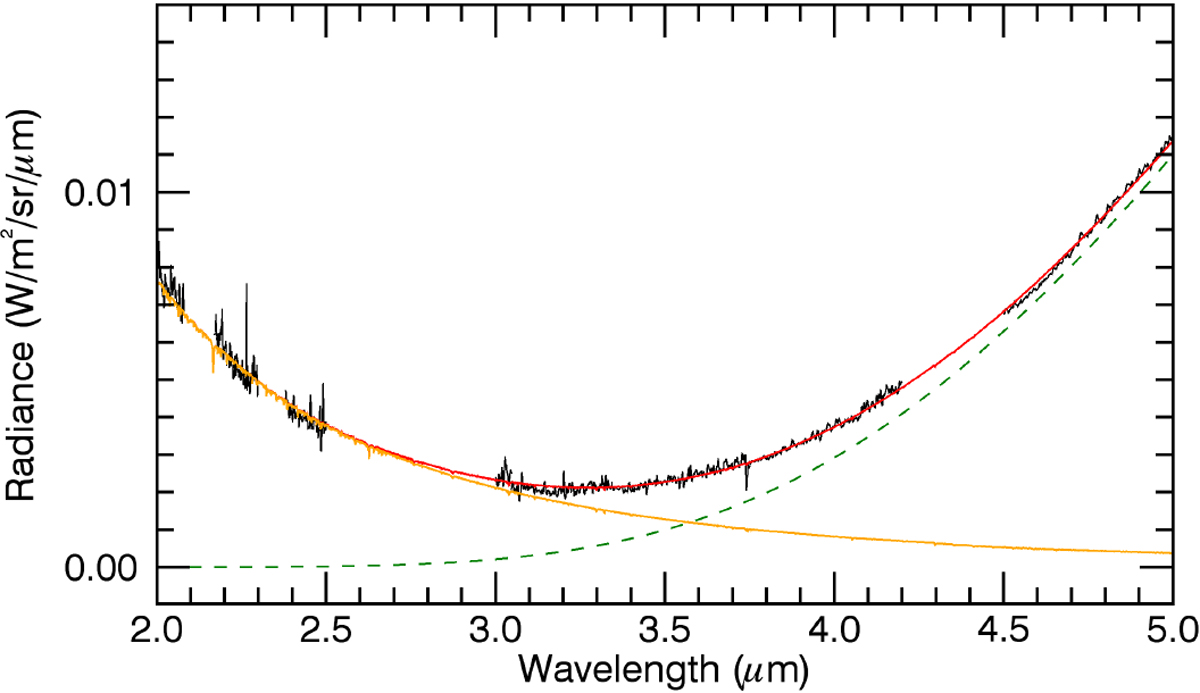
Example of a model fit. The spectrum in black is a VIRTIS-H spectrum of comet 67P obtained on 22 July 2015 (T1_ 00396220410), without the regions excluded from fitting or presenting water and CO2
emission lines (the full spectrum is given in Fig. 2). The model fit to the continuum, which corresponds to the sum of scattered light (plain orange line) and thermal radiation (dashed green line) is shown in red. Retrieved parameters are
Tcol = 295 ± 1 K (corresponding to Sheat = 1.194 ± 0.003),
A = 0.068 ± 0.001, and ![]() = 2.3 ± 0.1% per 100 nm.
= 2.3 ± 0.1% per 100 nm.
Current usage metrics show cumulative count of Article Views (full-text article views including HTML views, PDF and ePub downloads, according to the available data) and Abstracts Views on Vision4Press platform.
Data correspond to usage on the plateform after 2015. The current usage metrics is available 48-96 hours after online publication and is updated daily on week days.
Initial download of the metrics may take a while.