Fig. 6
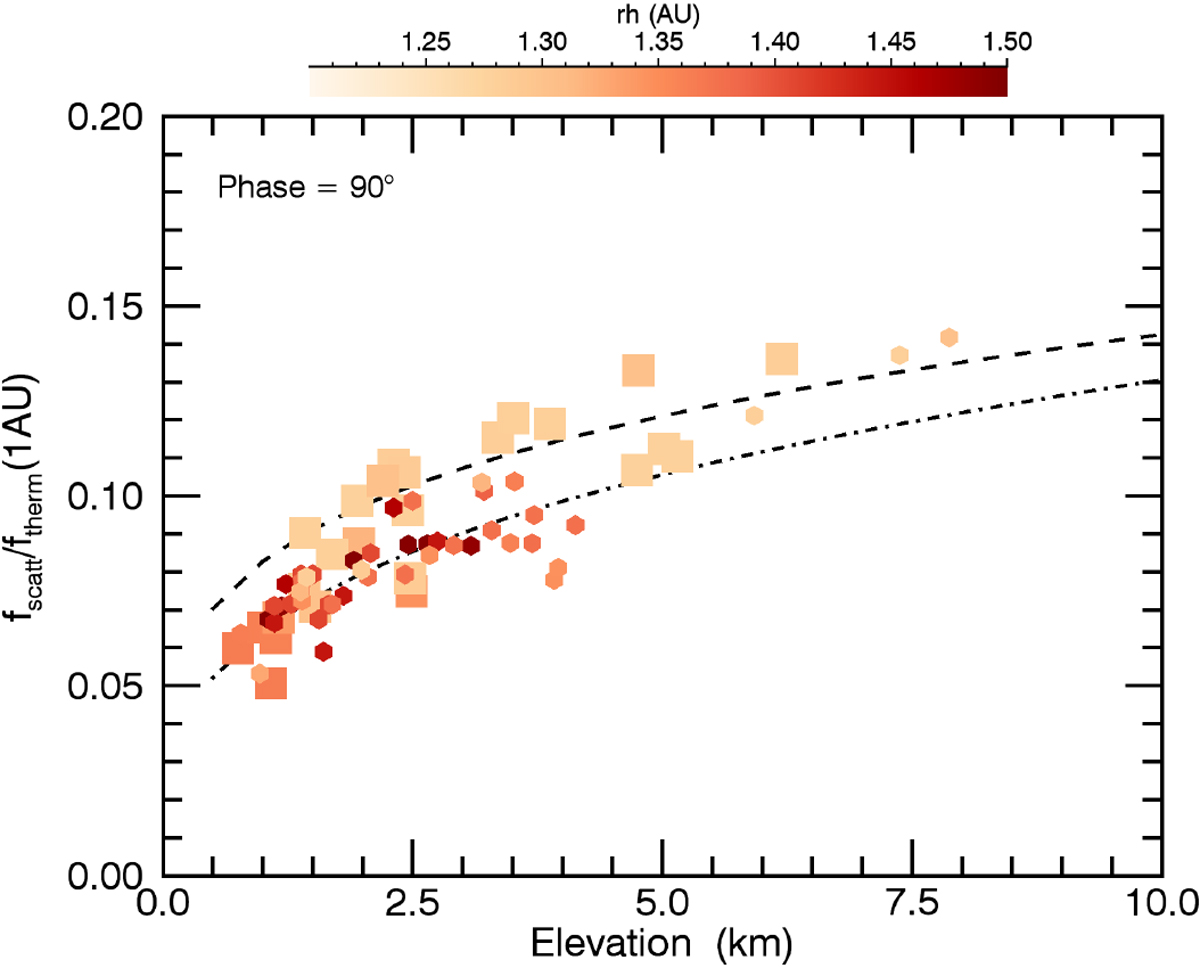
Variation of fscatt∕ftherm (1 AU; deduced from the ratio of the radiances at 2.44 and 4.6 μm, see text) with elevation H for α = 83–90°. The color-coding and symbols are the same as for Fig. 5. Data with TEST3.0 < 1.35 are considered. The dash-dotted and dashed lines correspond to a power-law fit for data obtained between –71 and –10 d with respect to perihelion (∝ H+0.31) and between –2 and 21 d (∝ H+0.22), respectively.
Current usage metrics show cumulative count of Article Views (full-text article views including HTML views, PDF and ePub downloads, according to the available data) and Abstracts Views on Vision4Press platform.
Data correspond to usage on the plateform after 2015. The current usage metrics is available 48-96 hours after online publication and is updated daily on week days.
Initial download of the metrics may take a while.