| Issue |
A&A
Volume 629, September 2019
|
|
|---|---|---|
| Article Number | A79 | |
| Number of page(s) | 17 | |
| Section | Interstellar and circumstellar matter | |
| DOI | https://doi.org/10.1051/0004-6361/201834723 | |
| Published online | 10 September 2019 | |
Gas versus dust sizes of protoplanetary discs: effects of dust evolution
1
Leiden Observatory, Leiden University,
Niels Bohrweg 2,
2333 CA
Leiden, The Netherlands
e-mail: This email address is being protected from spambots. You need JavaScript enabled to view it.
2
Max-Planck-Institute für Extraterrestrische Physik, Giessenbachstraße,
85748 Garching, Germany
3
European Southern Observatory,
Karl-Schwarzschild-Str. 2,
85748
Garching bei München,
Germany
4
Anton Pannekoek Institute for Astronomy, University of Amsterdam,
Science Park 904,
1090 GE Amsterdam, The Netherlands
Received:
27
November
2018
Accepted:
13
March
2019
Abstract
Context. The extent of the gas in protoplanetary discs is observed to be universally larger than the extent of the dust. This is often attributed to radial drift and grain growth of the millimetre grains, but line optical depth produces a similar observational signature.
Aims. We investigate in which parts of the disc structure parameter space dust evolution and line optical depth are the dominant drivers of the observed gas and dust size difference.
Methods. Using the thermochemical model DALI with dust evolution included we ran a grid of models aimed at reproducing the observed gas and dust size dichotomy.
Results. The relation between Rdust and dust evolution is non-monotonic and depends on the disc structure. The quantity Rgas is directly related to the radius where the CO column density drops below 1015 cm−2 and CO becomes photodissociated; Rgas is not affected by dust evolution but scales with the total CO content of the disc. While these cases are rare in current observations, Rgas/Rdust > 4 is a clear sign of dust evolution and radial drift in discs. For discs with a smaller Rgas/Rdust, identifying dust evolution from Rgas/Rdust requires modelling the disc structure including the total CO content. To minimize the uncertainties due to observational factors requires FWHMbeam < 1× the characteristic radius and a peak S/N > 10 on the 12CO emission moment zero map. For the dust outer radius to enclose most of the disc mass, it should be defined using a high fraction (90–95%) of the total flux. For the gas, any radius enclosing >60% of the 12CO flux contains most of the disc mass.
Conclusions. To distinguish radial drift and grain growth from line optical depth effects based on size ratios requires discs to be observed at high enough angular resolution and the disc structure should to be modelled to account for the total CO content of the disc.
Key words: protoplanetary disks / astrochemistry / molecular processes / radiative transfer / line: formation / methods: numerical
© ESO 2019
1 Introduction
Observations of exoplanetary systems have revealed that they come in a large range of sizes, from multiple planets in the central ~0.3–1 AU of the system (e.g. TRAPPIST-1 or Kepler-90; Gillon et al. 2017; Cabrera et al. 2014) to systems with Jupiter mass planets in ~70 AU orbits around their host star (HR 8799; Marois et al. 2008). The diversity in planetary systems is linked to the diversity in protoplanetary discs from which these planets have formed.
To better understand this link, measurements of the properties of these discs are required. Of particular interest are the spatial extent of the gas, which sets the evolution of the disc, and the behaviour of the millimetre grains, which form the building blocks of the planets.
Observations have shown that the gas, traced by the 12CO emission, extends further out than the millimetre grains traced by the (sub)millimetre continuum emission. Two physical processes contribute to the observed size dichotomy. The first is a difference in optical depth, with the line optical depth being much higher than the continuum optical depth (e.g. Dutrey et al. 1998; Guilloteau & Dutrey 1998; Facchini et al. 2017). Depending on how rapidly the density profile drops off in the outer disc, the optically thin continuum emission will drop below the detection limit before the optically thick 12CO emission. Based on the self-similar solution of viscous evolution, an exponentially tapered power law profile has been proposed to simultaneously fit the extent of the gas emission and the extent of the dust emission (e.g. Hughes et al. 2008; Andrews et al. 2009, see also Panić et al. 2008).
The second physical process setting the observed size dichotomy is grain growth and the subsequent inward radial drift of millimetre-sized grains. There is already extensive observational evidence that grains can grow to at least millimetre sizes (e.g. Testi et al. 2003; Natta et al. 2004; Lommen et al. 2007; Andrews & Williams 2005, 2007; Ricci et al. 2010). The large grains have decoupled from the gas. The gas is partly supported by a pressure gradient and therefore moves at slightly sub-Keplerian velocities. Gas drag causes the large grains, moving at Keplerian velocities, to slow down and move inwards. In addition, the maximum grain size seems to be decreasing as function of radial distance from the star, which is supported by both observations (e.g. Guilloteau et al. 2011; Pérez et al. 2012, 2015; Menu et al. 2014; Tazzari et al. 2016; Tripathi et al. 2018) and theoretical modelling results (e.g. Birnstiel et al. 2010, 2012).
Both radial drift and radially dependent grain growth cause the millimetre-sized grains to be confined in the inner regions of the disc, resulting in compact continuum emission at millimetre wavelengths. Dust evolution also affects the CO chemistry and gas temperature and could therefore also change the observed gas disc size, determined from the 12CO emission. Facchini et al. (2017) found that grain growth and settling results in colder gas with respect to the dust at intermediate disc heights,which reduces the CO excitation and emission.
The Atacama Large Millimeter/submillimeter Array (ALMA) is transforming our understanding of disc sizes. High resolution observations have shown that for several discs the dust outer edge drops off too sharply with radius and cannot be explained with the same exponential taper that reproduces the 12CO emission (e.g. Andrews et al. 2011a, 2016; de Gregorio-Monsalvo et al. 2013; Piétu et al. 2014; Cleeves et al. 2016).
In addition, complete surveys of discs with ALMA have made it possible to study these disc properties not only for individual discs but also for the full disc population (e.g. Taurus: Andrews et al. 2013; Ward-Duong et al. 2018, Lupus: Ansdell et al. 2016, 2018, Chamaeleon I: Pascucci et al. 2016; Long et al. 2017, Upper Sco: Barenfeld et al. 2016, 2017, σ Ori: Ansdellet al. 2017, IC 348: Ruíz-Rodríguez et al. 2018). One of the main findings of these surveys is that most discs have very compact millimetre emission. For example, in the Lupus Survey (Ansdell et al. 2016, 2018) ~ 45% remain unresolved at ~20 AU radius resolution. It should be noted that the integration time used by these surveys is short, i.e. 1–2 min per source, resulting in a low signal-to-noise ratio (S/N) on the gas lines.
Observations show that the outer radius of the gas disc, traced by the 12CO emission, is universally larger than the millimetre dust disc, as traced by the millimetre emission. Ansdell et al. (2018) measured gas and dust outer radii for 22 discs from the 12CO 2–1 emission and 1.3 mm continuum emission. They found gas-dust size ratios Rgas /Rdust ranging from 1.5 to 3.5, with an average  . Larger gas-dust ratios (Rgas/Rdust > 4) have been found for a few individual discs (e.g. Facchini et al. 2019). It should be noted that measurements of disc sizes are biased towards the most massive discs. Gas-dust sized differences for the faint end of the disc population are not well explored with current sensitivities and angular resolutions.
Both optical depth and radial drift contribute to the observed gas-dust size ratio. Quantitative comparison of how much these two effects affect the gas-dust size ratio has so far been limited to a single disc structure appropriate for the large and massive disc HD 163296 (Facchini et al. 2017).
In this paper, we expand the quantitative analysis of optical depth to a range of disc structures including dust growth and radial drift. In particular we focus on how disc mass, disc size, and dust evolution affect the gas-dust size difference. Additionally, we address what role observational factors such as resolution and sensitivity play in the observed gas-dust size difference. The set-up of the method and the models used in the paper are described in Sect. 2. The results are presented in Sect. 3. In Sect. 4 the connection between dust evolution and the dust outer radius is discussed. The conclusions are presented in Sect. 5.
2 Models
2.1 DALI with dust evolution
To study the effects of radial drift, grain growth, and optical depth on the gas-dust size dichotomy we use the thermo-chemical model DALI (Bruderer et al. 2012; Bruderer 2013) with dust evolution included by Facchini et al. (2017).
For a given physical structure, this version of DALI first calculates the radial dependence of the grain size distribution following the reconstruction routine from Birnstiel et al. (2015). This semi-analytical prescription provides a good representation of the more complete numerical models in Birnstiel et al. (2010). Birnstiel et al. (2015) divide the dust in the disc into two regimes: in the inner part of the disc, dust evolution is fragmentation dominated and the maximum grain size is set by the fragmentation barrier. In the outer disc, the maximum grain size is set by radial drift. The dust evolution is run for 1 Myr. Tests with modelsrun for 10 Myr showed that the dust evolution timescale has only minimal effect on the dust outer radius (less than 17%).
Next, dust settling is calculated by solving the advection-diffusion equation in the vertical direction for each grain size bin at every radial point in the model. Opacities are calculated at each (r, z) point of the model using the resulting local grain size distribution.
It should be noted that the local gas-to-dust mass ratio (Δgd) in the models is kept fixed at Δgd = 100, i.e. only the dust properties are changed.
The DALI thermo-chemical computation can be split into three consecutive steps: first the continuum radiative transfer equation is solved using the input stellar spectrum and the grain opacities calculated in the previous step. This is done using a 3D Monte Carlo method. Next the abundances of atomic and molecular species are calculated by solving the time dependent chemistry at each point in the model. In this step the local grain size distribution is taken into account when computing the dust surface area available for processes such as gas-grain collisions, H2 formation rate, freeze-out, thermal and non-thermal desorption, and hydrogenation. Using a non-LTE formulation the excitation of levels of the atomic and molecular species are calculated and the resulting gas temperature is determined by balancing the heating and cooling processes. Both the chemistry and the excitation are temperature dependent. The calculation is therefore performed iteratively until a self-consistent solution is found. A more detailed description of DALI can be found in Appendix A of Bruderer (2013). The implementation of dust evolution in DALI is described in Facchini et al. (2017).
2.2 Model set-up
The gas surface density profile of the models is described by a tapered power law that is often used to describe protoplanetary discs (e.g. Hughes et al. 2008; Andrews et al. 2009, 2011b; Tazzari et al. 2017). This simple parametric structure is based on the assumption that the gas structure is set by viscous accretion, where ν ∝ Rγ (Lynden-Bell & Pringle 1974; Hartmann et al. 1998), i.e.
![Mathematical equation: \begin{equation*}\Sigma_{\textrm{gas}} (R) = \frac{{M_{\textrm{disc}}} (2-\gamma)}{2\pi {R_{\textrm{c}}}^2} \left( \frac{R}{{R_{\textrm{c}}}} \right)^{-\gamma} \exp \left[-\left(\frac{R}{{R_{\textrm{c}}}}\right)^{2-\gamma}\right]. \end{equation*}](/articles/aa/full_html/2019/09/aa34723-18/aa34723-18-eq2.png) (1)
(1)
In this case, Rc is the characteristic radius where the surface density profile transitions from a power law to an exponential taper.
Under the assumption of vertical isothermality and hydrostatic equilibrium the vertical structure is given by a Gaussian density distribution (Kenyon & Hartmann 1987)
![Mathematical equation: \begin{equation*}\rho_{\textrm{gas}} = \frac{\Sigma_{\textrm{gas}}}{\sqrt{2\pi} R h} \exp \left[ - \frac{1}{2} \left( \frac{z}{Rh} \right)^2 \right], \end{equation*}](/articles/aa/full_html/2019/09/aa34723-18/aa34723-18-eq3.png) (2)
(2)
where  , ψ is the flaring power-law index and hc is the disc opening angle at Rc.
2.3 Grid of models
Both the characteristic size Rc and the total disk mass Mdisk are expected to affect the observed extent of the disk. A set of models was run varying both parameters: Rc = 20, 50 AU and Mdisk = 10−2, 10−3, 10−4, 10−5 M⊙. No models with larger Rc were run as we aim to reproduce the bulk of disk population, most of which are found to be small. For each of these physical structures three models are run with α = 10−2, 10−3, 10−4. For reference, a model with the same (Rc, Mdisc) is run using DALI without dust evolution (no drift). In this model the dust is split into two grain populations: small grains with sizes ranging between 50 Å and 1 μm and large grains with sizes between 1 μm and 1 mm. These large grains are restricted to a scale height of χh, where χ < 1, simulating that these grains have settled towards the midplane. The mass ratio of the large to the small grains is given by flarge.
Standard volatile [C]/[H] = 1.35 × 10⁻⁴ and [O]/[H] = 2.88 × 10⁻⁴ are assumed in all models and the chemistry is evolved over a timescale of 1 Myr, which is a representative age for protoplanetary disks. For longer timescales, CO is converted into CH4 /C2H2, as shown in Bosman et al. (2018) (see also Schwarz et al. 2018; Dodson-Robinson et al. 2018). This results in a overall underabundance of volatile CO, which has been found in a number of disks (e.g. Favre et al. 2013; Kama et al. 2016a; Cleeves et al. 2016; McClure et al. 2016; Miotello et al. 2017). To investigate how such an underabundance in CO affects the observed gas disk size, a subset of models was run with a lower [C]/[H] and [O]/[H]. These models are discussed in Sect. 4.1.
T Tauri stars are expected to have excess UV radiation as a result of accretion onto the stellar surface. This UV radiation is added to the spectra as a blackbody with T = 10 000 K, with a luminosity computed from the accretion rate assuming that the gravitational potential energy is released as radiation with 100% efficiency (see also Kama et al. 2016b).
For analysis, the disks are assumed to be face on (i = PA = 0°). The effect of inclination is discussed in Appendix A and is found to be minimal for i ≤ 50°. In total 32 models are run. Their parameters are found in Table 1.
DALI parameters of the physical model.
2.4 Measuring the outer radius
To investigate the gas-dust size difference we have to measure the size of a disc from observations. A disc size metric that is often adopted for these purposes makes use of the cumulative intensity profile, i.e. the flux is measured in increasingly larger apertures. The outer radius (R90) is defined as the radius that encloses 90% of the total flux (Ftot) of the disc
 (3)
(3)
This method has the advantage that it can be easily and homogeneously applied to a large number of discs, even if these discs show signs of substructure (see e.g. Tripathi et al. 2017; Ansdell et al. 2018; Andrews et al. 2018). In addition, the method can be applied to the short integration observations used in recent surveys, where the limited sensitivity hinders a more complex analysis.
It should be noted that the resulting outer radius is an observational outer radius. How well this observational radius is related to underlying physical size of the disc is examined in Sect. 4.3.
In this work, the gas outer radius is measured from the extent of the 12CO 2–1 emission in the moment zero map and the dust outer radius is measured from the extent of the 1300 μm continuum emission. Gas outer radii measured using the 12CO 3–2 emission differ from those measured using the 12CO 2–1 by less than 10%. For comparison, gas outer radii measured instead from the 13CO 2–1 emission are shown in Appendix B.
We note that the moment zero map is a velocity integrated intensity (in Jy beam−1 km s−1). This puts additional weight at the centre of the disc, where the line widths are larger. It would be more comparable to the continuum emission to use the peak intensity map, defined as the peak intensity of the spectrum at each spatial point. In Appendix C we compare gas outer radii derived from the moment 0 and the peak intensity map and find them to be nearly identical.
3 Results
In this section we investigate how dust evolution shapes the continuum and line emission and how it affects the dust and gas outer radii. This effect is quantitatively compared to the influence of other disc parameters (Mdisc, Rc) and observational factors (signal to noise, size of the beam).
3.1 Dust radial intensity profiles
Dust evolution changes the distribution of the grains responsible for the millimetre continuum emission, resulting in a different radial intensity profile. Through Eq. (3) the dust outer radius is affected by the radial profile. In this section we investigate this link.
Figure 1 shows the normalised dust radial profiles of the models with Rc = 50 AU on a logarithmic intensity scale. The radial profiles of the models with Rc = 20 AU are shown in Fig. D.1. Starting with the lowest disc mass (Mdisc = 10−5 M⊙), all intensity profiles fall off steeply in the inner 10 AU. For discs with αturb = 10−3−10−4 the intensityprofile flattens between 10 to 25 AU and then steepens again. The dust outer radii of these two models are located at the second steepening off. For the model with αturb = 10−2 and the so-called no drift model, the intensity profile is more extended and the dust outer radii of these models are larger.
For the discs with Mdisc = 10−4 M⊙ all intensity profiles of the dust evolution models are similar within 25 AU and their outer radii therefore lie close together. At higher disc mass (Mdisc ≥ 10−3 M⊙) and low viscosity (αturb ≤ 10−3) a plateau of emission can be seen. The prominence of this plateau increases as αturb decreases. For Mdisc = 10−2 M⊙ and αturb = 10−4 about 75% of the emission is in the plateau and it has a large effect on the cumulative flux and the location of R90, dust (cf. Fig. E.1).
The emission plateau is directly linked to the presence of millimetre grains in the outer disc. When αturb is low, the timescale for collisions that result in fragmentation is longer than the drift timescale and the size of the grains in the outer disc is set by radial drift (cf. Birnstiel et al. 2015). This causes a pile up of millimetre grains in the outer parts of the disc. Thus, the shape of the intensity profile is affected in a complex way by dust evolution.
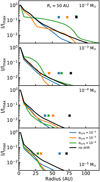 |
Fig. 1 Radial intensity profiles of the 1.3 mm continuum emission, normalised to the peak intensity, for the models with Rc = 50 AU. Crosses at an arbitrary height above the line denote the dust outer radii, defined as the radii enclosing 90% of the total flux. The resulting cumulative intensity curves are shown in Fig. E.1. |
3.2 12CO radial intensity profiles
The gas outer radius is measured from 12CO 2–1 line emission, which is expected to be mostly optically thick throughout the disc. Dust evolution could affect the 12CO emission by altering the temperature structure (Facchini et al. 2017).
In Fig. 2 the 12CO 2–1 line emission profiles of the models with Rc = 50 AU are examined. Within each mass bin, the profiles are very similar in shape, suggesting that the effect of dust evolution on the 12CO emission is neglible. The emission profiles drop off relatively slowly, which is expected for optically thick line emission that follows the temperature profile. At a certain radius the emission profile drops off steeply. In the model this radius corresponds to where the CO column (NCO) density drops below 1015 cm−2. Below a CO column density of NCO ≤ 1015 cm−2, CO is no longer able to effectively self-shield against photodissociation and is quickly removed from the gas phase (van Dishoeck & Black 1988). Defining the radius at which NCO = 1015 cm−2 as RCO disk, this radius effectively encloses all of the CO emission and all of the volatile CO in the disc.
Using simple arguments, the observed gas outer radius R90, gas can be related analytically to RCO disk. Assuming that the CO emission is optically thick (ICO ~ Tgas(R) ∝ R−β) and that RCO disk encloses all 12CO flux, we can write (full derivation can be found in Appendix F)
 (4)
(4)
where f represents amore general case where the gas outer radius is defined using a flux fraction f.
Based on Eq. (4) the fraction of flux f used to define the gas outer radius should not affect the dependence of Rf, gas on disc parameters such as Mgas or Rc. To highlight this point, Fig. 3 compares gas outer radii defined using 90 and 68% of the total flux. Independent of Mgas, Rc, and αturb the models follow a tight linear relation that matches the expected relation R68, gas = 0.73R90, gas, based on Eq. (4).
Summarising, the observational gas outer radius is directly related to the point of the disc where the CO column density reaches NCO = 1015 cm−2. This relation is independent of the flux fraction used to define the gas outer radius.
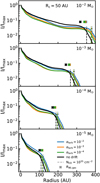 |
Fig. 2 Radial intensity profiles of the 12CO 2–1 line emission, normalised to the peak intensity, for models with Rc = 50 AU. Crosses above the line denote the dust outer radii, defined as the radii enclosing 90% of the total flux. Vertical dashed lines denote the radius at which the CO column density drops below 1015 cm −2, where it canbe photodissociated effectively. |
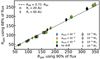 |
Fig. 3 Comparison between gas outer radii calculated using 90% of the flux and 68% of the flux. Dashed line shows the expected relation between these two observational outer radii based on Eq. (4). |
3.3 Effect of dust evolution on R90,dust and R90,gas
In the previous section dust evolution was shown to change the continuum intensity profile and the dust outer radius. Dust evolution also affects the CO chemistry (Facchini et al. 2017) and could therefore change the gas outer radius.
Figure 4 shows gas and dust outer radii as function of the turbulent α for different points in our (Mdisc–Rc) parameter space. Compared to the no drift model, the dust radii of the dust evolution models are smaller up to a factor 1.5. No obvious trend of Rdust with αturb is found. The dust outer radius scales with αvisc at high disc mass of 10−2 M⊙, corresponding to a disc dust mass of 10−4 M⊙. The trend is negative, with a higher α corresponding to a smaller R90, dust. At high α fragmentation sets the maximum grain size throughout the disc, preventing millimetre grains from forming.
For lower disc masses the behaviour of R90, dust as function of αturb depends on the characteristic size of the disc Rc. The intensity profile of discs with Rc = 20 AU is dominated by an inner core that is largely unaffected by αturb. As a result R90, dust remains approximately constant with αturb. For the larger discs (Rc = 50 AU) R90, dust varies with αturb, but the trends are not monotonic for Mdisc = 10−3–10−4 M⊙. For Mdisc = 10−5 the trend is monotonic again, but now R90, dust is larger for higher αturb.
The effect of dust evolution on the gas outer radius is shown in Fig. 5. There are no noticeable changes in R90, gas when αturb is varied, indicating that R90, gas is unaffected by dust evolution. The gas radii of the dust evolution models are larger than the gas radius of the no drift model.
A possible explanation is a difference in the amount of small grains in the outer disc. In the no drift model a fixed fraction of the dust is in small grains. In the dust evolution model the maximum grain size decreases with radius, representing the larger grains drifting inwards. However, in our model framework no mass is actually transferred inwards. As a result the amount of small grains in the outer disc is enhanced. These small grains can help shield the CO against photodissociation, allowing it to exist further out in the disc.
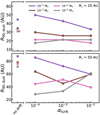 |
Fig. 4 For models with different (Mdisc, Rc), R90, dust as function of αturb. Top panel: models with Rc = 20 AU. Bottom panel: models with Rc = 50 AU. The crosses show the R90, dust for no drift model. |
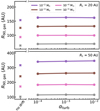 |
Fig. 5 For models with different (Mdisc, Rc), R90, gas as function of αturb. Top panel: models with Rc = 20 AU. Bottom panel: models with Rc = 50 AU. The crosses show the R90, gas for the no drift model. |
3.4 Effect of disc mass on R90,gas and R90,dust
The observed gas-dust size difference is also affected by the difference in optical depth. The value R90, dust is calculated from the millimetre continuum emission, that is mostly optically thin, whereas R90, gas is calculated from the opticallythick 12CO line emission. As optical depth is directly related to column density, the mass of the disc is also expected influence the observed outer radii.
Figure 6 shows R90, gas as function of Mdisc for our standard model and models with different αturb. The gas outer radii increase linearly with log10Mdisk, from ~3 × Rc at Mdisc = 10−5 M⊙ up to ~8 × Rc at Mdisc = 10−2 M⊙.
This relation can be understood qualitatively using the results from Sect. 3.2. Based on Eq. (4) and Fig. 6, we can write RCO disk ~ R90, gas ∝ log10Mdisc. In the outer disc the column density scales as  . At a radius RCO disk the CO column density is known and the equation can be inverted to obtain
  , similar to the relation found in Fig. 6.
It should be pointed that the dependence of R90, gas on Mdisc is set by the shape of the density profile in the outer disc. In our models the density profile in the outer parts is described by an exponential, giving rise to the logarithmic dependence of R90, gas on Mdisc. If some process is affecting the density structure of the outer disc (e.g. due to tidal truncation or external photoevaporation; Facchini et al. 2016; Winter et al. 2018), the relation R90, gas ∝ logMdisc no longer holds. Instead the relation between R90, gas and Mdisc is set by the altered shape of the density structure in the region where NCO = 1015 cm−2.
The dust radii, shown as solid lines in Fig. 6, also increase with disc mass, but to a much smaller degree than the gas radii. Over the mass range considered in this work the dust radii increase by up to 1.5– 2 × Rc. This is likely due to the millimetre continuum emission remaining optically thin throughout most of the disc. As the disc mass increases, the total continuum flux also increases, but the shape of the intensity profile and R90, dust derived from that profile remains largely unchanged. The small increase with dust mass can be attributed to a core of optically thick emission in the inner part of the disc. For higher disc masses this core increases in size which moves the 90% flux contour outwards. Overall we find that the effect of disc mass and optical depth on R90, gas is much larger than the effect of dust evolution on R90, dust.
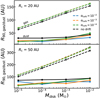 |
Fig. 6 Disc outer radii vs. disc mass. Top panel: models with Rc = 20 AU. Bottom panel: models with Rc = 50 AU. Solid lines show dust outer radii. Dashed lines show gas outer radii. |
3.5 Dust evolution tracer: R90,gas/R90,dust
Combining the effects of dust evolution and disc mass (cf. Sects. 3.3 and 3.4), we now look at the gas-dust size dichotomy, quantified by R90, gas/R90, dust. Figure 7 shows R90, gas/R90, dust as function of Mdisc. The fiducial no drift models show that R90,gas/ R90,dust = 1.5–3.5, with a positive trend between R90,gas/R90,dust and Mdisc. Comparing to Fig. 6this trend isa direct result of R90, gas increasing with Mdisc.
The dust evolution models all lie above the no drift models, indicating that for a given disc mass a model that includes radial drift and grain growth has a larger R90, gas/R90, dust than a model that only includes the effects of optical depth.
For the dust evolution models with Rc = 50 AU, an overall positive trend of R90, gas/R90, dust with disc mass is found, but the trend is not monotonic and depends on αturb. For the smaller Rc = 20 AU models the trend becomes negative towards higher disc masses.
From the trends in Fig. 7 it is clear that the size dichotomy R90, gas/R90, dust can be used to identify dust evolution if the ratio is high enough (R90, gas/R90, dust ≥ 4). Observationally, these cases are rare (see e.g. Facchini et al. 2019). For the majority of discs, a lower ratio is observed (cf. Ansdell et al. 2018). To identify dust evolution in these discs requires modelling of their 12CO and dust emission, taking into account their total CO and dust content. The results also show that a direct determination of αturb from R90, gas/R90, dust is not possible.
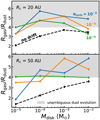 |
Fig. 7 Disc mass vs. R90, gas/R90, dust. Top panel: models with Rc = 20 AU. Bottom panel: models with Rc = 50 AU. Dashedlines show the no drift model, without dust evolution. |
3.6 Observational factors affecting R90,gas/R90,dust
3.6.1 Effect of beam size
Observational factors such as the size of the beam and the background noise level are also able to influence the gas-dust size dichotomy. Convolution with the beam smears out the intensity profile. For a centrally peaked intensity profile this moves R90 outwards. We use the full width at half maximum of the beam (FWHMbeam) as a measure of the beam size. For a beam size much larger than the observed disc the intrinsic differences between the gas and dust emission are washed out and R90, gas/R90, dust is expected to approach unity.
Figure 8 shows the effect of beam size on R90, gas/R90, dust for an example disc with Mdisc = 10−4 M⊙ and Rc = 50 AU. Similarpanels for the other models are shown in Fig. G.1. The quantity R90, gas/R90, dust decreases with beam size, approaching unity when the beam size becomes ~3 × Rc. At a beam size ~1 × Rc, R90, gas/R90, dust has dropped below 4 and dust evolution can no longer be unambiguously be identified using only R90, gas/R90, dust (see Sect. 3.5). However, if the uncertainties on R90, gas/R90, dust are sufficiently small and the total CO content of the disc is known, dust evolution can still be inferred from observations with FWHMbeam ≤ 2Rc.
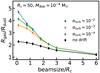 |
Fig. 8 Beamsize vs. R90, gas/R90, dust. The effectof the beam scales with its relative size compared to the diameter of the disc. To highlight this, the beam size is expressed in terms of the characteristic size of the disc. Similar figures for various Mdisc and Rc are shown in Fig. G.1. |
3.6.2 Effect of noise level
Noise has two ways in which it can interact with the observational outer radius. Noise affects the shape of the curveof growth, thus changing the radius that encloses 90% of the total flux. In addition, the noise in the image sets the uncertainty on the total flux, which propagates through into the errors on R90. For the gas-dust size difference, the noise on the gas emission is dominant. This is due to a difference in bandwidth: the gas emission is narrow in frequency, typically ~0.5km s−1, whereas thecontinuum emission uses the full bandwidth of the observations. For example, a typical ALMA band 6 observation that has three continuum spectral windows (with a total bandwidth Δνbandwidth ≃ 2 GHz) and 1 line spectral window centred on the 12CO line (with line width Δνline ≃ 0.384 MHz), the noise on the continuum is a factor 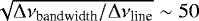 lower compared to the line emission.
To simulate the effect of noise, empty channels taken from ALMA observations are added to the model image cube after convolution.The size of the convolution beam used for the model was matched to that of observations of Lupus discs (0.′′25; Ansdell et al. 2018). The rms of the noise was scaled to obtain the requested peak S/N in the moment 0 map for the models.
The results are shown in Fig. 9 for the same example disc (Mdisc = 10−4 M⊙, Rc = 50 AU). The other discs are shown in Fig. G.2. The average R90, gas/R90, dust measured at low S/Nmom 0 is smaller than the noiseless case. As the S/Nmom 0 increases it converges to the value measured in the absence of noise. A peak S/Nmom 0 ~ 10 is sufficient to recover the R90, gas/R90, dust of the noiseless case. The uncertainties on R90, gas/R90, dust are reduced when the peak S/Nmom 0 increases, down to ≤10% at a peak S/Nmom 0 of ~ 30. We note however that the noiseless R90, gas/R90, dust is recovered within the error bars of the measured R90, gas/R90, dust already at peak S/Nmom 0 ~ 5.
Summarising the effect of the observational factors, two recommendations for future observations can be made. Firstly, differentiating between only optical depth and dust evolution in addition to optical depth requires FWHMbeam ≤ 1 × Rc. For a disc with Rc = 20 at 150 pc, this means a beam size of 0.′′14 = 20 AU. Secondly, to accurately measure the gas-dust size difference requires a peak S/N ≥ 10 in the 12CO moment zero. We note that an increased sensitivity will improve the uncertainty on the measured R90, gas/R90, dust and can thus better distinguish cases where R90, gas/R90, dust is unambiguously >4.
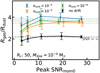 |
Fig. 9 Peak S/N in the moment 0 map of the 12CO emission vs. R90, gas/R90, dust. Similar figures for various Mdisc and Rc are shown in Fig. G.2. Peak S/N vs. R90,gas is shown in Fig. H.1. |
4 Discussion
4.1 CO underabundance and R90,gas
In our models we have assumed standard interstellar medium (ISM) abundances for carbon and oxygen, resulting in an overall CO abundance of xCO ~ 10−4. However, recent observations have found CO to be underabundant by a factor 10– 100 with respect to the ISM in several discs (e.g. Favre et al. 2013; Kama et al. 2016a; Cleeves et al. 2016; McClure et al. 2016). The low CO-based disc gas masses found by recent surveys suggest that CO could be underabundant in most discs (see e.g. Ansdell et al. 2016; Miotello et al. 2017; Long et al. 2017). As shown in Sect. 3.4 R90, gas is directly related to the CO content of the disc. The observed underabundance of CO in discs causes them to have a smaller observed gas disc size compared to our models.
To quantify the effect of CO underabundance on the measured R90, gas the models with Mdisc = 10−2 M⊙ were rerun, but now the total amount of carbon and oxygen in the disc is reduced by a factor δC,O = 0.1–0.01, mimicking the observed underabundance of CO. Figure 10 shows that R90, gas decreases linearly with log10δC,O, similar to the R90, gas ∝ log10Mdisc found earlier. This again highlights the importance of total CO content of the disc. As an example, let us consider two discs with the same total CO content. The first disc has a higher disk mass but is underabundant in CO (Mdisc, δC,O) = (10−2 M⊙, 0.1). The second disc is less massive but has standard ISM abundances (Mdisc, δC,O) = (10−3 M⊙, 1). For both discs we obtain the same R90, gas, indicating that the gas outer radius depends on the total CO content of the disc.
A lower R90, gas also results in a lower R90, gas/R90, dust. Figure 11 shows R90, gas/R90, dust as function of CO underabundance δC,O. In the case of no CO underabundance (δC,O = 1), R90, gas/R90, dust = 2.5–5.5. By decreasing the amount of CO in the disc by a factor of 100, the gas disc size decreases leading to R90, gas/R90, dust = 1.5 for the no drift model and R90, gas/R90, dust = 2–3.5 for the dust evolution models. We note that these values are for a disc with Mdisk = 10−2 M⊙. For a less massive disc that is also underabundant in CO R90, gas/R90, dust is lower (cf. Sect. 3.4).
For a sample of 22 discs, Ansdell et al. (2018) measured R90, gas from the 12CO 2–1 emission and R90, dust from the 1.3 mm continuum emission and found R90, gas/R90, dust = 1.5–3.5. The sampleis skewed towards the most massive discs in their sample, where Mdust = 0.5–2.7 × 10⁻⁴ M⊙. This makes these massive discs comparable in dust content to the models discussed in this section (Mdust= 10−4 M⊙). A simple, first order comparison between the models and the observations can therefore be made. CO underabundances of the discs in the Lupus sample are calculated by assuming a gas-to-dust mass ratio of 100 and comparing that to the ratio of MCO based/Mdust, where MCO based is the CO-based gas mass estimate from Miotello et al. (2017). For example, a disc with MCO based = 10−3 M⊙ and Mdust = 10−4 M⊙ is interpreted as having a CO underabundance of  .
.
The calculated CO abundances show that several discs in the sample have δC,O ≤ 10−2. For the same CO underabundance, the no drift model has R90, gas/R90, dust = 1.5–2.0, which is at the low end or below the observed range, suggesting that a least for some of the sources in the sample explaining the observed R90, gas/R90, dust requires dust evolution. Modelling of the individual sources is required to provide a definitive identification of dust evolution, which is beyond the scope of this work (but see Trapman et al. 2018).
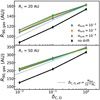 |
Fig. 10 Discouter radii vs. CO underabundance. For comparison, the outer radii for the no drift model is shown in grey. Top panel: models with Rc = 20 AU. Bottom panel: models with Rc = 50 AU. |
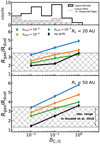 |
Fig. 11 CO underabundance vs. R90, gas/R90, dust. Middle panel: models with Rc = 20 AU. Bottom panel: models with Rc = 50 AU. The observed range of R90, gas/R90, dust from Ansdell et al. (2018) is shown in grey. Top panel: histogram of the gas-to-dust ratios measured in Lupus (Ansdell et al. 2016; Miotello et al. 2017). These have been converted into an effective CO underabundance using δC,O, eff = Δgd/100, where Δgd is the gas-to-dust mass ratio. |
4.2 Effect of the surface density slope on outer radii
The surface density is governed by three parameters: Rc, Mdisc, and γ (cf. Eq. (1)). The slope γ sets how the material is distributed in the disc and therefore affects the outer radius of the disc. In addition, the physical processes involved in dust evolution are also affected by γ. The slope of the gas surface density is not well constrained, having been observational constrained only for a few discs (e.g. Cleeves et al. 2016; Williams & McPartland 2016; Zhang et al. 2017; Miotello et al. 2018). Most of these studies find a value of γ ~ 1.0. In this section we investigate how much R90, gas/R90, dust depends on γ. Figure 12 shows R90, gas/R90, dust versus γ = [0.5, 1.0, 1.5] for a set of low mass and high mass models. For low mass discs (Mdisc = 10−5 M⊙), R90, gas/R90, dust increases drastically when γ is increased from 1.0 to 1.5 and has values of R90, gas/R90, dust ≃ 24 for models with dust evolution.
For the discs with dust evolution and γ = 1.5, millimetre-sized grains have been removed from the disc except for the inner few AU. As a result, the continuum emission is concentrated in this inner region and a very small dust outer radius is inferred. For the no drift model the dust radius is not similarly affected and the gas-dust size difference only increases to R90, gas/R90, dust = 3.7.
Increasing γ for the high mass disc does not have a significant effect on R90, gas/R90, dust. For the high mass disc the trends are similar for the no drift model and the dust evolution models. Here dust evolution is not significantly affected by the change in γ. For both low and high mass discs, decreasing γ from 1.0 to 0.5 results in a R90, gas/R90, dust that is lower by a factor ~2.
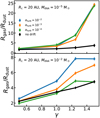 |
Fig. 12 R90, gas/R90, dust as functionof the slope of the gas surface density. Top panel: models with Mdisc = 10−5 M⊙. Bottom panel: models with Mdisc = 10−2 M⊙. |
4.3 Match of observed Rout to physical size of the disc
In this work we have quantified the radial extent of the disc using R90, a flux based measure of the size of the disc. For this radius to be the outer edge of the disc in a physical sense, we could require that it encloses most (e.g. ≥90%) of the total mass of the disc.
In the cumulative intensity method used to define R90, gas and R90, dust, a free parameter is the fraction of total flux f used (cf. Eq. (3)). In this work the outer radius is set at 90% of the total flux under the assumption that this radius encloses most of the disc. We investigate the requirement on f if we want the outer radius to enclose ≥90% of the mass.
Figure 13 shows, for a given f used to compute R90, gas and R90, dust, what fraction of the total disc mass is enclosed within this outer radius. Similar figures for the other discs in the model grid are shown in Appendix I.
For the dust emission, show in the top panel of Fig. 13, the fraction of enclosed disc mass (fmass) correlates with the fraction of total flux (fflux) used to define the outer radius.The relation between fmass and fflux is roughly linear, however the exact trend depends on αturb, Mdisc, and Rc. Using a flux fraction of fflux = 0.9, between 75 and 90% of the total mass is enclosed with the exact fraction depending on αturb. At fflux = 0.68 this has dropped to between 60 and 84% of the total mass.
The bottom panel of Fig. 13 shows that for the 12CO emission, any gas outer radius R90, gas defined using a fraction of total flux fflux > 60% encloses almost all (>98%) of the total disc mass and would thus meet our criterion of a physical outer radius (i.e. enclosing ≥ 90% of Mdisc). According to the definition of Eq. (3), these observational outer radii are not the same size. For example, a radius enclosing 90% of the flux has to be larger than a radius enclosing 75% of the flux. These observational outer radii are all related through Eq. (4) to the same physical point in the disc, where the CO column density equals 1015 cm−2 (cf. Sect. 3.2).
Summarising, the fraction of mass enclosed by Rdust scales roughly linearly with the fraction of continuum flux used to define Rdust. To have the dust radius enclose most of the disc mass, the outer radius should be defined using a high fraction (90– 95%) of the total flux. For the gas, any radius enclosing >60% of the flux contains most of the mass.
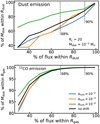 |
Fig. 13 Fraction of flux f used to calculate Rdust and R90, gas compared to the fraction of Mdisc within Rdust and R90, gas. Top panel: dust emission; bottom panel: gas emission. |
5 Conclusions
The gas in protoplanetary discs is found to be universally more extended than the dust. This effect can result from grain growth and subsequent inward drift of millimetre-sized grains. However, the difference in line optical depth between the optically thick 12CO emission of the gas and the optically thin continuum emission of the dust also produces a gas-dust size dichotomy. In this work the thermochemical code DALI (Bruderer et al. 2012; Bruderer 2013), extended to include dust evolution (Facchini et al. 2017), is used to run a grid of models. Using these models, the impact of dust evolution, optical depth, and disc structure parameters on the observed gas-dust size difference are investigated. Our main conclusions can be summarised as follows:
-
Including dust evolution leads to smaller observationally derived dust radii and larger gas radii. Dust evolution, as quantified by αturb, has a complex effect on the dust radius, which also depends on the disc mass and the characteristic radius. The gas outer radius is unaffected by changes in αturb.
-
The gas outer radius R90, gas is directly related to the radius at which the CO column density drops below 1015 cm−2 where CO becomes photodissociated. The value R90, gas scales with the product Mdisc ⋅ xCO, the total CO content of the disc; Rgas is directly related to the radius where 12CO no longer is able to self-shield.
-
The quantity R90, gas/R90, dust increases with the total CO content and is higher for discs that include dust evolution. Discs with R90, gas/R90, dust > 4 are difficult to explain without dust evolution. For R90, gas/R90, dust < 4, deducing whether or not a disc is affected by dust evolution from the size ratio requires a measure of the total CO content. However, constraining αturb using R90, gas/R90, dust is not possible.
-
Increasing the beam size and lowering the peak S/N of the 12CO moment 0 map both decrease the measured R90, gas/R90, dust. To minimize the effect of these observational factors requires FWHMbeam ≤ 1 × Rc and S/Npeak, mom 0 > 10.
-
R90, gas/R90, dust increases with the slope of the surface density γ. In low mass discs with high γ, dust evolution removes almost all grains from the disc, resulting in large gas-dust size differences (R90, gas/R90, dust ~ 24).
-
To have the dust radius enclose most of the disc mass, the outer radius should be defined using a high fraction (90–95%) of the total flux. For the gas, any radius enclosing >60% of the flux contains most of the mass.
The gas-dust size dichotomy is predominantly set by the structure and CO gas content of the disc, which can produce size differences up to R90, gas/R90, dust ~ 4. Discs with R90, gas/R90, dust > 4 can be directly identified as having undergone dust evolution, provided the gas and dust radii were measured with FWHMbeam ≤ 1 × Rc. However, these discs are rare in current observations. For discs with a smaller gas-dust size difference, modelling of the disc structure including the total CO gas content is required to identify radial drift and grain growth.
Acknowledgements
We would like to thank Dr. G. Rosotti for useful discussions and we thank the anonymous referee for the useful comments that helped improve the paper. L.T. and M.R.H. are supported by NWO grant 614.001.352. Astrochemistry in Leiden is supported by the Netherlands Research School for Astronomy (NOVA). S.F. is supported by an ESO fellowship. All figures were generated with the PYTHON-based package MATPLOTLIB (Hunter 2007).
Appendix A Effect of inclination
In the analysis in this work all disc radii were measured from discs with an inclination of 0°. Inclination increases the optical depth along the line of sight. This can affect the measured size of the disc, especially for the gas, which is determined from optically thick emission (cf. Sect. 2.4).
Figures A.1 and A.2 show gas and dust radii measured from images with an inclination of i = 0°, 30°, 60°. For the inclined images, the cumulative flux is instead calculated using elliptical apertures to account for the projection. Between i = 0° and i = 30° there is no noticeable difference in the outer radii. For 60° outer radii have become slightly larger, but even at the most extreme the effect is smaller than a 50% increase. Thus the effect of inclination should only be considered for discs with high inclination (i >60°) when trying to identify dust evolution.
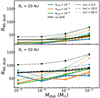 |
Fig. A.1 Effect of inclination on measuring the dust outer radius. Discs with a RC = 20 AU and RC = 50 AU are shown in the top and bottom panel, respectively. |
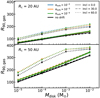 |
Fig. A.2 Effect of inclination on measuring the gas outer radius. Discs with a RC = 20 AU and RC = 50 AU are shown in the top and bottom panel, respectively. |
Appendix B Measuring R90,gas from 13CO 2–1 momentzero maps
In this appendix, we investigate how the gas outer radius would differ, if instead it had been defined as the radius enclosing 90% of the 13CO 3–2 flux. 13CO is added to the model parametrically, by taking the CO abundances and scaling them with the 12C/13C elemental ratio, assumed to be 12C/13C = 77.
Figure B.1 shows R90, gas(13CO) and R90, gas(12CO) as functionof disc mass. The value R90, gas(13CO) also with disc mass in a similar manner to R90, gas(12CO), i.e. R90, gas(13CO) ~ log10Mdisk. As a result, using the 13CO emission does not change the quali- tative results seen in this work.
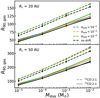 |
Fig. B.1 Comparison of gas outer radii measured from 13CO 2–1 emission(solid lines) and 12CO 2–1 emission (dashed lines). |
Figure B.2 shows the ratio R90, gas(12CO)/R90, gas(13CO) for different disc masses. On average, R90, gas(12CO) is 30–45% larger than R90, gas(13CO) and has variations because αturb, Rc, or Mdisc are small. However we do not consider the effects of isotope-selective photodissociation, which become relevant in the outer part of the disc (cf. Miotello et al. 2014).
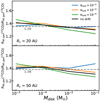 |
Fig. B.2 Ratio of gas outer radii measured from 12CO 2–1 emission(R90, gas(12CO)) over 13CO 2–1 emission(R90, gas(13CO)). The mean ratio of all models is shown in grey. |
Appendix C Measuring R90,gas from peak intensity maps
The extent of the gas emission is measured from the moment zero map, which is constructed by integrating in spectral image cube over the frequency axis. As a result the gas emission has units (Jy beam−1 km s−1). This method places extra emphasis on the inner part of the disc, where the Keplerian velocity structure of the gas produces the widest line profiles (in velocity).
Another method would be to measure the gas radius using the peak intensity map, which is the intensity at peak velocity. This map has units identical to the continuum emission (Jy beam−1). Compared to the moment 0 map more weight is placed in the outer parts of the disc, moving R90, gas outwards. By removing the dependence on the line width the peak intensity map might also be less affected by inclination (cf. Appendix A).
Figure C.1 shows a comparison between gas outer radii derived from the moment 0 map (shown on the left) and the peak intensity map (shown on the right) for three different inclinations. For the inclined discs (i =30, 60°), there is indeed more emission in the outer disc for the peak intensity map. In all cases R90, gas(peak int.) is larger than the R90, gas(mom 0).
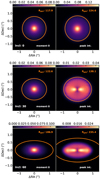 |
Fig. C.1 Comparison between outer radii derived from 12CO moment 0 map (left) and the peak intensity (moment 8) map (right). The model shown has Mdisc = 10−3 M⊙, Rc = 50 AU, and αturb = 10−4. |
In Fig. C.2 R90, gas(peak int.) and R90, gas(mom 0) are compared as functions of disc mass and inclination. Over the mass range examined we find that R90, gas(peak int.) > R90, gas(mom 0). However, apart from this offset, R90, gas(peak int.) follows the same trend with disc mass as R90, gas(mom 0) and is also similarly affected by inclination.
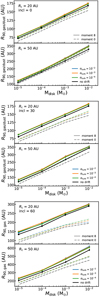 |
Fig. C.2 Gas radii measured from the peak intensity map vs. disc mass. Top, middle, and bottom figures: discs with inclinations of 0°, 30°, and 60°, respectively |
Appendix D Continuum intensity profiles for Rc = 20 AU
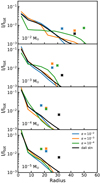 |
Fig. D.1 Radial profiles of 1300 μm normalised to the total flux. Crosses above the line denote the radii enclosing 90% of the flux (heights of the crosses are arbitrary). |
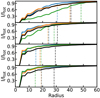 |
Fig. D.2 1300 μm curve of growth of the profiles seen in Fig. D.1. Dashed vertical line denotes the radii enclosing 90% of the flux. |
Appendix E Curves of growth for the Rc = 50 AU dust profiles
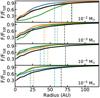 |
Fig. E.1 1300 μm curve of growth of the profiles seen in Fig. 1. Dashed vertical line denote the radii enclosing 90% of the flux. |
Appendix F Deriving a relation between R90,gas and the CO column density
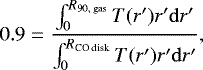
In Sect. 3.2 the 12CO emission profile was found to quickly drop off at a point very close to where the CO column density (NCO) drops below 1015 cm−2. Defining RCO disk as the radius where NCO = 1015 cm−2, we can derive an analytical relation between R90, gas and RCO disk.
Using Eq. (3), R90, gas is defined as
![Mathematical equation: \begin{align}0.9 &= \frac{2\pi}{F_{\textrm{tot}}} \int^{{R_{\textrm{90, gas}}}}_{0} I_{\textrm{CO}}(r')r' \mathrm{d}r'\\[3pt] & = \frac{\int^{{R_{\textrm{90, gas}}}}_{0} I_{\textrm{CO}}(r')r' \mathrm{d}r'}{\int^{{R_{\textrm{CO\ disk}}}}_{0} I_{\textrm{CO}}(r')r' \mathrm{d}r'}. \end{align}](/articles/aa/full_html/2019/09/aa34723-18/aa34723-18-eq11.png)
In this case we used the fact that RCO disk effectively encloses all of the 12CO flux (cf. Fig. 2). If we assume that the 12CO emission is optically thick, 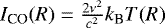 , the equation can be rewritten
 (F.3)
(F.3)
where Tgas is the gas temperature in the CO emitting layer. The temperature profile can often be well described by a power law,  , which can be substituted in the integrals
![Mathematical equation: \begin{align}0.9 & = \frac{\int^{{R_{\textrm{90, gas}}}}_{0} \left(\frac{r'}{R_{\textrm{c}}}\right)^{-\beta}r' \mathrm{d}r'}{\int^{{R_{\textrm{CO\ disk}}}}_{0} \left(\frac{r'}{R_{\textrm{c}}}\right)^{-\beta}r' \mathrm{d}r'} \\[2pt] & = \frac{\left[\frac{1}{2-\beta} r'^{2-\beta} \right]^{{R_{\textrm{90, gas}}}}_{0}}{\left[\frac{1}{2-\beta} r'^{2-\beta} \right]^{{R_{\textrm{CO\ disk}}}}_{0}}\\[2pt] &= \frac{{R_{\textrm{90, gas}}}^{2-\beta}}{{R_{\textrm{CO\ disk}}}^{2-\beta}}, \end{align}](/articles/aa/full_html/2019/09/aa34723-18/aa34723-18-eq15.png)
where we assumed 0 < β < 2.
We find that R90, gas and RCO disk are related through
 (F.7)
(F.7)
where f represents a more general case where the gas outer radius is defined using a flux fraction f.
Appendix G Beam size and peak S/N for all disc masses vs. R90,gas/R90,dust
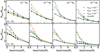 |
Fig. G.1 Beam size vs. R90, gas/R90, dust . The effect of the beam scales with its relative size compared to the size of the disc. To highlight this, the beam size is expressed interms of the characteristic size of the disc. |
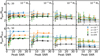 |
Fig. G.2 Peak S/N in the moment 0 map of the 12CO vs. R90, gas/R90, dust . |
Appendix H Gas radii vs. peak S/N
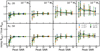 |
Fig. H.1 Peak S/N vs. noisy R90,gas normalised to the R90, gas obtained from the noiseless case. |
Appendix I Mass fractions and flux fractions for the remaining discs
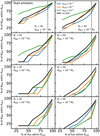 |
Fig. I.1 Fraction of continuum flux used to calculate R90, dust compared to the fraction of Mdisc within R90, gas. Dashed vertical line indicates 90% of the flux. |
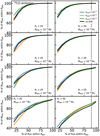 |
Fig. I.2 Fraction of 12CO flux used to calculate R90, gas compared to the fraction of Mdisc within R90, gas. Dashed vertical line indicates 90% of the flux. |
References
- Andrews, S. M., & Williams, J. P. 2005, AJ, 631, 1134 [Google Scholar]
- Andrews, S. M., & Williams, J. P. 2007, AJ, 671, 1800 [NASA ADS] [CrossRef] [Google Scholar]
- Andrews, S. M., Wilner, D., Hughes, A., Qi, C., & Dullemond, C. 2009, AJ, 700, 1502 [Google Scholar]
- Andrews, S. M., Wilner, D. J., Hughes, A., et al. 2011a, ApJ, 744, 162 [Google Scholar]
- Andrews, S. M., Wilner, D. J., Espaillat, C., et al. 2011b, ApJ, 732, 42 [NASA ADS] [CrossRef] [Google Scholar]
- Andrews, S. M., Rosenfeld, K. A., Kraus, A. L., & Wilner, D. J. 2013, ApJ, 771, 129 [NASA ADS] [CrossRef] [Google Scholar]
- Andrews, S. M., Wilner, D. J., Zhu, Z., et al. 2016, ApJ, 820, L40 [NASA ADS] [CrossRef] [Google Scholar]
- Andrews, S. M., Terrell, M., Tripathi, A., et al. 2018, ApJ, 865, 157 [NASA ADS] [CrossRef] [Google Scholar]
- Ansdell, M., Williams, J. P., van der Marel, N., et al. 2016, ApJ, 828, 46 [Google Scholar]
- Ansdell, M., Williams, J. P., Manara, C. F., et al. 2017, AJ, 153, 240 [NASA ADS] [CrossRef] [EDP Sciences] [Google Scholar]
- Ansdell, M., Williams, J. P., Trapman, L., et al. 2018, ApJ, 859, 21 [NASA ADS] [CrossRef] [Google Scholar]
- Barenfeld, S. A., Carpenter, J. M., Ricci, L., & Isella, A. 2016, ApJ, 827, 142 [NASA ADS] [CrossRef] [Google Scholar]
- Barenfeld, S. A., Carpenter, J. M., Sargent, A. I., Isella, A., & Ricci, L. 2017, ApJ, 851, 85 [NASA ADS] [CrossRef] [Google Scholar]
- Birnstiel, T., Ricci, L., Trotta, F., et al. 2010, A&A, 516, L14 [NASA ADS] [CrossRef] [EDP Sciences] [Google Scholar]
- Birnstiel, T., Klahr, H., & Ercolano, B. 2012, A&A, 539, A148 [NASA ADS] [CrossRef] [EDP Sciences] [Google Scholar]
- Birnstiel, T., Andrews, S. M., Pinilla, P., & Kama, M. 2015, ApJ, 813, L14 [NASA ADS] [CrossRef] [Google Scholar]
- Bosman, A. D., Walsh, C., & van Dishoeck, E. F. 2018, A&A, 618, A182 [NASA ADS] [CrossRef] [EDP Sciences] [Google Scholar]
- Bruderer, S. 2013, A&A, 559, A46 [NASA ADS] [CrossRef] [EDP Sciences] [Google Scholar]
- Bruderer, S., van Dishoeck, E. F., Doty, S. D., & Herczeg, G. J. 2012, A&A, 541, A91 [NASA ADS] [CrossRef] [EDP Sciences] [Google Scholar]
- Cabrera, J., Csizmadia, S., Lehmann, H., et al. 2014, ApJ, 781, 18 [NASA ADS] [CrossRef] [Google Scholar]
- Cleeves, L. I., Öberg, K. I., Wilner, D. J., et al. 2016, ApJ, 832, 110 [NASA ADS] [CrossRef] [Google Scholar]
- de Gregorio-Monsalvo, I., Ménard, F., Dent, W., et al. 2013, A&A, 557, A133 [NASA ADS] [CrossRef] [EDP Sciences] [Google Scholar]
- Dodson-Robinson, S. E., Evans, II, N. J., Ramos, A., Yu, M., & Willacy, K. 2018, ApJ, 868, L37 [NASA ADS] [CrossRef] [Google Scholar]
- Dutrey, A., Guilloteau, S., Prato, L., et al. 1998, A&A, 338, L63 [NASA ADS] [Google Scholar]
- Facchini, S., Clarke, C. J., & Bisbas, T. G. 2016, MNRAS, 457, 3593 [NASA ADS] [CrossRef] [Google Scholar]
- Facchini, S., Birnstiel, T., Bruderer, S., & van Dishoeck, E. F. 2017, A&A, 605, A16 [NASA ADS] [CrossRef] [EDP Sciences] [Google Scholar]
- Facchini, S., van Dishoeck, E. F., Manara, C. F., et al. 2019, A&A, 626, L2 [NASA ADS] [CrossRef] [EDP Sciences] [Google Scholar]
- Favre, C., Cleeves, L. I., Bergin, E. A., Qi, C., & Blake, G. A. 2013, ApJ, 776, L38 [NASA ADS] [CrossRef] [Google Scholar]
- Gillon, M., Triaud, A. H. M. J., Demory, B.-O., et al. 2017, Nature, 542, 456 [NASA ADS] [CrossRef] [PubMed] [Google Scholar]
- Guilloteau, S., & Dutrey, A. 1998, A&A, 339, 467 [NASA ADS] [Google Scholar]
- Guilloteau, S., Dutrey, A., Piétu, V., & Boehler, Y. 2011, A&A, 529, A105 [NASA ADS] [CrossRef] [EDP Sciences] [Google Scholar]
- Hartmann, L., Calvet, N., Gullbring, E., & D’Alessio, P. 1998, ApJ, 495, 385 [NASA ADS] [CrossRef] [Google Scholar]
- Hughes, A., Wilner, D., Qi, C., & Hogerheijde, M. 2008, ApJ, 678, 1119 [NASA ADS] [CrossRef] [Google Scholar]
- Hunter, J. D. 2007, Comput. Sci. Eng., 9, 90 [NASA ADS] [CrossRef] [Google Scholar]
- Kama, M., Bruderer, S., van Dishoeck, E. F., et al. 2016a, A&A, 592, A83 [NASA ADS] [CrossRef] [EDP Sciences] [Google Scholar]
- Kama, M., Bruderer, S., Carney, M., et al. 2016b, A&A, 588, A108 [NASA ADS] [CrossRef] [EDP Sciences] [Google Scholar]
- Kenyon, S. J., & Hartmann, L. 1987, ApJ, 323, 714 [NASA ADS] [CrossRef] [Google Scholar]
- Lommen, D., Wright, C. M., Maddison, S. T., et al. 2007, A&A, 462, 211 [NASA ADS] [CrossRef] [EDP Sciences] [Google Scholar]
- Long, F., Herczeg, G. J., Pascucci, I., et al. 2017, ApJ, 844, 99 [NASA ADS] [CrossRef] [Google Scholar]
- Lynden-Bell, D., & Pringle, J. E. 1974, MNRAS, 168, 603 [NASA ADS] [CrossRef] [Google Scholar]
- Marois, C., Macintosh, B., Barman, T., et al. 2008, Science, 322, 1348 [NASA ADS] [CrossRef] [PubMed] [Google Scholar]
- McClure, M. K., Bergin, E. A., Cleeves, L. I., et al. 2016, ApJ, 831, 167 [NASA ADS] [CrossRef] [Google Scholar]
- Menu, J., Van Boekel, R., Henning, T., et al. 2014, A&A, 564, A93 [NASA ADS] [CrossRef] [EDP Sciences] [Google Scholar]
- Miotello, A., Bruderer, S., & van Dishoeck, E. F. 2014, A&A, 572, A96 [NASA ADS] [CrossRef] [EDP Sciences] [Google Scholar]
- Miotello, A., van Dishoeck, E., Williams, J., et al. 2017, A&A, 599, A113 [NASA ADS] [CrossRef] [EDP Sciences] [Google Scholar]
- Miotello, A., Facchini, S., van Dishoeck, E. F., & Bruderer, S. 2018, A&A, 619, A113 [NASA ADS] [CrossRef] [EDP Sciences] [Google Scholar]
- Natta, A., Testi, L., Neri, R., Shepherd, D. S., & Wilner, D. J. 2004, A&A, 416, 179 [NASA ADS] [CrossRef] [EDP Sciences] [Google Scholar]
- Panić, O., Hogerheijde, M. R., Wilner, D., & Qi, C. 2008, A&A, 491, 219 [NASA ADS] [CrossRef] [EDP Sciences] [Google Scholar]
- Pascucci, I., Testi, L., Herczeg, G., et al. 2016, ApJ, 831, 125 [NASA ADS] [CrossRef] [Google Scholar]
- Pérez, L. M., Carpenter, J. M., Chandler, C. J., et al. 2012, ApJ, 760, L17 [NASA ADS] [CrossRef] [Google Scholar]
- Pérez, L. M., Chandler, C. J., Isella, A., et al. 2015, ApJ, 813, 41 [NASA ADS] [CrossRef] [Google Scholar]
- Piétu, V., Guilloteau, S., Di Folco, E., Dutrey, A., & Boehler, Y. 2014, A&A, 564, A95 [NASA ADS] [CrossRef] [EDP Sciences] [Google Scholar]
- Ricci, L., Testi, L., Natta, A., et al. 2010, A&A, 512, A15 [NASA ADS] [CrossRef] [EDP Sciences] [Google Scholar]
- Ruíz-Rodríguez, D., Cieza, L. A., Williams, J. P., et al. 2018, MNRAS, 478, 3674 [NASA ADS] [CrossRef] [Google Scholar]
- Schwarz, K. R., Bergin, E. A., Cleeves, L. I., et al. 2018, ApJ, 856, 85 [NASA ADS] [CrossRef] [Google Scholar]
- Tazzari, M., Testi, L., Ercolano, B., et al. 2016, A&A, 588, A53 [NASA ADS] [CrossRef] [EDP Sciences] [Google Scholar]
- Tazzari, M., Testi, L., Natta, A., et al. 2017, A&A, 606, A88 [NASA ADS] [CrossRef] [EDP Sciences] [Google Scholar]
- Testi, L., Natta, A., Shepherd, D. S., & Wilner, D. J. 2003, A&A, 403, 323 [NASA ADS] [CrossRef] [EDP Sciences] [Google Scholar]
- Trapman, L., Ansdell, M., Hogerheijde, M. R., et al. 2018, A&A, submitted [Google Scholar]
- Tripathi, A., Andrews, S. M., Birnstiel, T., & Wilner, D. J. 2017, ApJ, 845, 44 [NASA ADS] [CrossRef] [Google Scholar]
- Tripathi, A., Andrews, S. M., Birnstiel, T., et al. 2018, ApJ, 861, 64 [NASA ADS] [CrossRef] [Google Scholar]
- van Dishoeck, E. F., & Black, J. H. 1988, ApJ, 334, 771 [NASA ADS] [CrossRef] [Google Scholar]
- Ward-Duong, K., Patience, J., Bulger, J., et al. 2018, AJ, 155, 54 [NASA ADS] [CrossRef] [Google Scholar]
- Weingartner, J. C., & Draine, B. 2001, ApJ, 548, 296 [NASA ADS] [CrossRef] [Google Scholar]
- Williams, J. P., & McPartland, C. 2016, ApJ, 830, 32 [NASA ADS] [CrossRef] [Google Scholar]
- Winter, A. J., Clarke, C. J., Rosotti, G., et al. 2018, MNRAS, 478, 2700 [NASA ADS] [CrossRef] [Google Scholar]
- Zhang, K., Bergin, E. A., Blake, G. A., Cleeves, L. I., & Schwarz, K. R. 2017, Nat. Astron., 1, 0130 [NASA ADS] [CrossRef] [Google Scholar]
All Tables
All Figures
|
Fig. 1 Radial intensity profiles of the 1.3 mm continuum emission, normalised to the peak intensity, for the models with Rc = 50 AU. Crosses at an arbitrary height above the line denote the dust outer radii, defined as the radii enclosing 90% of the total flux. The resulting cumulative intensity curves are shown in Fig. E.1. |
| In the text | |
|
Fig. 2 Radial intensity profiles of the 12CO 2–1 line emission, normalised to the peak intensity, for models with Rc = 50 AU. Crosses above the line denote the dust outer radii, defined as the radii enclosing 90% of the total flux. Vertical dashed lines denote the radius at which the CO column density drops below 1015 cm −2, where it canbe photodissociated effectively. |
| In the text | |
|
Fig. 3 Comparison between gas outer radii calculated using 90% of the flux and 68% of the flux. Dashed line shows the expected relation between these two observational outer radii based on Eq. (4). |
| In the text | |
|
Fig. 4 For models with different (Mdisc, Rc), R90, dust as function of αturb. Top panel: models with Rc = 20 AU. Bottom panel: models with Rc = 50 AU. The crosses show the R90, dust for no drift model. |
| In the text | |
|
Fig. 5 For models with different (Mdisc, Rc), R90, gas as function of αturb. Top panel: models with Rc = 20 AU. Bottom panel: models with Rc = 50 AU. The crosses show the R90, gas for the no drift model. |
| In the text | |
|
Fig. 6 Disc outer radii vs. disc mass. Top panel: models with Rc = 20 AU. Bottom panel: models with Rc = 50 AU. Solid lines show dust outer radii. Dashed lines show gas outer radii. |
| In the text | |
|
Fig. 7 Disc mass vs. R90, gas/R90, dust. Top panel: models with Rc = 20 AU. Bottom panel: models with Rc = 50 AU. Dashedlines show the no drift model, without dust evolution. |
| In the text | |
|
Fig. 8 Beamsize vs. R90, gas/R90, dust. The effectof the beam scales with its relative size compared to the diameter of the disc. To highlight this, the beam size is expressed in terms of the characteristic size of the disc. Similar figures for various Mdisc and Rc are shown in Fig. G.1. |
| In the text | |
|
Fig. 9 Peak S/N in the moment 0 map of the 12CO emission vs. R90, gas/R90, dust. Similar figures for various Mdisc and Rc are shown in Fig. G.2. Peak S/N vs. R90,gas is shown in Fig. H.1. |
| In the text | |
|
Fig. 10 Discouter radii vs. CO underabundance. For comparison, the outer radii for the no drift model is shown in grey. Top panel: models with Rc = 20 AU. Bottom panel: models with Rc = 50 AU. |
| In the text | |
|
Fig. 11 CO underabundance vs. R90, gas/R90, dust. Middle panel: models with Rc = 20 AU. Bottom panel: models with Rc = 50 AU. The observed range of R90, gas/R90, dust from Ansdell et al. (2018) is shown in grey. Top panel: histogram of the gas-to-dust ratios measured in Lupus (Ansdell et al. 2016; Miotello et al. 2017). These have been converted into an effective CO underabundance using δC,O, eff = Δgd/100, where Δgd is the gas-to-dust mass ratio. |
| In the text | |
|
Fig. 12 R90, gas/R90, dust as functionof the slope of the gas surface density. Top panel: models with Mdisc = 10−5 M⊙. Bottom panel: models with Mdisc = 10−2 M⊙. |
| In the text | |
|
Fig. 13 Fraction of flux f used to calculate Rdust and R90, gas compared to the fraction of Mdisc within Rdust and R90, gas. Top panel: dust emission; bottom panel: gas emission. |
| In the text | |
|
Fig. A.1 Effect of inclination on measuring the dust outer radius. Discs with a RC = 20 AU and RC = 50 AU are shown in the top and bottom panel, respectively. |
| In the text | |
|
Fig. A.2 Effect of inclination on measuring the gas outer radius. Discs with a RC = 20 AU and RC = 50 AU are shown in the top and bottom panel, respectively. |
| In the text | |
|
Fig. B.1 Comparison of gas outer radii measured from 13CO 2–1 emission(solid lines) and 12CO 2–1 emission (dashed lines). |
| In the text | |
|
Fig. B.2 Ratio of gas outer radii measured from 12CO 2–1 emission(R90, gas(12CO)) over 13CO 2–1 emission(R90, gas(13CO)). The mean ratio of all models is shown in grey. |
| In the text | |
|
Fig. C.1 Comparison between outer radii derived from 12CO moment 0 map (left) and the peak intensity (moment 8) map (right). The model shown has Mdisc = 10−3 M⊙, Rc = 50 AU, and αturb = 10−4. |
| In the text | |
|
Fig. C.2 Gas radii measured from the peak intensity map vs. disc mass. Top, middle, and bottom figures: discs with inclinations of 0°, 30°, and 60°, respectively |
| In the text | |
|
Fig. D.1 Radial profiles of 1300 μm normalised to the total flux. Crosses above the line denote the radii enclosing 90% of the flux (heights of the crosses are arbitrary). |
| In the text | |
|
Fig. D.2 1300 μm curve of growth of the profiles seen in Fig. D.1. Dashed vertical line denotes the radii enclosing 90% of the flux. |
| In the text | |
|
Fig. E.1 1300 μm curve of growth of the profiles seen in Fig. 1. Dashed vertical line denote the radii enclosing 90% of the flux. |
| In the text | |
|
Fig. G.1 Beam size vs. R90, gas/R90, dust . The effect of the beam scales with its relative size compared to the size of the disc. To highlight this, the beam size is expressed interms of the characteristic size of the disc. |
| In the text | |
|
Fig. G.2 Peak S/N in the moment 0 map of the 12CO vs. R90, gas/R90, dust . |
| In the text | |
|
Fig. H.1 Peak S/N vs. noisy R90,gas normalised to the R90, gas obtained from the noiseless case. |
| In the text | |
|
Fig. I.1 Fraction of continuum flux used to calculate R90, dust compared to the fraction of Mdisc within R90, gas. Dashed vertical line indicates 90% of the flux. |
| In the text | |
|
Fig. I.2 Fraction of 12CO flux used to calculate R90, gas compared to the fraction of Mdisc within R90, gas. Dashed vertical line indicates 90% of the flux. |
| In the text | |
Current usage metrics show cumulative count of Article Views (full-text article views including HTML views, PDF and ePub downloads, according to the available data) and Abstracts Views on Vision4Press platform.
Data correspond to usage on the plateform after 2015. The current usage metrics is available 48-96 hours after online publication and is updated daily on week days.
Initial download of the metrics may take a while.