Free Access
Fig. C.2
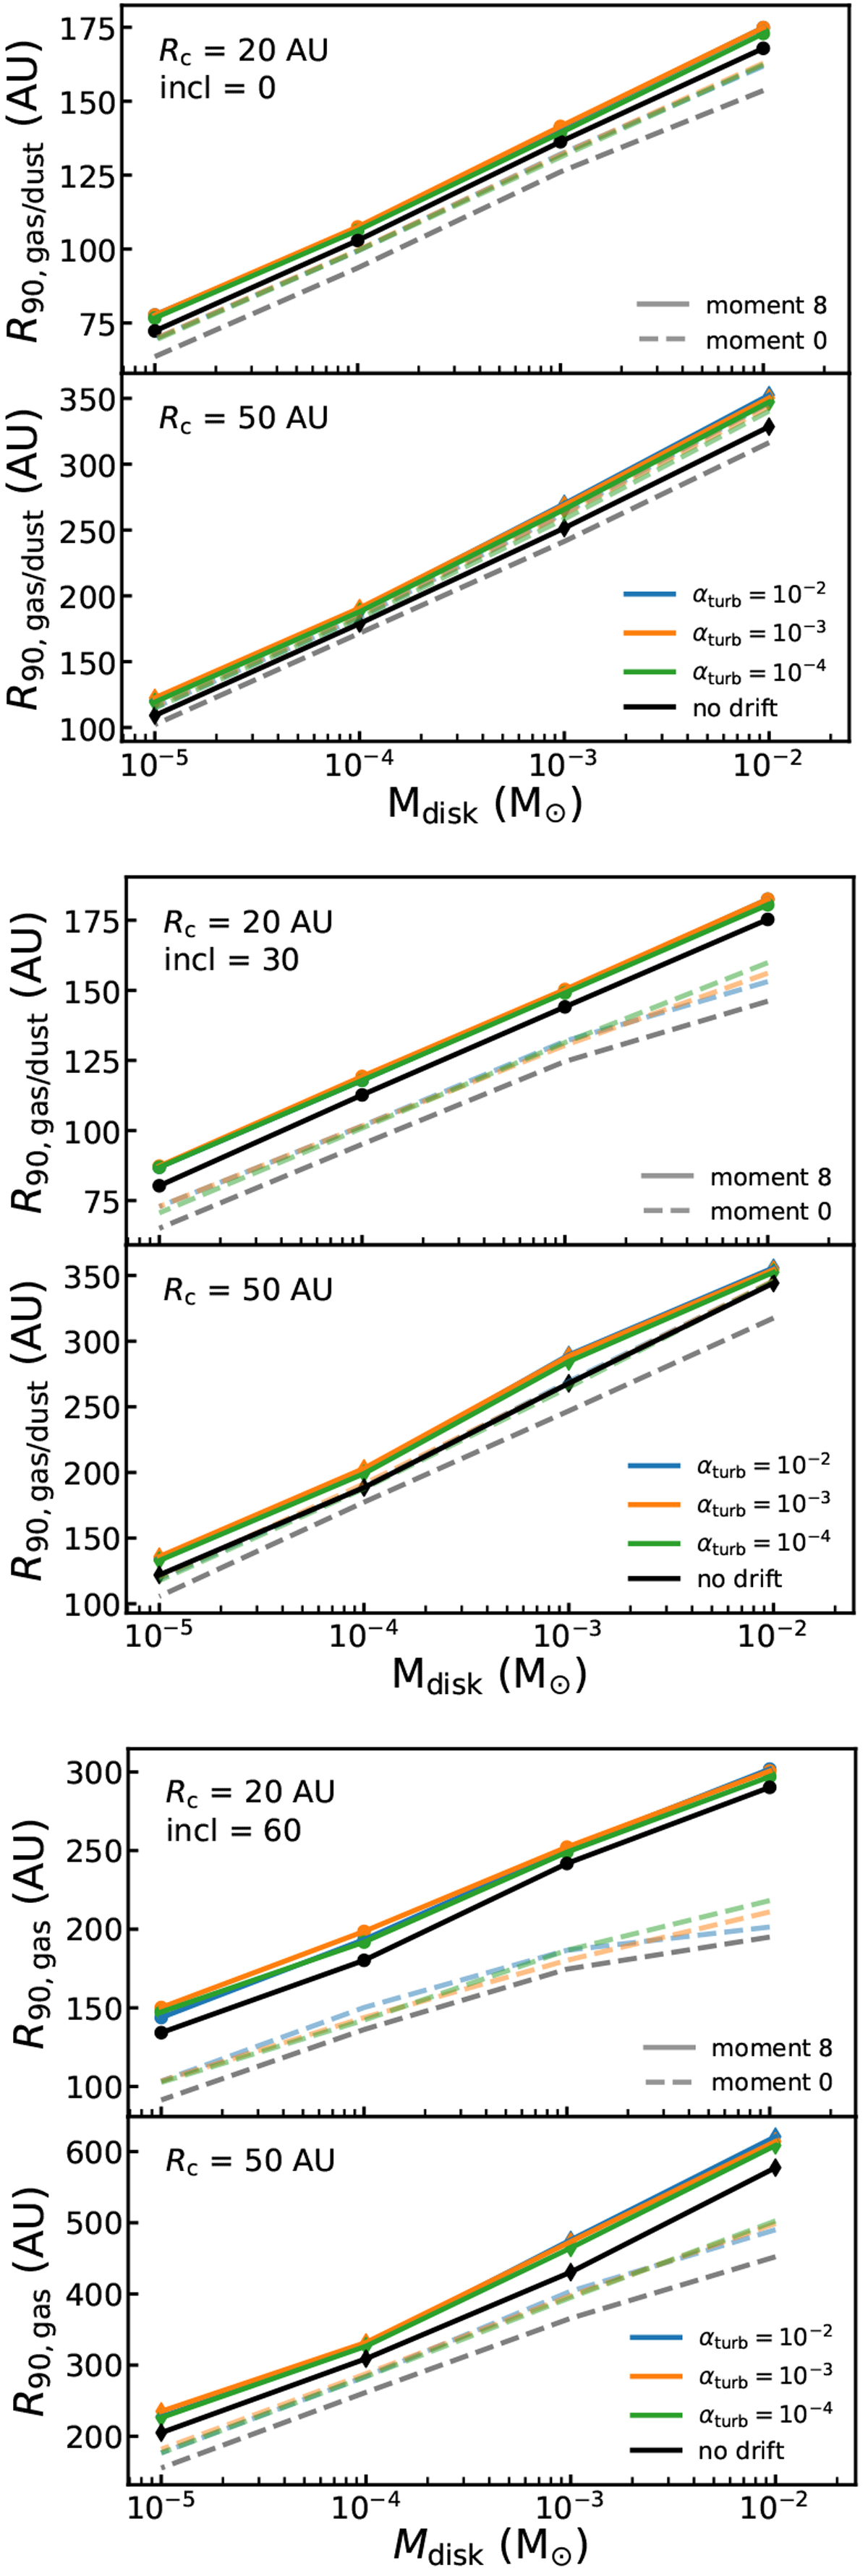
Gas radii measured from the peak intensity map vs. disc mass. Top, middle, and bottom figures: discs with inclinations of 0°, 30°, and 60°, respectively
Current usage metrics show cumulative count of Article Views (full-text article views including HTML views, PDF and ePub downloads, according to the available data) and Abstracts Views on Vision4Press platform.
Data correspond to usage on the plateform after 2015. The current usage metrics is available 48-96 hours after online publication and is updated daily on week days.
Initial download of the metrics may take a while.