Fig. 11
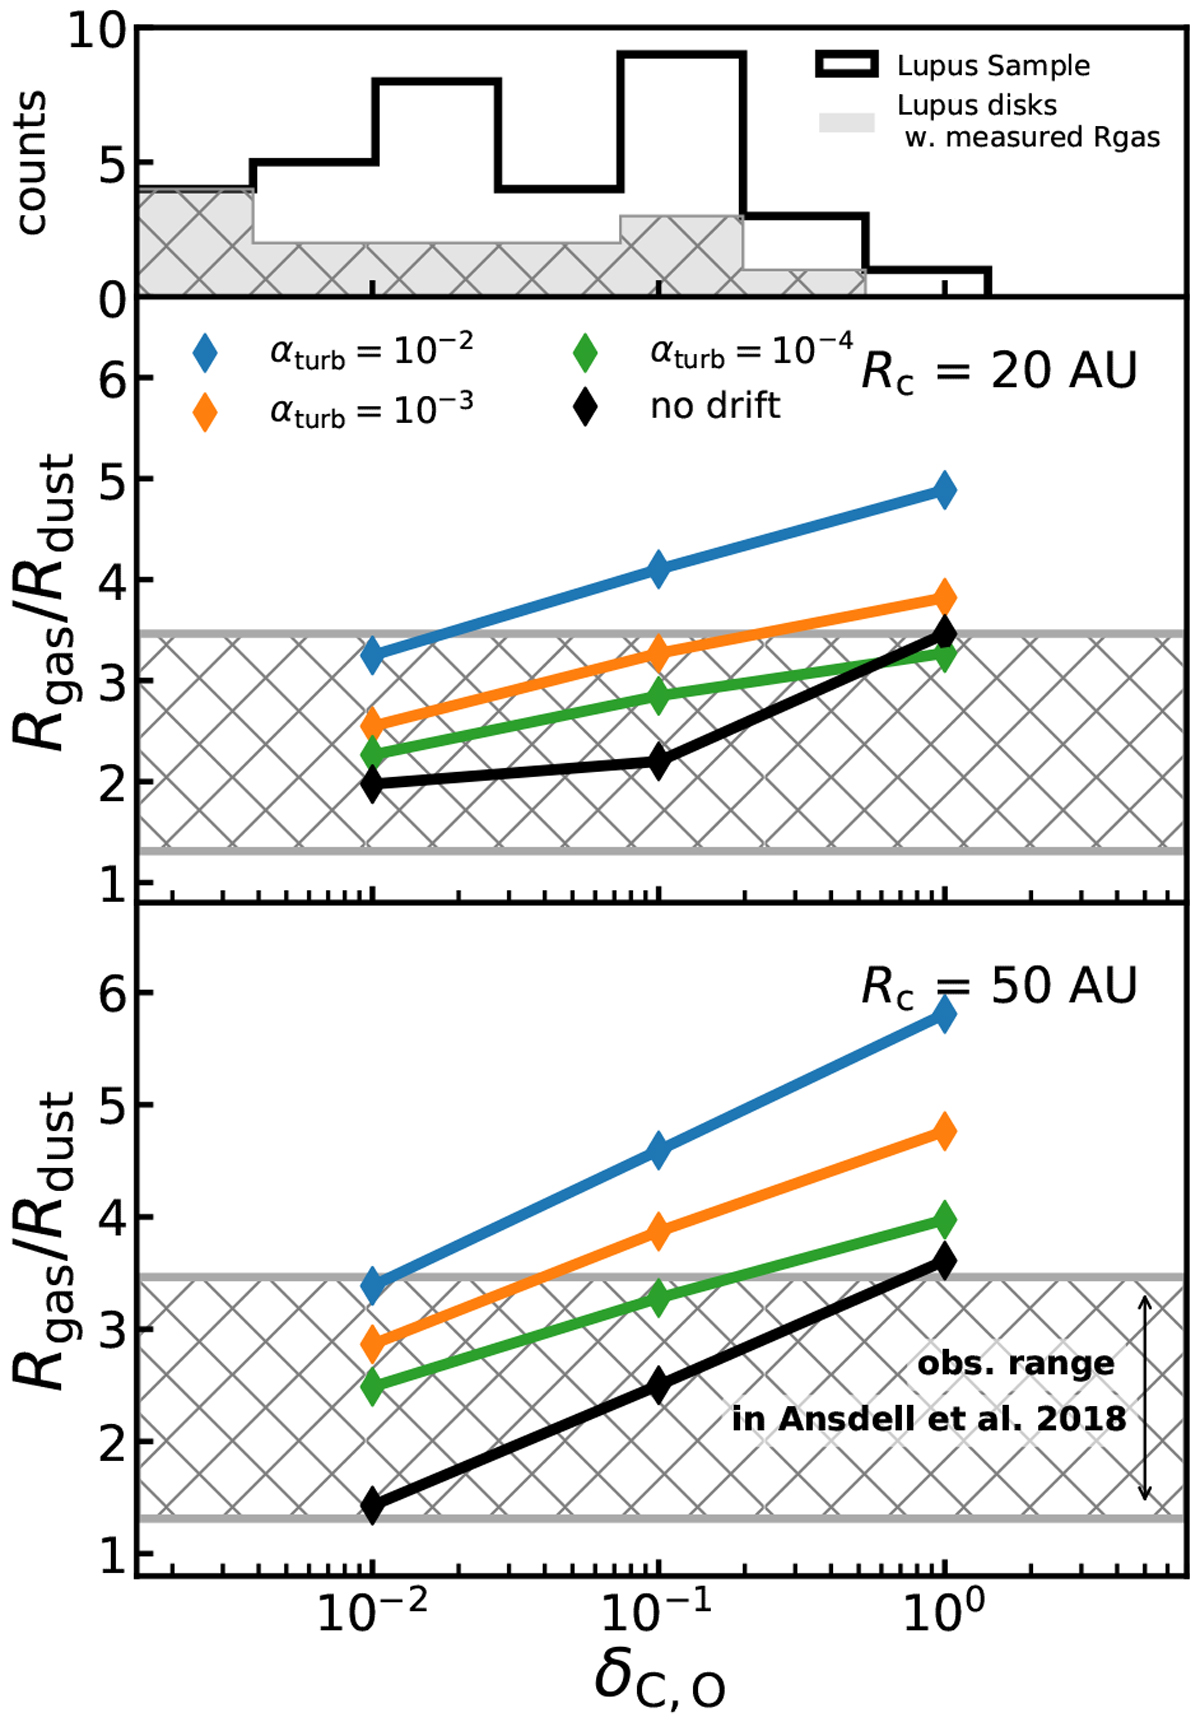
CO underabundance vs. R90, gas/R90, dust. Middle panel: models with Rc = 20 AU. Bottom panel: models with Rc = 50 AU. The observed range of R90, gas/R90, dust from Ansdell et al. (2018) is shown in grey. Top panel: histogram of the gas-to-dust ratios measured in Lupus (Ansdell et al. 2016; Miotello et al. 2017). These have been converted into an effective CO underabundance using δC,O, eff = Δgd/100, where Δgd is the gas-to-dust mass ratio.
Current usage metrics show cumulative count of Article Views (full-text article views including HTML views, PDF and ePub downloads, according to the available data) and Abstracts Views on Vision4Press platform.
Data correspond to usage on the plateform after 2015. The current usage metrics is available 48-96 hours after online publication and is updated daily on week days.
Initial download of the metrics may take a while.