| Issue |
A&A
Volume 682, February 2024
|
|
|---|---|---|
| Article Number | A55 | |
| Number of page(s) | 18 | |
| Section | Planets and planetary systems | |
| DOI | https://doi.org/10.1051/0004-6361/202347135 | |
| Published online | 02 February 2024 | |
High-resolution ALMA observations of compact discs in the wide-binary system Sz 65 and Sz 66★
1
Joint ALMA Observatory,
Alonso de Córdova 3107, Vitacura,
Santiago,
Chile
e-mail: jmiley73@gmail.com
2
National Astronomical Observatory of Japan, NAOJ Chile Observatory,
Los Abedules 3085, Oficina 701, Vitacura,
Santiago,
Chile
3
School of Physics & Astronomy, University of Leeds,
Sir William Henry Bragg Building, Woodhouse Lane,
Leeds
LS2 9JT,
UK
4
Department of Astronomy and Astrophysics, Penn State University, 525 Davey Laboratory,
University Park,
PA
16802,
USA
5
Astronomy Unit, School of Physics and Astronomy, Queen Mary University of London,
London
E1 4NS,
UK
6
National Radio Astronomy Observatory,
520 Edgemont Road,
Charlottesville,
VA 22903,
USA
7
Center for Astrophysics | Harvard &Smithsonian,
Cambridge,
MA
02138,
USA
8
Université Côte d’Azur, Observatoire de la Côte d’Azur, CNRS, Laboratoire Lagrange,
06304
Nice,
France
9
Université Grenoble Alpes, CNRS, IPAG,
38000
Grenoble,
France
10
Department of Astronomy, Columbia University,
538 W. 120th Street, Pupin Hall,
New York,
NY
10027,
USA
11
Departamento de Astronomía, Universidad de Chile,
Camino El Observatorio 1515, Las Condes,
Santiago,
Chile
12
Instituto de Astrofísica, Pontificia Universidad Católica de Chile,
Av. Vicuña Mackenna 4860,
7820436
Macul,
Santiago,
Chile
13
Department of Physics and Astronomy, California State University Northridge,
18111 Nordhoff Street,
Northridge,
CA
91330,
USA
14
Department of Physics and Astronomy,
6100 Main MS-550, Rice University,
Houston,
TX
77005,
USA
Received:
8
June
2023
Accepted:
9
November
2023
Context. Substructures in disc density are ubiquitous in the bright extended discs that are observed with high resolution. These substructures are intimately linked to the physical mechanisms driving planet formation and disc evolution. Surveys of star-forming regions find that most discs are in fact compact, less luminous, and do not exhibit these same substructures. It remains unclear whether compact discs also have similar substructures or if they are featureless. This suggests that different planet formation and disc evolution mechanisms operate in these discs.
Aims. We investigated evidence of substructure within two compact discs around the stars Sz 65 and Sz 66 using high angular resolution observations with ALMA at 1.3 mm. The two stars form a wide-binary system with 6″.36 separation. The continuum observations achieve a synthesised beam size of 0″.026 × 0″.018, equivalent to about 4.0 × 2.8 au, enabling a search for substructure on these spatial scales and a characterisation of the gas and dust disc sizes with high precision.
Methods. We analysed the data in the image plane through an analysis of reconstructed images, as well as in the uv plane by non-parametrically modelling the visibilities and by an analysis of the 12CO (2–1) emission line. Comparisons were made with highresolution observations of compact discs and radially extended discs.
Results. We find evidence of substructure in the dust distribution of Sz 65, namely a shallow gap centred at ≈20 au, with an emission ring exterior to it at the outer edge of the disc. Ninety percent of the measured continuum flux is found within 27 au, and the distance for 12CO is 161 au. The observations show that Sz 66 is very compact: 90% of the flux is contained within 16 au, and 90% of the molecular gas flux lies within 64 au.
Conclusions. While the overall prevalence and diversity of substructure in compact discs relative to larger discs is yet to be determined, we find evidence that substructures can exist in compact discs.
Key words: planet-disk interactions / stars: pre-main sequence / protoplanetary disks
Reduced images is available at the CDS via anonymous ftp to cdsarc.cds.unistra.fr (130.79.128.5) or via https://cdsarc.cds.unistra.fr/viz-bin/cat/J/A+A/682/A55
© The Authors 2024
 Open Access article, published by EDP Sciences, under the terms of the Creative Commons Attribution License (https://creativecommons.org/licenses/by/4.0), which permits unrestricted use, distribution, and reproduction in any medium, provided the original work is properly cited.
This article is published in open access under the Subscribe to Open model. Subscribe to A&A to support open access publication.
1 Introduction
Interferometric imaging of protoplanetary discs at millimetre wavelengths has uncovered a wide and varied range of substructures within the gas, and in particular, within the dust density distribution of protoplanetary discs. The most commonly observed substructures are rings and gaps in discs (Andrews et al. 2018a), as seen in the now famous images of HL Tau (ALMA Partnership 2015), but there are also many instances of azimuthally asymmetric structures, such as spiral arms (e.g. Elias 2-27 Pérez et al. 2016) or asymmetric dust clumps (e.g. Oph IRS 48,V1247 Orionis van der Marel et al. 2013; Kraus et al. 2017). These substructures are often interpreted to signal the presence of embedded protoplanets or of the mechanisms that lead to planet formation. For example, an embedded planet can carve one or more gaps in a disc, the width and depth of which will depend on the mass of the planet and the properties of the system (Paardekooper & Mellema 2006; Rosotti et al. 2016; Dong & Fung 2017; Dong et al. 2017; Nazari et al. 2019). Although the influence of protoplanets is the most commonly favoured mechanism, other methods have been proposed, including density enhancements at snow lines (Banzatti et al. 2015; Zhang et al. 2015), at the edge of dead zones (Flock et al. 2015; Lyra et al. 2015), or towards concentrations of magnetic flux related to zonal flows in magnetorotation instability turbulence (Bai & Stone 2014). Spirals can be produced by embedded planets or by gravitational instability within the disc (Dong et al. 2018b). Clumps or azimuthally extended asymmetries in the dust distribution can form due to dust traps around local pressure maxima, which may have been created by vortices (Ataiee et al. 2013; Zhu & Baruteau 2016; Baruteau & Zhu 2016). Efficient dust trapping can aid the growth of solid particles by restricting the inward radial drift (Pinilla et al. 2012b).
The groundbreaking ALMA large program DSHARP resulted in images of 20 protoplanetary discs at high resolution (~0.035″, or ~5 au), unveiling a staggering array of finely resolved substructure features, including gaps, rings, spirals, and asymmetric clumps (Andrews et al. 2018b; Huang et al. 2018). The DSHARP images and other high-resolution observations of protoplanetary discs (see e.g. Dong et al. 2018a; Pérez et al. 2020) suggest that substructure is certainly very common in class II discs, and that with sufficiently high angular resolution, we should perhaps expect substructure to be ubiquitous.
The DSHARP survey is biased towards brighter discs due to the sample selection methods (Andrews et al. 2018a), however, and ALMA surveys of gas and dust in star-forming regions have shown that these bright and extended objects are not representative of the entire disc population (Cieza et al. 2021). The fainter discs are found to be more radially compact (Tripathi et al. 2017; Andrews et al. 2018b) and are less likely to show resolved substructure (e.g. Long et al. 2019). These so-called compact discs are a significant fraction of the discs that are currently observed, potentially as many as 60% in the Lupus sample, for example (Miotello et al. 2021).
Throughout the literature on protoplanetary discs, the term compact disc has come to be used rather loosely to refer to this population of fainter, radially compact discs. This is a very subjective definition because it strongly relies on the angular resolution of the observation. In general, these discs are unresolved, or marginally resolved, by unbiased surveys of star-forming regions of all ages. For an indication of typical size, we can consider the Lupus survey mentioned previously (with an angular resolution equivalent to 30-40 au) (Ansdell et al. 2016), in older discs in Upper Sco (median resolution ≈52 au) (Barenfeld et al. 2016), and in younger regions such as Ophiuchus, where observations with a resolution equivalent to 28 au detected 133 discs, 60 of which are resolved, and only 8 of which show substructure (Cieza et al. 2019). A growing number of studies focus on these compact discs and their link to detectable disc substructures. From a sample of 32 discs in Taurus with a resolution of ~ 16 au, Long et al. (2019) identified 12 discs with clear structure and 20 smooth discs, 8 of which are associated with wide binaries.
Smooth and structured discs show a similar spread in mass as the stellar host, system age, and disc luminosity. However, a trend has emerged with the radial extent of the disc. In Taurus, the smooth discs have R ≤ 55 au, but the structured discs span a range from 40 to 200 au (Long et al. 2019). In a study of very low mass stars that host faint and radially compact discs (90% of the disc flux is contained within 13–46 au), Kurtovic et al. (2021) reported substructure in three of the six discs in Taurus that they studied with a resolution of 0″.1, including a wide cavity in the disc of CIDA 1 (Pinilla et al. 2021), and hints of unresolved structure in one of the remaining three sources.
On the other hand, high-resolution observations of small dust discs that lack substructure have called into question whether substructure truly is ubiquitous. For example, based on highresolution (0″.055) observations of CX Tau, Facchini et al. (2019) reported that the dust disc was relatively unstructured, and that the inner region resembled the inner regions of the DSHARP discs. CX Tau does not possess the large outer rings that are so common in the DSHARP sample, however, and its ratio of gas disc size to dust disc size is high, which could be evidence of an efficient radial drift (Trapman et al. 2019). Additionally, Ribas et al. (2023) reported no visible gaps in the dust distribution of the MP Mus protoplanetary disc using a resolution of 4 au.
High-resolution observations are important to identify substructure. Observations with the finest angular resolution will reveal the shortest structures and allow us to place upper limits on the potential size of undetected structure. For an idea of the scales involved, we can consider that some dust disc substructures have a theoretical maximum size. In order to remain stable, the perturbations in the gas disc must reach at least the gas pressure scale height, H (Dullemond et al. 2018). In protoplanetary discs, H/R typically is 5–10%. The result is that the dust-trapping rings induced by these gas perturbations occur on spatial scales that increase with R. For inner disc regions, these sizes are comparable to or smaller than the synthesising beam. The gas perturbation itself must be ≈R, but the dust structures that form as a result of these gas perturbations can form even narrower structures (Xu & Bai 2022). This therefore indicates a maximum size of the substructure, and this size depends on its radial location, which we expect to be resolved angularly for a given observational setup. Bae et al. (2023) discussed this in terms of effective angular resolution, a ratio of θdisc to the angular size of the disc, and θres is the size of the synthesising beam. They pointed out that the substructure detection rate is 2% in discs with θdisc/θres ≤ 3 and 50% in discs of 3 < θdisc/θres < 10, but that substructures are found in 95% of discs with θdisc/θres > 10. For this reason, we must be mindful to ensure that the conclusions we draw on substructure in discs also consider the wider population that has not yet been observed, or has not yet been observed with sufficiently high angular resolution.
An analysis of the interferometric visibilities, rather than the image plane, can aid these investigations. Jennings et al. (2022a) hypothesised that the previously considered smooth inner discs of the DSHARP sample may in fact possess more structure than a typical clean image reconstruction can detect. Furthermore, a similar analysis of the Long et al. (2019) sample in Taurus revealed new structure within the inner discs (Jennings et al. 2022b). Yamaguchi et al. (2021) used a sparse modelling imaging technique to improve the resolution of the imaging of the T Tau system. In doing so, the authors uncovered a new gap structure in T Tau N and resolved the T Tau Sa/Sb binary.
Understanding the nature of compact discs goes beyond a simple morphological classification of discs because the substructures we identify in protoplanetary discs frequently originate from planet formation in the disc or from disc evolution processes. Annular rings and gaps are maintained by dust traps that allow the build up of pebbles at local pressure maxima (Whipple 1972; Pinilla et al. 2012a). In addition to forming annular structures, they prevent rapid radial drift that depletes the outer disc of solid material (Pinilla et al. 2012a). Discs could be drift dominated, in which case solids would be transported inward relatively quickly, or alternatively, they could possess pressure bumps leading to dust traps that prevent the inward drift of solids. In this way, pressure bumps may dictate the global evolution of the dust disc by influencing the inward radial drift of solid matter (e.g. Pinilla et al. 2012a; Booth et al. 2017), and the inward transport in this manner plays a large role in enriching the inner regions with ices containing frozen-out volatiles, which affects the planet formation in these regions (Schoonenberg & Ormel 2017; Stammler et al. 2017; Booth & Ilee 2019; Banzatti et al. 2020). Establishing to which extent these same processes act in the compact discs through the observable substructures that they manifest enables us to understand in which ways the radially extended and highly structured discs can reflect the wider population.
Using long-baseline ALMA observations of two class II discs, we test the claim that substructure is ubiquituous in compact discs on spatial scales of ~4 au. The analysis is carried out both in the image plane and in the uv plane of the observed continuum visibilities. We analyse dust continuum emission and molecular gas emission in the context of previous observations towards compact discs and radially extended discs.
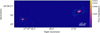 |
Fig. 1 ALMA continuum emission around Sz 65 (right) and Sz 66 (left) (colour map) both shown in the same field. The colour stretch is on a log scale. The contour denotes the gas disc within 5σCO. |
2 Sz 65 and Sz 66
Our targets were two late-type stars, Sz 65 (spectral type K7) and Sz 66 (spectral type M2), that appear to constitute a wide-binary system because they lie close to each other on the sky. Based on an analysis of X-shooter spectroscopy, stellar masses of 0.76±0.18 M⊙ were calculated for Sz 65 and 0.31 ± 0.04 M⊙ for Sz 66 (Alcalá et al. 2014, 2017). Their Gaia distances are very similar, 153.0 ± 0.6 pc for Sz 65 and 154.4±0.6 pc for Sz 66 (Bailer-Jones et al. 2021), and they are separated by just 6″.36 on the sky, with Sz 66 97.5° East of North from Sz 65 (see also Fig. 1). Binary interaction is known to truncate the discs around the stars that are involved, leading to shortened radial extents (Harris et al. 2012; Akeson & Jensen 2014; Akeson et al. 2019), but the past relation of Sz 65 and Sz 66 remains unclear.
The discs were previously observed as part of the Lupus survey with ALMA at 890 µm (angular resolution ~0″.30), where continuum fluxes of 64.49 ± 0.32 and 14.78 ± 0.29 mJy were measured (Ansdell et al. 2016), and at 1.33 mm (angular resolution ~(0″.25), for which the observed integrated continuum flux was 29.94±0.02 and 6.42±0.18 mJy for Sz 65 and Sz 66, respectively (Ansdell et al. 2016). Ansdell et al. (2018) measured the dust radius of the well-resolved discs from the Lupus sample, in which Sz 65 is included, but Sz 66 is not. The size of the dust disc in Sz65 was found to be 64±2 au and the gas radius is 172±24 au. Sz 65 was modelled in the uv plane by Hendler et al. (2020).
They reported a smaller dust disc size of 29 au. This size places it within the bottom 38% of their sample of 199 discs from different nearby star-forming regions, whilst only 7% of the sample are more compact than Sz 66. Alcalá et al. (2017) found Sz 65 to be one of the weakest accretors in the sample of 81 Lupus young stellar objects.
3 Observations
Our new observations of compact discs around Sz 65 and Sz 66 were taken as part of project 2018.1.00271.S, in ALMA Cycle 6 on 6 July 2019, using 45 antennas across baselines ranging from 149 to 16 196 m, with a mean PWV of 1.2 mm and mean phase fluctuations on the longest baselines of about 150 microns. The observations used three spectral windows optimised for continuum detections with 128 channels across a total window bandwidth of 2 GHz, centred on 232.902, 246.777, and 248.652 GHz, and one spectral window centred on 231.006 GHz, with 3840 channels across a bandwidth of 1.875 GHz, intended for the rotational transition of CO (2–1). The total integration time on source was 88.47 minutes. J1427-4206 was used as the flux and bandpass calibrator (S v = 1 Jy beam−1), J1534-3526 was used as the phase calibrator (1.14° from the target source), and J1532-3732 was the check source. All calibrators were also used for WVR corrections.
These new observations were supported by multiple archival ALMA datasets, the details of which we provide in Table 1. We concatenate these archival data to our new observations in order to ensure a more complete coverage of the uv plane. This was necessary in particular to fill in the shorter-baseline spacings lacking from the extended configuration of the new observations. These missing baselines that we replaced with archival data trace the more extended emission structures.
4 Calibration and data reduction
The initial data calibration was executed with the ALMA pipeline in CASA version 5.6.1-8. Further data analysis and image reconstruction used releases of CASA version 6. Continuum images were reconstructed from measurement sets with data averaged over all line-free spectral channels in each spectral window. Images were reconstructed using the clean algorithm with Hogbom PSF calculation (Högbom 1974) and Briggs weighting (Briggs 1995). Both sources were imaged from the same field of view. A range of robust values were used during the imaging to investigate the influence on the morphology of the disc; the images presented here use robust =0.0. Primary beam correction was applied to all images. Self-calibration was performed individually on the new Cycle 6 and archival data sets before concatenating the data from each of the observations into a single dataset. For observations with the most extended configurations (projects 2018.1.00271 and 2018.1.01458), the signal-to-noise ratio is low on the longest baselines, and as a result, adequate solutions during phase self-calibration are not found without flagging the longest baselines, which provide the crucial information about the shortest angular scales on the sky. In these cases, the solutions found during phase calibration were applied, but the flags were not (using the option applymode=‘calonly’ with the CASA task applycal). For the data from more compact configurations, self-calibration is more straightforward. Continuum data from project 2019.1.01135 were included after phase self-calibration (stopping at solint=30s) and amplitude self-calibration. Observations from project 2017.1.00569 were included after phase self-calibration (stopping at solint=120s), but amplitude self-calibration did not offer improvements in image quality. Before we combined the individual observations, each data set was aligned to a consistent centre. This was achieved by redefining the phase centre of the measurement set to match that of the centre of a Gaussian fitted to the continuum image from that dataset. In each case, the shifts were smaller than the shift of the full width at half maximum of the synthesising image beam. The coordinate grid was then redefined to a common direction of J2000 15h39m27.750s–34d46m17.692s, adopted from the peak of the dataset with the highest resolution. The final image was reconstructed from the concatenated measurement set consisting of these four individual observations. The first execution block of project 2017.1.00569 was not included as part of the final concatenated data set because anomalous extended emission was identified in the plots of amplitude against uv-distance. Seen in images, these observations were flagged during the quality assurance stages as having high phase and some antenna issues during observations. The remaining executions were sufficient to fill the uv sampling of our resulting concatenated data set without this additional execution.
The concatenated continuum image had a synthesised beam of 07026 × 0″.018, −75.5° using Briggs weighting and robust = 0.0. This corresponds to a spatial resolution of 3.7 × 2.5 au as calculated from Gaia early data release 3 parallaxes. The rms measured in the continuum image was 13 µJy beam−1.
12 CO(2−1) emission was not robustly detected by our new observations at the native angular and spectral resolution. Averaging of the spectral windows from 122 kHz channels to 768 kHz (1 km s−1) channels was required in order to extract significant emission from the 12CO (2−1) line. The data were combined with data from the archival ALMA Band 6 project 2015.1.00222 as presented in Ansdell et al. (2018). Keplerian masking was applied during cleaning. A uv taper of 0707 was applied to the data to produce the images presented here, resulting in a synthesised beam of size of 0″.101 × σ/079, −41.1°. The rms noise measured from channels in the 12CO (2−1) data cube is 1.9 mJybeam−1 kms−1. Figures A1 and A2 show the effect that the taper has on the emission in the channels. We analysed the image cube and moment maps that resulted from the taper-applied imaging.
Details of the ALMA observations.
5 Results
A wide field view of the binary pair is shown in Fig. 1. Images with a narrower field of view showing the finer details of the continuum discs are presented in Fig. 2, and the gas emission is shown in Fig. 3.
5.1 Continuum emission
Figure 2 shows that the emission in the disc of Sz 65 is centrally peaked. Radially exterior to the bright central emission core lies a plateau of fainter emission. A small decrease in surface brightness in this plateau at ~20 au is noticeable in Fig. 2 in between the 10 and 20σ contours. We analyse this in greater detail in Sect. 5.3. The emission does not show any clear azimuthal asymmetries or spiral-like structures. Azimuthally averaging the surface brightness from the disc of Sz 65 gives a 1D intensity profile. This profile reaches the 3σ level at 0725 (38 au). When we integrate over this profile out to the point at which the emission drops to the rms of the image, 90% of the flux from the disc (R90) is contained within 0″.17 (27 au).
The integrated flux density measured within a 3σ contour is 28.0 mJy. The peak in emission is 1.34 mJybeam−1, which for the image rms of 13 µJy beam−1 gives a signal-to-noise ratio of 95 for this observation. A Gaussian fit to the emission in the image plane gives a position angle on the sky of 110 ± 0.5°, a major axis FWHM of 229 ± 3 milliarcsecond and a minor axis FWHM 103 ± 1 milliarcsecond, corresponding to an inclination on the sky of 63 ± 1°. Our results are very similar to those found by modelling of the visibilities by Andrews et al. (2018b) using Band 7 observations of Sz 65. Andrews et al. (2018b) reported an inclination of 63 ± 1 °, which exactly matches the value we found. They also found a position angle of 107 ± 1°, which is different by 3° from what is derived here.
For Sz 65, the flux measured in Band 7 (890µm) by Ansdell et al. (2016) was 64.5 mJy, which gives a spectral index α = 2.3 ± 0.3, is consistent with the mean spectral index measured in protoplanetary discs (Andrews 2020). The uncertainty on the spectral index considers the 10% flux calibration accuracy achieved for ALMA Bands 6 and 7.
The dust mass can be estimated from the measured continuum flux by assuming optically thin thermal emission and using Eq.(1),
 (1)
(1)
where d is the Gaia distance to Sz 65 of 153 pc, Bv is the Planck function using frequency of the observation 230.255 GHz and a midplane temperature of 20 K. κv is the opacity of the dust grains, and this is the main source of uncertainty when the dust mass of protoplanetary discs is calculated because it depends upon the grain size, the grain size distribution, and the composition of the dust. We adopted the commonly used prescription κv = 0.1 (y/1012 Hz)β cm2 g−1 following Beckwith et al. (1990), where β is the opacity power index, which we assumed to be 1.0.
With these inputs, we calculate a dust mass estimate of 16.1 M⊕, which is consistent with the range reported in surveys of Lupus by Ansdell et al. (2016, 2018), where dust disc masses of 15 M⊕ and 20 M⊕ were derived from Band 7 observations and Band 6 observations, respectively.
We also measured the properties of the continuum emission in Sz 66 from the same image. The integrated flux density is 14.4 mJy, with a peak value of 0.55 mJy beam−1, giving a peak signal-to-noise ratio of 39. A Gaussian fit to the image plane returns a best fit with a position angle 80.0° and a shape of 116 mas × 43.8 mas FWHM, corresponding to an inclination of 67.8°. These are similar to results for Band 7 observations of Sz 66 with a coarser angular resolution that were analysed by (Andrews et al. 2018b), who found an inclination  , and a position angle
  . With Eq. (1), this gives a dust mass estimate for Sz 66 of 8.0 M⊕. Ansdell et al. (2016) measured a flux at 890 µm of 14.78 mJy, which led us to calculate α = 2.2 ± 0.3. This closely agrees with the value found for Sz 65. R90 for the Sz 66 dust continuum is found at 0″.11 (~16 au). This very compact disc does not show evidence of substructure on scales of 4 au.
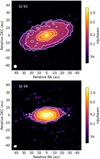 |
Fig. 2 ALMA continuum images of Sz 65 and Sz 66. Contours are shown at (5,10,20,30,40) ×σcont. The synthesised beam is shown in the lower left corner by the white ellipse. |
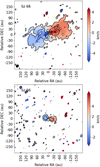 |
Fig. 3 Moment 1 map of 12CO in Sz 65 (top) and Sz 66 (bottom). Contours show the surface brightness in the moment 0 map at (3, 15, 30) × σCO, where σCO =1.3 mJybeam−1 km s−1. Both maps were created using emission in the cube above a threshold of 3σ. The Sz 66 field is visibly noisier because it is found towards the edge of the primary beam in the observations that were centred on Sz 65. |
5.2 12CO (2–1) emission
The rms noise achieved in the line-free channels of the data cube was measured at 1.81 mJy beam−1 km s−1 in the channels of 1 km s−1 width. In Fig. 3, we show the contours of the integrated-intensity moment 0 map of both Sz 65 and Sz 66 overlaid on the moment 1 map. Moment maps are created by combining channels containing line emission above 3σ. In the moment 0 map, the integrated flux measured from pixels above 3σ around Sz 65 is 629 mJybeam−1 km s−1, with a peak brightness of 61 mJybeam−1 km s−1. The rms measured from emission-free regions of the moment 0 map created without any noise threshold is 10 mJy beam−1 km s−1. Around Sz 66, an integrated flux of 382 mJy beam−1 km s−1 is measured and the peak lies at 74.3 mJybeam−1 km s−1.
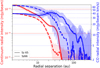 |
Fig. 4 Azimuthally averaged deprojected radial intensity profiles of the dust continuum (red) and CO emission (blue) for Sz 65 (solid line) and Sz 66 (dashed line). The standard deviation in each of the radial bins used for averaging is shown as the shaded area. The beam size for the continuum data corresponds to ~4 au, and the CO data have ~15 au. |
5.3 Structure of the discs around Sz 65 and Sz 66
The new observations employ longer baselines than previous observations of these discs with ALMA (Table 1). This provides new levels of detail in the imaging of Sz 65 and Sz 66 than were previously achieved at these wavelengths. We analysed the measured brightness distribution of dust and gas for evidence of substructure in the compact discs.
5.3.1 Measurements from the image plane
In Fig. 2, we resolve the disc of Sz 65 well enough to examine the radial structure. The FWHM of a Gaussian fitted to the continuum image is ~9.5 times the FWHM of the synthesised beam. In the case of Sz 66, about five beams fit across the major axis. The image of Sz 65 shows a bright central core in the centre of an extended disc of weaker emission. This is seen more clearly when the emission is deprojected using the inclination and position angle of the disc that we defined from a Gaussian fitted to the continuum emission. We then azimuthally averaged the emission to produce radial flux profiles, which are shown in Fig. 4. The properties of the two discs extracted in this section are summarised in Table 2.
In Fig. 4, we compare the extent of the dust disc to that of the molecular gas disc using CO(2−1) as a tracer. In order to compare the extension quantitatively, we also defined the disc size, R90, as the radius within which 90% of the cumulative flux measured from the image plane is contained. The uncertainties correspond to the width of the bins of the deprojected radial distance, which is related to the pixel size of the reconstructed images. R90 for the continuum is 27 ± 4 au, and for the CO gas, it is 142 ± 15 au around Sz 65. We find 16 ± 4 au and 47 ± 15 au in Sz 66. The uncertainties in disc sizes are given as the deprojected beam size in au. The decrease in intensity of CO towards the inner regions of Sz 65 is thought to be due to the effects of continuum subtraction. Compared with the results of Ansdell et al. (2018), who achieved an angular resolution of ~36 au with archival data, our R90 for the CO emission is consistent within the uncertainties with their value of 172 ± 24 au. Ansdell et al. (2018) found a larger size of 64 ± 2 au for previous continuum observations with a coarser angular resolution, but our value is consistent with measurements made in analyses in the uv plane by Andrews et al. (2018b) and Hendler et al. (2020).
The ratio of the observed gas and dust disc sizes can be indicative of the physics that drove the previous disc evolution. Thermochemical modelling by Trapman et al. (2019) posited that Rgas/ Rdust > 4 is a clear signal that there has been significant dust evolution within protoplanetary discs. In the sample of Long et al. (2022), who investigated gas disc sizes, 8 of 44 discs have large Rgas/ Rdust, that is, >4, suggesting strong radial drift. Of the six very low mass stars with compact discs studied by Kurtovic et al. (2021), four had a ratio greater than or close to four. The authors noted, however, that these measurements were conservative constraints because cloud contamination in Taurus can be strong.
The ratio of Rgas/Rdust for Sz 65 is 5.3 ± 0.9. This high ratio may indicate significant grain growth and radial drift in the disc (Trapman et al. 2020). A high Rgas/Rdust can also be explained by optical depth effects (Facchini et al. 2017), but we resolved the disc very well and the ratio of 5.3 is particularly high, suggesting that this is less likely to be the case for Sz 65. For Sz 66, the ratio is lower at 2.9 ± 1.0, consistent with that of single-star discs in Lupus and Taurus (Ansdell et al. 2018; Long et al. 2022). We know that the disc is part of a binary system, even in a system with a relatively large separation. The truncation of the disc during a previous close encounter between the two binary partners might therefore be the cause. The relative uncertainties in the size estimation are high because the disc is spatially less well resolved in the case of the gas. Observations with a higher signal-to-noise ratio in the outer regions of the disc would be able to place a more precise constraint on these results.
The gas and dust profiles in Fig. 4 do not show multiple successive rings and gaps, but are instead fairly smooth. These intensity profiles were deprojected using the inclination and position angle given in Sect. 5.1. The dust continuum emission from Sz 65 on a logarithmic scale (Fig. 4) shows one bump followed by a plateau at the outer edge of the disc ~20 au, but there are no deep gaps as seen in some DSHARP images, for example. This behaviour is similar to that of other compact discs that were observed at high resolution with ALMA, as we explore in Sect. 6.2. The radial profile of the CO emission in Sz 66 is smooth until it reaches the noise levels. The central part of the gas disc is very bright, suggesting unresolved and optically thick emission at short separation from Sz 66. We note again here that a uv taper of 0″.07 was applied to the data. Even deeper observations in the future may be able to reveal the details of these inner regions with more clarity.
Basic disc properties for Sz 65 and Sz 66.
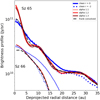 |
Fig. 5 Azimuthally averaged brightness profile from reconstructed images of Sz 65 and Sz 66 using robust = 0 and robust = 2. We also plot the brightness profile found by the non-parametric visibility fitting. We show three different model fits with a varying fit parameter α. Additionally, we show the FRANK profile convolved with the synthesised beam of the observations, and a profile derived from an image using robust = −2. |
5.3.2 Non-parametric visibility fitting
To scrutinise the radial brightness structures in Sz 65 further, we made a fit to the visibility data using the super-resolution fitting code FRANK (Jennings et al. 2020)1. We used the log-normal fitting method in FRANK, which fits for the radial profile in logarithmic brightness space. This version applies the power spectrum prior to log(Iv), and the fitting procedure follows that described in Junklewitz et al. (2016, i.e. RESOLVE). The log-normal version results in a smoother brightness profile with radius, as the fit is less prone to fitting rings of small amplitude or in noisier baseline ranges.
When multiple emission sources lie in the field of view of an observation, each contributes to the measured signal. Sz 66 is 6″.36 from Sz 65 and contained within the field of view of our observations, and so we must proceed cautiously with the analysis in the uv plane. Fortunately, Sz 65 is significantly brighter than Sz 66, and the angular separation between the two corresponds to a drop in efficienty to 0.84 in the primary beam of our observations. We verified that our non-parametric fit to the visibility plane successfully isolated only Sz 65 by fitting a model to Sz 66, and subtracted this from the visibilities. The brightness profile we extracted from the dataset from which the emission of Sz 66 was subtracted is indistinguishable from the profile extracted from the original data. The fainter emission at a large separation from the phase centre, such as that belonging to Sz 66, therefore has a negligible effect on the model fit. The features we see are therefore expected to correspond to the continuum emission of Sz 65 alone.
Figure 5 compares the average 1D brightness profile obtained from clean images with non-parametric fits to the visibilities using FRANK. Two clean profiles are shown, one using the fiducial robust = 0.0 as shown in Fig. 2, and one using robust = −2.0. Robust = −2.0 gives more weight to longer baselines, which are sensitive to the smallest spatial scales. This increases the resolution at the expense of sensitivity. This profile is very similar to that achieved using robust = 0.0, except in outer regions, where noise becomes more significant. Here, the robust = −2.0 image results in a shorter disc extension. For each disc, we used the disc geometry parameters given in Table 2 to deproject the emission. The maximum radius was set to 2″., and the number of collocation points used in the fit, N, was set to 300. In Fig. 6 we show the fit in visibility space, where the model fit line follows the data points very closely. When α is varied, the FRANK hyperparameter related to the signal-to-noise ratio threshold for visibilities to be included in the fit does not affect the result. In Fig. 5 we show fits using various alpha values to demonstrate this. For the remainder of this work, we refer to the alpha =1.2 case as the ‘FRANK fit’. We also varied the wsmooth FRANK parameter that acts to smooth the profile that is obtained from the fitting, but these variations did not significantly affect the form of the radial profile. A slight adjustment to the position of the disc was made relative to the Gaussian fit achieved as part of the FRANK fitting. The FRANK modelling begins with a Gaussian fit to the emission made in the uv plane in order to determine the geometry of the system. This determines the offset in RA and Dec from the phase center, the position angle, and the inclination of the disc. This method finds an inclination =63.8°, a position angle = 110.2°, dRA = −0.54 mas, and dDec = −2.23 mas. The inclination and position angle determined as part of the visibility analysis agree with fits to the image plane. We ran a wider grid of models with the central position of the disc shifted by up to ± 5 mas to check for reduced residuals, as demonstrated in Andrews et al. (2021); Jennings et al. (2022b), for example. The case with the least residuals is found to be a fit with a shift in space (dRA + 1 mas, dDec−4 mas).
Overall, the model and the image identify similar structures in the dust disc of Sz 65, as shown by Fig. 5. They retrieve the same plateau at about 20 au, which continues until the edge of the disc before a sharp drop. The visibility fitting suggests a smaller feature at about 6 au in Sz 65, for which there is no counterpart in either of the profiles extracted from the image plane. We therefore remain cautious about this potential gap. The visibilities tracing these scales are those measured on the longest baselines, for which the signal-to-noise ratio is lowest. In this case, future observations of the system are required to confirm the veracity of this feature, whether through higher signal-to-noise ratio millimeter imaging or at shorter wavelengths, where a higher angular resolution can be achieved.We can parametrise the gap size following (Long et al. 2018; Lodato et al. 2019) as the separation between the brightness minimum in the gap and brightness peak in the ring. The local brightness minimum in the visibility fitting model is at a deprojected separation of 20 au, and the peak brightness of the exterior ring is at 24 au. This gives a gap a size of 4 au, or a full width of 8 au assuming azimuthal symmetry. The brightness difference between these two locations is 8%. Convolution of the fitted model with a Gaussian of the same size as our synthesised beam reduces the amplitude of the inner regions slightly and smooths out this potential structure. With this exception, the image plane at very short separation from the star gives a very similar brightness distribution as the non-parametric fit to the visibilties. This can be described as a bright inner disc with a gap-ring structure in the outer disc.
It is possible that the general consistency between the image plane and uv plane profiles in Fig. 5 arises because Sz 65 does not host any finer (unseen) structure in its disc, and the angular resolution of our observations might be sufficient to trace the density variations in the disc, or because any structures that do exist are on scales much smaller than ≈3 au. We measured a continuum R90 = 27 au, and therefore, this should perhaps be expected as the scale height, H, at the very edge of the dust disc is likely ≤ 2.7 au. In this case, stable structures caused by pressure bumps in the gas disc that in turn shape the dust distribution should be smaller than our angular resolution in the inner regions of the disc.
In Fig. 7, we show the residual emission that remains after the FRANK model is subtracted from the clean image of Sz 65. Only some very low level residuals remain, which barely exceed the 3σ level measured from this map. This residual map shows that the FRANK fit is a very good representation of the data down to the noise level.
We repeated this process for the disc of Sz 66, for which the comparison of the model with the visibilities is shown in Fig. 8. The residual map is shown in Fig. 9. The FRANK model describes the emission well generally, although localised residual emission that reaches 7σ can be seen towards the south-west of the image, perhaps indicating an asymmetry in the outer regions of the disc.
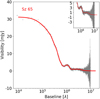 |
Fig. 6 Model fit to the real component of the deprojected visibilities of Sz 65 as a function of the baseline. |
5.3.3 Analysis of the molecular gas disc
We analysed the molecular gas disc of Sz 65 using our imaging of CO(2−1) as shown in Fig. 3. We note that the CO brightness line decreases around the line centre, primarily along the minor axis of the discs, possibly due to an oversubtraction of continuum. This limits our ability to search for misalignments between the inner and outer disc. Misalignments can be driven by massive embedded planets on inclined orbits (Nealon et al. 2018), via fly-bys, or through interactions with a companion (Cuello et al. 2019). If the discs of Sz 65 and Sz 66 have interacted in the past, we may expect to see some of the more common observational signatures such as spirals, disc truncation, or disc warping in observations of the CO line (Cuello et al. 2020). If the disc was warped by the binary interaction, we would expect to see a departure from Keplerian rotation in the velocity map of the disc. The subsequent velocity perturbations are generally about 0.1−1 km s−1 (see e.g. Wölfer et al. 2023), dependent upon the properties of the flyby of the binary partner, such as the inclination relative to the disc rotation, the separation distance, and the mass ratio of the partners (Nealon et al. 2018; Cuello et al. 2020). Our line cubes were averaged to a width of 1 km s−1. A finer spectral resolution is typically required to detect deviations from a Keplerian disc, unless the disruption has been particularly dramatic.
The continuum models from the visibility fitting were derived from a 1D radial profile, meaning that they assumed axisymmetry, but the spirals or perturbations induced by the influence of an external companion are not expected to be axisymmetric (e.g. Kurtovic et al. 2018). They can be studied by using gas line observations, however, to search for perturbations to the velocity structure.
We used the tool eddy (Teague 2019) to fit a rotation model to each of Sz 65 and Sz 66 using a model of a gas disc that rotated in a Keplerian manner. We subtracted this model from the map of peak velocities of the cube created with bettermoments (Teague & Foreman-Mackey 2018) using an image created with Briggs weighting and robust = 0.0, a spectral resolution averaged to 1.0 km s−1, and a 3σ threshold. The residual map following the subtraction of the model is shown in Fig. 10, where the colour stretch is the same as in Fig. 3. The peak residuals following the subtraction of the model from the Sz 65 moment 1 map reach ~ 1.3 km s−1 within the main disc. We assumed that the emission outside of the central 3σ emission is noise. These deviations are relatively small considering the initial spectral resolution of the cube 1.0 km s−1. We are only sensitive to quite significant disruptions to Keplerian motion, such as from interaction with a binary partner. The residuals with the greatest magnitude are confined to the inner regions. Through this modelling, we also obtained a kinematic constraint on the stellar mass of Sz 65 of M, = 0.77 ± 0.01 M⊙. This agrees very well with the results of spectroscopic modelling by Alcalá et al. (2017), who derived a mass of 0.76 M⊙. For the final fit to the disc, we fixed the robust mass and inclination values of the disc to avoid issues that can arise due to the degeneracy between the parameters (see Fig. A3 for the results of the MCMC fitting). The kinematic mass of the central object can be constrained with greater accuracy by using observations of greater angular and kinematic resolution. The disc self-gravity and stellar contribution to the gravity potential might also be taken into account where appropriate, as in Veronesi et al. (2021). We included vertical parameters in the fitting in order to constrain the vertical height of the disc. We used eddy to assume an azimuthually symmetric emission surface described by
 (2)
(2)
where r is the radial separation from the star ,and ψ describes the disc surface flaring. rtaper and qtaper describe the exponential taper at the edge of the disc where the emission height drops off. This modelling achieves a best-fit value of the aspect ratio constant 𝓏0 = 0.03 (see Fig. A3 for the MCMC results). This result is undoubtedly affected by the uv taper and spectral averaging applied to the data, and so this figure should represent a firm lower limit. Future observations achieving higher resolution both spatially and spectrally may reveal a higher surface layer in the disc. Despite introducing the elevated emission surface, the residuals on the right-hand side of the plot appear to be slightly redshifted, suggesting an undersubtraction in this area. A grid of models in which PA and inclination were varied in the fitting process did not reduce this effect, suggesting that it is not a issue that arises due to a poor fit to the disc geometry. It is most likely that these slightly redshifted residuals are a result of the relatively coarse spectral resolution of the observation of 1 km s−1. Alternatively, there are physical explanations that might contribute to this effect. The undersubtraction by the model might indicate an inability to achieve a close fit to the vertical emission height as parametrised in Eq. (2), or it could be the result of an overdensity in the disc, as has been modelled in circumbinary systems by Calcino et al. (2023).
In Fig. 11 we show a similar modelling of Sz 66, this time without invoking an elevated emission surface (the MCMC results are shown in Fig. A4). This fitting procedure finds an inclination value for the 12CO gas disc of 38°, which is significantly different from that derived from images of the dust disc, which was found to be 68° . We note, however, that it is more difficult to achieve a good Keplerian fit to the data for Sz 66. The residuals are greater in Fig. 11 because the data are noisier and because the disc is less well resolved spatially. Large residuals on both the blue- and redshifted side of the disc can be seen that perhaps suggest a vertical component to the gas disc, but the angular resolution of the observations is not sufficient to resolve this difference given the size of the disc we measure. It is difficult to discern true physical effects due to the low signal of the detection in Sz 66, and so we refrain from placing any further constraints on the structure from a kinematic analysis.
The dust emission (e.g. Fig. 1) contains no evidence of entrained dust material between the two discs that might suggest significant binary interaction or a recent fly-by. No detection is made, even though we included observations made with the more compact configurations, which are sensitive to such large spatial scales (Table 1). The maximum recoverable scale of the most compact configuration included in these observations, project code 2019.1.01135, is  . There does exist VLT/NACO imaging of the binary (Zurlo et al. 2021), in which there is bright emission around Sz 66 (tracing dust coupled to the gas) that might support extended diffuse emission, but no arc or spiral arm structure is apparent.
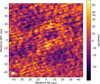 |
Fig. 7 Residual emission for Sz 65 following the subtraction of an axisymmetric model fitted to the visibilities from the original data. The solid white lines show residuals in steps of σ, positive contours begin at 3σ, and dashed lines show negative contours that begin at −3σ. The solid black line shows the 3σ emission contour of the continuum image prior to the model subtraction. |
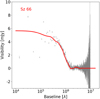 |
Fig. 8 Model fit to the real component of the deprojected visibilities of Sz 66 as a function of the baseline. |
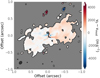 |
Fig. 10 Residual map following the subtraction of a Keplerian disc model with elevated emission constructed from the velocity information in 12CO observations towards Sz 65. The colour scale is set to match the full range of the data before subtraction. |
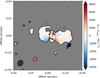 |
Fig. 11 Same as in Fig. 10, but for Sz 66. The 12CO detection in this disc is much weaker and affects the model fit. |
5.3.4 Tidal truncation
We can use the constraints on disc size to investigate the likelihood of a previous tidal truncation of the protoplanetary discs through binary interaction. Theoretical models estimate the truncated equilibrium tidal radii, Rt, for discs in a binary pair that is dependent upon the orbital parameters, such as the separation between the two sources, a, the eccentricity of their orbit, e, and the mass ratio of the two stars, q. The measured size of a protoplanetary disc can then be compared with the predicted tidal truncation radius for wide or intermediate separation binary pairs, as demonstrated in Harris et al. (2012); Panić et al. (2020). Pichardo et al. (2005) gave a semi-analytical approximation fora truncated disc size that we can write as
![${R_t} \approx 0.337\left[ {{{{{(1 - e)}^{1.2}}{q^{2/3}}{\mu ^{0.07}}} \over {0.6{q^{2/3}} + \ln \left( {1 + {q^{1/3}}} \right)}}} \right]a,$](/articles/aa/full_html/2024/02/aa47135-23/aa47135-23-eq6.png) (3)
(3)
where µ is the mass fraction of the stars (=q/(1+q)). We do not know the true separation, a, of the two stars, but we can instead use the projected angular separation derived from Gaia parallaxes to create a probabilistic model of Rt by following Torres (1999), who gave the ratio of the semimajor axis to the physical separation as
 (4)
(4)
where ω is the longitude of periastron, and υ is the true anomaly. Following the approach of Harris et al. (2012), we used a Monte Carlo approach to sample ω, i, e, and υ, assuming the eccentricity distribution to be uniform, and that orbital inclinations have a sin(i) dependence. This analysis also assumes that the disc midplane lies on the orbital plane of the binary system. The two discs have a comparable inclination on the sky as derived from the continuum observations (≈61° and 68°, for Sz 65 and Sz 66, respectively). Wide binaries are often found to be slightly misaligned with each other (Jensen et al. 2004). If a similar inclination in the individual discs traces an initial inclination of the binary orbital plane, it might support a scenario in which the two systems formed from the same molecular cloud. There are many processes, however, that can lead to a misalignment of the two discs during their formation. The relative alignment in class II may be due to mechanisms acting after formation to re-align the discs (Bate 2000; Jensen et al. 2004). Using Eq. (4), we calculate a probability distribution, P(Rt), that each disc has been truncated tidally to a radius Rt. We can calculate P(Rt) for Sz 65 by defining q = MSz65/MSz66, or alternatively, for Sz 66 by inverting this ratio.
Figure 12 shows the results of the calculations for a truncation radius of both Sz 65 and Sz 66 after running 106 models for each case. These samplings were repeated for two different uniform eccentricity priors [0.0, 0.7] as adopted in Harris et al. (2012) and [0.0, 0.9] in order to consider high-eccentricity cases. By considering high eccentricity in the binary orbit, lower Rt results become more likely. This is shown in Fig. 12 by the dotted line, which represents a set of solutions calculated by sampling a wider range of eccentricity values with emax up to 0.9. As discussed in Harris et al. (2012), we currently lack the empirical information to characterise the eccentricity distribution among multiple systems with statistical significance. Systems with short orbital periods tend to have low eccentricity as a result of the tidal circularisation of the orbit (Zahn 1977; Zahn & Bouchet 1989; Melo et al. 2001), but for systems with longer periods, the distribution can be considered relatively uniform for 0.1 < e < 0.9 (Mathieu 1994).
In Fig. 12, Sz 66 is expected to be the more compact disc, with its most likely truncation radius found at 195 au. This is large in comparison to the R90 =47 au we derive from the 12CO imaging. Only 7% of the solutions for Rt are smaller than the derived R90 for Sz 66. As shown in Sect. 5.3.1, Sz 66 has a gas/dust size ratio similar to that of single stars in surveys of star-forming regions, and overall, it therefore seems unlikely that tidal truncation causes such a compact disc. The disc may have formed radially compact from the very beginning. Sz 65 has a most likely predicted truncation radius of 276 au, which is also much larger than the measured R90, which is 161 au. In Fig. 12, the vertical line indicating our derived R90 is towards the middle of the range of predicted values. From this analysis, there is not sufficient evidence that tidal truncation is the primary influence in setting the disc sizes we measure.
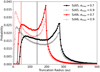 |
Fig. 12 Probability distribution P(Rt) for the disc radii expected in Sz 65 and Sz 66 assuming tidal truncation of the disc by its binary partner. The calculations were run for each binary partner for two different uniform eccentricity priors, one with emax = 0.7, and one allowing for high-inclination solutions with emax = 0.9. The vertical lines show the measured R90 for each disc by this work. |
6 Discussion
6.1 Evidence of substructure in the high-resolution observations of Sz 65 and Sz 66
One of the main results of the DSHARP survey suggested that substructure in large protoplanetary discs was ubiquitous. We have presented high-resolution observations of two compact previously poorly resolved discs in order to search for substructure. The two discs are compact and have low-mass discs surrounding late-type stars in a wide binary system. Both discs are well resolved by the achieved synthesised beam, which allows a search for substructures in the dust discs. Highly substructured discs would suggest dust traps and would prevent the continued radial inward drift of the dust grains. If they are structureless on smaller spatial scales as well, this might suggest that radial drift works efficiently and that there is a lack of dust trapping at large radii. To confirm the trapping scenario for certain would require resolving the trapping scale of ~H. For these systems, this confirmation remains tantalisingly out of reach; at the measured R90 for Sz 65, a typical scale height in protoplanetary discs of H ≈ 0.1R would give a length scale of ≈3 au, which is just under the achieved synthesised beam size. This resolution is sufficient to detect particularly large or deep structures, however.
Sz 65 shows a low-contrast ring-gap structure that was confirmed through a visibility analysis. Inside of the ring, the brightness decrease is visible, but not particularly strong. We find a shallow gap, and the intensity structure we detect is symmetrical. The shallow nature of the gap might indicate that the structure is very narrow and has not been fully resolved by our observations. There are also physical explanations for a shallow gap; it might arise because the outer ring forms as a result of a leaky dust trap (Zhu et al. 2012; Bosman et al. 2019; Sturm et al. 2022), where a weak pressure bump, or one that is ineffective at trapping millimetre-sized dust grains, has caused a pile-up of dust to create the outer ring in Sz 65, but is unable to completely prevent radial inward drift. If the structures are formed by planets, a low-contrast feature is likely. Discs with a low initial mass have a lower budget with which to form large planets, and the lower-mass planets are unable to carve gaps that are as deep as those that are carved by giant planets several times the mass of Jupiter, for example. In order to estimate the masses of planets in a protoplanetary disc using gap widths and contrasts, complex hydrodynamic models are required that involve numerous uncertain variables. We can calculate indicative values for upper limits on the maximum mass of planets in the system using scaling relations that arise from this modelling, however (Lodato et al. 2019; Ribas et al. 2023; Yang et al. 2023). For example, following Lodato et al. (2019), we can assume low viscosity (α < 0.01) and that the width of the gap opened by a planet, ∆, scales with the Hill radius of the planet, leading to a relation of the planet mass and the gap width,
 (5)
(5)
where ∆ is measured between the minimum brightness point in the gap and the maximum brightness of the ring exterior to it. k is a constant arising from the modelling, and it varies between 4.5 and 8 (Lodato et al. 2019; Rosotti et al. 2016), M* is the stellar mass, and r is the radial position of the planet. For Sz 65, M* = 0.76 (Alcalá et al. 2017), and we can measure the gap width as described by using the FRANK fit to the radial profile, which has a minimum gap brightness found at 20 au and a peak ring brightness at 24 au. When we account for variation in k, this means that an upper limit on the mass of a planet found is 0.04–0.2 MJup, for the brightness variation we observe.
Sz 66 is resolved by the new observations, but no new substructure is revealed. The subtraction of the FRANK model from the clean image shows some residuals that might hint at asymmetry in the disc, but these strong residuals are very localised; they are located within one beam width. The peak residuals reach 7σ. These hints should be followed up with further high-resolution imaging at different wavelengths to allow a characterisation of the dust. Imaging at shorter wavelengths may be capable of revealing the morphology of the inner disc, as was achieved for discs around Herbig stars with near-IR imaging using PIONIER data by (Kluska et al. 2020).
For the molecular gas disc, the moment 0 maps of CO emission presented in Fig. 3 reach relatively low peaks in signal-to-noise ratio, both of about 5σ. Whilst useful for constraining the disc size, deeper observations of these lines at a similar angular resolution are required to reliably confirm structures in the gas disc. In particular, maintaining a sufficient signal-to-noise ratio whilst increasing the spectral resolution of molecular line observations will aid in the kinematic analysis that explores the molecular gas distribution in greater detail.
6.2 DSHARP sample comparison
To assess to which extent our compact discs are comparable to massive and structured discs, we compared the radial profile of Sz 65 and Sz 66 to the results of the DSHARP survey, which contains discs with a variety of substructure. The brightness temperature, TB, of the continuum radial profile was calculated and plotted alongside those from the DSHARP survey achieved with a similar resolution (DSHARP, ≈5 au, vs. this work, ≈3 au) in Fig. 13, as was done in Facchini et al. (2019) for the disc CX Tau.
The top panel in Fig. 13 compares the TB(R) profile for Sz 65 and Sz 66 with the DSHARP sample and CX Tau (Facchini et al. 2019). The difference in the radial extent of the compact discs is very clear. The highly structured systems show deep rings and gaps and a much greater radial extent. In these outer regions, the pressure scale height is larger, and stable substructures are therefore broader radially. In the inner disc, these features are less frequent, with some exceptions on which we focus below. In the top panel of Fig. 13, Sz 65 and Sz 66 have a lower brightness temperature than most DSHARP discs. This may be due to a decreased column density, a decreased temperature, or fewer millimetre-sized grains.
A more like-for-like comparison can be made between the compact discs and the compact DSHARP discs alone. In the bottom panel of Fig. 13, we plot the TB profile of Sz 65 and Sz 66 against the most radially compact discs from the DSHARP survey. In this grouping, Sz 65 no longer appears as an outlier, with a similar radial extent and TB as the other systems. Sz 66, however, is more similar to CX Tau, and they are by far the two most radially compact objects. This group of objects is one of the best-resolved compact discs observed by ALMA so far. The substructure features we see are faint contrast gaps that could be caused by a leaky dust trap that cannot efficiently retain millimetre-particles in the outer disc.
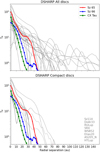 |
Fig. 13 Brightness temperature as a function of radius calculated from the 1.3mm continuum images of Sz 65 (red) and Sz 66 (blue) compared with the results of the DSHARP survey (grey). In addition, we plot the radial profile of the well-resolved compact disc CX Tau (Facchini et al. 2017). All DSHARP discs are plotted in the top panel. Only discs classified as compact are plotted in the lower panel and are listed on the right side. Discs with a derived disc size >50 au are plotted with dashed lines. |
6.3 Structure in compact discs
We present high-resolution observations of Sz 65 and Sz 66 for the first time. The structure we detect in Sz 65 supports the claim that substructure is ubiquituous at sufficiently high angular resolution. Sz 66, however, remains compact and lacks clearly identifiable substructures even at high resolution. Our observations of two compact discs and the comparison with the most compact members of the DSHARP sample do not support the interpretation that compact discs in large surveys are simply scaled-down versions of the extended highly structured cases, that is, with smaller rings at shorter radii. This conclusion is shared by a study of a faint compact disc CX Tau by Facchini et al. (2019), which are resolved at 1.3mm with ALMA down to 5 au. Figure 13 suggests that Sz 65 and Sz 66 have more in common with the DSHARP compact discs (in terms of radial extent) than they do with the wider DSHARP sample. We might then speculate that the former falls into a category of discs that lack efficient dust traps in the outer disc, whilst the latter belong to a category in which the millimetre grains have been retained in the outer disc. CX Tau was found to have a high gas-to-dust size ratio, which the authors interpreted as indicating efficient radial drift, which would support this analysis. Pinilla et al. (2021) analysed an example that might represent the other category, in which a planet-induced dust trap can explain the deep and wide cavity (≈20 au) around the low-mass star CIDA 1. We must also consider the possibility that compact discs simply formed very small, and so there is no need to invoke further processes during the evolution of the disc. Large gas discs such as we find in Sz 65 disagree with this scenario, but for Sz 66, this is perhaps a more plausible origin. Extremely compact discs have been identified in Lupus by (van der Marel et al. 2022), who reported that Sz 104 and Sz 112 have radii of 2.5 and 3.5 au, respectively.
Categorising discs into the two groups of compact discs and DSHARP-like structured objects is convenient here to assess discs with similar properties, but it does not necessarily help us to understand the physics of the individual systems involved or their planet-forming ability.
We can examine the link between compact discs and planet formation by considering that late-type stars, and M dwarfs such as Sz 65 in particular, are associated with a higher occurrence of transiting planets than Sun-like stars. They also show discs with substructure. Kurtovic et al. (2021) identified structures in the dust discs around three of the six very low mass stars in Taurus with  resolution with ALMA at Band 7. Modelling of the planet formation around M dwarfs by Mulders et al. (2021) is consistent with observed statistics, where the authors find the formation of hot super-Earths to be most likely around low-mass stars, whilst higher-mass stars are more likely to form a gas giant, and that the formation of this first giant can then interrupt the pebble flow into inner regions, inhibiting further formation. These results provide a physical mechanism that could explain some of the suggestions above concerning a drift-based evolution in comparison to one that is dominated by the dust traps, and as is discussed in van der Marel & Mulders (2021). In a disc that has not created a giant planet early, we should also take note of the correlation between stellar mass and disc mass (Andrews et al. 2013; Ansdell et al. 2016; Pascucci et al. 2016). Discs around less massive stars are less massive, and so do not have the potential to birth multiple massive planets that can carve multiple gaps. The dust mass estimate made here is 16.1 M⊕, whilst for HD 163296, using the same method as above and the integrated flux given in Andrews et al. (2018b), we calculate that the dust mass could be as high as ≈ 187 M⊕. These masses calculated in the same manner indicate that the disc around the ≈2 M⊙ star contains significantly more millimetre dust, seemingly by order(s) of magnitude. Less massive discs will lead to less massive planets, or indeed fewer planets. Less massive planets will naturally result in less clearly defined features (Rosotti et al. 2016), and often require low turbulence in the disc to form structures such as rings at all (Kuwahara et al. 2022). Analysing observations of a total of 700 discs, van der Marel & Mulders (2021) found that ≈10% of the discs are structured for the given resolution of the archival observations, and that the proportion of discs in which rings or cavities can be identified increases in discs with a greater dust mass. It is therefore perhaps expected that we see deep gaps in HD 163296 at millimetre wavelengths (Isella et al. 2018), for instance, but in this work, we detect only a low-contrast gap in Sz 65.
Fundamentally, the contrast in annular features, that is, the depth of a gap or the sharpness of a ring, is a function of the efficiency of the initial dust trap in being able to trap particles with a size relevant to the observing wavelength, and for how long the trap can survive. Optical depth effects can also lead to a variation in emission brightness and may also be at work in these systems. Observations at longer wavelength will be a key tool for investigating this possibility and can be achieved in the future using ALMA with receivers in Band 1 or 3 (2.6–8.6 mm) or the future ngVLA (Ricci et al. 2018, 3 mm−1 cm). Strong gas pressure bumps lead to spectacular annular structures, but short-lived or weak bumps may instead lead to cavities with much dust within, as we find here, or very radially compact discs. Equally, turbulent discs with high α viscosity will work to limit these structures, whilst low-turbulence discs allow them to survive longer. In a single system, when and where in a disc a pressure bump forms will dictate how the dust evolution in the disc proceeds from that point. Many suggested mechanisms for forming such bumps are available in the literature, each of which works over different length scales and at different points in the lifetime of a disc. This provides a plethora of potential evolutionary pathways that often depend on local system-specific properties. For example, Sz 65, Sz 66, and SR4 (included here as part of the DSHARP sample) are all considered compact discs, one of which has a low-contrast substructure, one has no obvious structure at all, and one has a very clear inner gap. Only for much greater sample sizes of spatially well-resolved compact discs or by considering alternative unifying properties other than disc size and frequency of structure might an overall trend emerge. Promising avenues for future work might be to consider the extent of the chemical evolution expected in compact discs (Miotello et al. 2021), a multi-wavelength approach to compact discs, or a focus on achieving spatially and spectrally well-resolved observations of molecular gas as well as dust continuum emission.
7 Conclusions
We have presented high-resolution ALMA observations of two compact discs in Lupus, Sz 65 and Sz 66. We carried out an in-depth analysis of the dust continuum emission in Sz 65 in order to detect signs of substructure in the disc. Through non-parametric visibility modelling, we found evidence of a shallow gap at about 20 au, with a ring-like increase in emission at the edge of the disc. This gives proof in this individual case of structure in a compact disc, but not a structure that is so readily apparent as those found in the DSHARP survey, for example. The ring and gap in Sz 65 that we find here may have arisen due to a leaky dust trap that cannot efficiently retain millimetre-sized dust in the outer disc. Non-parametric visibility fitting finds a possible feature at 6 au for which further observational confirmation is necessary. Sz 66 is resolved spatially, but is found to be very radially compact, with some evidence of an asymmetric dust distribution seen when a disc model fitted to the visibilities is subtracted from the image, but an otherwise smooth or structureless profile, much like unresolved compact discs in previous surveys. The observations do not support the hypothesis that these two discs are simply radially smaller size-scaled versions of the bright radially extended DSHARP discs that show multiple substructures. Sz 65 and Sz 66 instead show a clear outer edge of millimetre material, and only Sz 65 shows evidence of a ring, but no evidence of millimetre structures on wider scales.
Molecular gas in the discs is detected reliably only after the application of a uv taper of  to our observations. With these data, we constrain the size of the molecular gas disc with an improved spatial accuracy in comparison to previous observations. Both Sz 65 and Sz 66 have gas discs that are more extended than their dust discs. The ratio of Rgas/Rdust for Sz 65 is 5.3 ± 0.9, suggesting a disc that has undergone dust evolution. For Sz 66, the ratio is 2.9 ± 1.0, but the relative uncertainties are high because the disc is less well resolved spatially. Nevertheless, even within the uncertainties, the current data suggest that this disc has a ratio Rgas/Rdust lower than the indicative value of 4, perhaps suggestive of truncation, or of an initial disc that was also very compact. Tests of the statistical likelihood of disc truncation due to binary interaction suggest that truncation can only have been a significant influence if the eccentricity of the Sz 65–Sz 66 orbit is very high. Future observations are needed to constrain these orbital properties further.
The categorisation of discs into structured and unstructured strongly relies on the observing set-up used to take the data. Structure may always exist on smaller scales or may be visible at different wavelengths that are not apparent in a particular image. It is more physically useful to think about drift-dominated and trapping-dominated evolution of the dust. The ability of a disc to form and sustain a gas pressure bump is the main driver of annular structures such as rings and gaps. Asymmetric structure such as spiral arms or clumps often depend on the dynamics between star and planet, a star and a binary partner, or fly-by interaction. These processes may still occur on smaller scales because a typical definition of any such features is yet to be found. The comparison of Sz 65 and Sz 66 with the DSHARP radial profiles showed that compactness does not necessarily lead to a lack of structure. There does appear to be a link between radial size of the disc and the clarity of these structures, for example, deeper cavities in the extended DSHARP discs. We urge continued research into compact discs, however, in order to further investigate unifying properties amongst this population, for example, investigating predictions of rapid chemical evolution in compact discs (Miotello et al. 2021).
Acknowledgements
This paper makes use of the following ALMA data: ADS/JAO.ALMA# 2017.1.00569.S, 2018.1.00271.S, 2018.1.01458.S, 2019.1.01135.S, 2015.1.00222.S. ALMA is a partnership of ESO (representing its member states), NSF (USA) and NINS (Japan), together with NRC (Canada), MOST and ASIAA (Taiwan), and KASI (Republic of Korea), in cooperation with the Republic of Chile. The Joint ALMA Observatory is operated by ESO, AUI/NRAO and NAOJ. This research has made use of the SIMBAD database, operated at CDS, Strasbourg, France. TJH is funded by a Royal Society Dorothy Hodgkin Fellowship. M.B. received funding from the European Research Council (ERC) under the European Union’s Horizon 2020 research and innovation programme (PROTOPLANETS, grant agreement no. 101002188). This work made use of Astropy: http://www.astropy.org a community-developed core Python package and an ecosystem of tools and resources for astronomy (Astropy Collaboration 2013, 2018, 2022). The authors would additionally like to thank Megan Ansdell for making available her fits files and scripts pertaining to archival data on Sz 65. Thanks also to participants of the “Planet and binary formation in gravitationally unstable protoplanetary discs in the high-resolution era” conference for productive and inspiring discussions.
Appendix
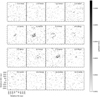 |
Fig. A1 Channel maps of 12CO(2-1) in Sz 65 at the native resolution with a synthesising beam |

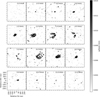 |
Fig. A2 Channel maps of 12CO(2-1) in Sz 65 after the application of |


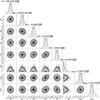 |
Fig. A3 Corner plot showing the MCMC results for the rotational model fit to the 12CO observations, achieved by fixing the inclination to the continuum value of 63.76°, using a stellar mass of 0.76 M⊙ (Alcalá et al. 2017) and a distance derived from Gaia EDR3 153.1 pc. |
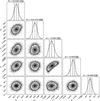 |
Fig. A4 Corner plot showing the MCMC results for the rotational model fit to the 12CO observations, achieved by fixing the stellar mass of 0.31 M⊙ (Alcalá et al. 2014) and a distance derived from Gaìa EDR3 156.0 pc. |
References
- Akeson, R. L., & Jensen, E. L. 2014, ApJ, 784, 62 [NASA ADS] [CrossRef] [Google Scholar]
- Akeson, R. L., Jensen, E. L. N., Carpenter, J., et al. 2019, ApJ, 872, 158 [Google Scholar]
- Alcalá, J. M., Natta, A., Manara, C. F., et al. 2014, A&A, 561, A2 [NASA ADS] [CrossRef] [EDP Sciences] [Google Scholar]
- Alcalá, J. M., Manara, C. F., Natta, A., et al. 2017, A&A, 600, A20 [NASA ADS] [CrossRef] [EDP Sciences] [Google Scholar]
- ALMA Partnership (Brogan, C. L., et al.) 2015, ApJ, 808, L3 [Google Scholar]
- Andrews, S. M. 2020, ARA&A, 58, A483 [NASA ADS] [CrossRef] [Google Scholar]
- Andrews, S. M., Rosenfeld, K. A., Kraus, A. L., & Wilner, D. J. 2013, ApJ, 771, 129 [Google Scholar]
- Andrews, S. M., Huang, J., Pérez, L. M., et al. 2018a, ApJ, 869, L41 [NASA ADS] [CrossRef] [Google Scholar]
- Andrews, S. M., Terrell, M., Tripathi, A., et al. 2018b, ApJ, 865, 157 [Google Scholar]
- Andrews, S. M., Elder, W., Zhang, S., et al. 2021, ApJ, 916, 51 [NASA ADS] [CrossRef] [Google Scholar]
- Ansdell, M., Williams, J. P., Marel, N. v. d., et al. 2016, ApJ, 828, 46 [NASA ADS] [CrossRef] [Google Scholar]
- Ansdell, M., Williams, J. P., Trapman, L., et al. 2018, ApJ, 859, 21 [NASA ADS] [CrossRef] [Google Scholar]
- Astropy Collaboration (Robitaille, T. P., et al.) 2013, A&A, 558, A33 [NASA ADS] [CrossRef] [EDP Sciences] [Google Scholar]
- Astropy Collaboration (Price-Whelan, A. M., et al.) 2018, AJ, 156, 123 [Google Scholar]
- Astropy Collaboration (Price-Whelan, A. M., et al.) 2022, ApJ, 935, 167 [NASA ADS] [CrossRef] [Google Scholar]
- Ataiee, S., Pinilla, P., Zsom, A., et al. 2013, A&A, 553, L3 [NASA ADS] [CrossRef] [EDP Sciences] [Google Scholar]
- Bae, J., Isella, A., Zhu, Z., et al. 2023, ASP Conf. Ser., 9, 423 [Google Scholar]
- Bai, X. N., & Stone, J. M. 2014, ApJ, 796, 31 [NASA ADS] [CrossRef] [Google Scholar]
- Bailer-Jones, C. A. L., Rybizki, J., Fouesneau, M., Demleitner, M., & Andrae, R. 2021, AJ, 161, 147 [Google Scholar]
- Banzatti, A., Pinilla, P., Ricci, L., et al. 2015, ApJ, 815, L15 [Google Scholar]
- Banzatti, A., Pascucci, I., Bosman, A. D., et al. 2020, ApJ, 903, 124 [NASA ADS] [CrossRef] [Google Scholar]
- Barenfeld, S. A., Carpenter, J. M., Ricci, L., & Isella, A. 2016, ApJ, 827, 142 [Google Scholar]
- Baruteau, C., & Zhu, Z. 2016, MNRAS, 458, 3927 [NASA ADS] [CrossRef] [Google Scholar]
- Bate, M. R. 2000, MNRAS, 314, 33 [Google Scholar]
- Beckwith, S. V. W., Sargent, A. I., Chini, R. S., & Guesten, R. 1990, AJ, 99, 924 [Google Scholar]
- Booth, R. A., & Ilee, J. D. 2019, MNRAS, 487, 3998 [CrossRef] [Google Scholar]
- Booth, R. A., Clarke, C. J., Madhusudhan, N., & Ilee, J. D. 2017, MNRAS, 469, 3994 [Google Scholar]
- Bosman, A. D., Banzatti, A., Bruderer, S., et al. 2019, A&A, 631, A133 [NASA ADS] [CrossRef] [EDP Sciences] [Google Scholar]
- Briggs, D. S. 1995, PhD thesis [Google Scholar]
- Calcino, J., Price, D. J., Pinte, C., et al. 2023, MNRAS, 523, 5763 [NASA ADS] [CrossRef] [Google Scholar]
- Cieza, L. A., Ruíz-Rodríguez, D., Hales, A., et al. 2019, MNRAS, 482, 698 [Google Scholar]
- Cieza, L. A., González-Ruilova, C., Hales, A. S., et al. 2021, MNRAS, 501, 2934 [Google Scholar]
- Cuello, N., Dipierro, G., Mentiplay, D., et al. 2019, MNRAS, 483, 4114 [Google Scholar]
- Cuello, N., Louvet, F., Mentiplay, D., et al. 2020, MNRAS, 491, 504 [Google Scholar]
- Dong, R., & Fung, J. 2017, ApJ, 835, 146 [NASA ADS] [CrossRef] [Google Scholar]
- Dong, R., Li, S., Chiang, E., & Li, H. 2017, ApJ, 843, 127 [Google Scholar]
- Dong, R., Liu, S.-y., Eisner, J., et al. 2018a, ApJ, 860, 124 [Google Scholar]
- Dong, R., Najita, J. R., & Brittain, S. 2018b, ApJ, 862, 103 [NASA ADS] [CrossRef] [Google Scholar]
- Dullemond, C. P., Birnstiel, T., Huang, J., et al. 2018, ApJ, 869, L46 [NASA ADS] [CrossRef] [Google Scholar]
- Facchini, S., Birnstiel, T., Bruderer, S., & Van Dishoeck, E. F. 2017, A&A, 605, A16 [NASA ADS] [CrossRef] [EDP Sciences] [Google Scholar]
- Facchini, S., Van Dishoeck, E. F., Manara, C. F., et al. 2019, A&A, 626, L2 [NASA ADS] [CrossRef] [EDP Sciences] [Google Scholar]
- Flock, M., Ruge, J. P., Dzyurkevich, N., et al. 2015, A&A, 574, A68 [NASA ADS] [CrossRef] [EDP Sciences] [Google Scholar]
- Harris, R. J., Andrews, S. M., Wilner, D. J., & Kraus, A. L. 2012, ApJ, 751, 115 [Google Scholar]
- Hendler, N., Pascucci, I., Pinilla, P., et al. 2020, ApJ, 895, 126 [Google Scholar]
- Högbom, J. A. 1974, A&AS, 15, 417 [Google Scholar]
- Huang, J., Andrews, S. M., Dullemond, C. P., et al. 2018, ApJ, 869, L42 [NASA ADS] [CrossRef] [Google Scholar]
- Isella, A., Huang, J., Andrews, S. M., et al. 2018, ApJ, 869, L49 [NASA ADS] [CrossRef] [Google Scholar]
- Jennings, J., Booth, R. A., Tazzari, M., Rosotti, G. P., & Clarke, C. J. 2020, MNRAS, 495, 3209 [Google Scholar]
- Jennings, J., Booth, R. A., Tazzari, M., Clarke, C. J., & Rosotti, G. P. 2022a, MNRAS, 509, 2780 [Google Scholar]
- Jennings, J., Tazzari, M., Clarke, C. J., Booth, R. A., & Rosotti, G. P. 2022b, MNRAS, 514, 6053 [NASA ADS] [CrossRef] [Google Scholar]
- Jensen, E. L. N., Mathieu, R. D., Donar, A. X., & Dullighan, A. 2004, ApJ, 600, 789 [NASA ADS] [CrossRef] [Google Scholar]
- Junklewitz, H., Bell, M. R., Selig, M., & Enßlin, T. A. 2016, A&A, 586, A76 [NASA ADS] [CrossRef] [EDP Sciences] [Google Scholar]
- Kluska, J., Berger, J. P., Malbet, F., et al. 2020, A&A, 636, A116 [NASA ADS] [CrossRef] [EDP Sciences] [Google Scholar]
- Kraus, S., Kreplin, A., Fukagawa, M., et al. 2017, ApJ, 848, L11 [NASA ADS] [CrossRef] [Google Scholar]
- Kurtovic, N. T., Pérez, L. M., Benisty, M., et al. 2018, ApJ, 869, L44 [Google Scholar]
- Kurtovic, N. T., Pinilla, P., Long, F., et al. 2021, A&A, 645, A139 [EDP Sciences] [Google Scholar]
- Kuwahara, A., Kurokawa, H., Tanigawa, T., & Ida, S. 2022, A&A, 665, A122 [NASA ADS] [CrossRef] [EDP Sciences] [Google Scholar]
- Lodato, G., Dipierro, G., Ragusa, E., et al. 2019, MNRAS, 486, 453 [Google Scholar]
- Long, F., Pinilla, P., Herczeg, G. J., et al. 2018, ApJ, 869, 17 [Google Scholar]
- Long, F., Herczeg, G. J., Harsono, D., et al. 2019, ApJ, 882, 49 [Google Scholar]
- Long, F., Andrews, S. M., Rosotti, G., et al. 2022, ApJ, 931, 6 [NASA ADS] [CrossRef] [Google Scholar]
- Lyra, W., Turner, N. J., & Mcnally, C. P. 2015, A&A, 574, A10 [NASA ADS] [CrossRef] [EDP Sciences] [Google Scholar]
- Mathieu, R. D. 1994, ARA&A, 32, 465 [NASA ADS] [CrossRef] [Google Scholar]
- Melo, C. H., Covino, E., Alcalá, J. M., & Torres, G. 2001, A&A, 378, 898 [NASA ADS] [CrossRef] [EDP Sciences] [Google Scholar]
- Miotello, A., Rosotti, G., Ansdell, M., et al. 2021, A&A, 651, A48 [NASA ADS] [CrossRef] [EDP Sciences] [Google Scholar]
- Mulders, G. D., Drazkowska, J., van der Marel, N., Ciesla, F. J., & Pascucci, I. 2021, ApJ Lett., 920, L1 [NASA ADS] [CrossRef] [Google Scholar]
- Nazari, P., Booth, R. A., Clarke, C. J., et al. 2019, MNRAS, 485, 5914 [Google Scholar]
- Nealon, R., Dipierro, G., Alexander, R., Martin, R. G., & Nixon, C. 2018, MNRAS, 481, 20 [Google Scholar]
- Paardekooper, S. J., & Mellema, G. 2006, A&A, 453, 1129 [CrossRef] [EDP Sciences] [Google Scholar]
- Panić, O., Haworth, T. J., Petr-Gotzens, M. G., et al. 2020, MNRAS, 501, 4317 [Google Scholar]
- Pascucci, I., Testi, L., Herczeg, G. J., et al. 2016, ApJ, 831, 125 [Google Scholar]
- Pérez, L. M., Carpenter, J. M., Andrews, S. M., et al. 2016, Science, 353, 1519 [Google Scholar]
- Pérez, S., Casassus, S., Hales, A., et al. 2020, ApJ, 889, L24 [Google Scholar]
- Pichardo, B., Sparke, L. S., & Aguilar, L. A. 2005, MNRAS, 359, 521 [NASA ADS] [CrossRef] [Google Scholar]
- Pinilla, P., Benisty, M., & Birnstiel, T. 2012a, A&A, 545, A81 [NASA ADS] [CrossRef] [EDP Sciences] [Google Scholar]
- Pinilla, P., Birnstiel, T., Ricci, L., et al. 2012b, A&A, 538, A114 [NASA ADS] [CrossRef] [EDP Sciences] [Google Scholar]
- Pinilla, P., Kurtovic, N. T., Benisty, M., et al. 2021, A&A, 649, A122 [NASA ADS] [CrossRef] [EDP Sciences] [Google Scholar]
- Ribas, A., Macías, E., Weber, P., et al. 2023, A&A, 673, A77 [NASA ADS] [CrossRef] [EDP Sciences] [Google Scholar]
- Ricci, L., Isella, A., Liu, S.-f., & Li, H. 2018, in Science with a Next-Generation Very Large Array, ed. E. J. Murphy (Astronomical Society of the Pacific), 147 [Google Scholar]
- Rosotti, G. P., Juhasz, A., Booth, R. A., & Clarke, C. J. 2016, MNRAS, 459, 2790 [Google Scholar]
- Schoonenberg, D., & Ormel, C. W. 2017, A&A, 602, A21 [NASA ADS] [CrossRef] [EDP Sciences] [Google Scholar]
- Stammler, S. M., Birnstiel, T., Panic, O., Dullemond, C. P., & Dominik, C. 2017, A&A, 600, A140 [NASA ADS] [CrossRef] [EDP Sciences] [Google Scholar]
- Sturm, J. A., McClure, M. K., Harsono, D., et al. 2022, A&A, 660, A126 [NASA ADS] [CrossRef] [EDP Sciences] [Google Scholar]
- Teague, R. 2019, J. Open Source Softw., 4, 1220 [Google Scholar]
- Teague, R., & Foreman-Mackey, D. 2018, Res. Notes Amer. Astron. Soc., 2, 173 [NASA ADS] [Google Scholar]
- Torres, G. 1999, PASP, 111, 169 [NASA ADS] [CrossRef] [Google Scholar]
- Trapman, L., Facchini, S., Hogerheijde, M. R., van Dishoeck, E. F., & Bruderer, S. 2019, A&A, 629, A79 [NASA ADS] [CrossRef] [EDP Sciences] [Google Scholar]
- Trapman, L., Ansdell, M., Hogerheijde, M. R., et al. 2020, A&A, 638, A38 [NASA ADS] [CrossRef] [EDP Sciences] [Google Scholar]
- Tripathi, A., Andrews, S. M., Birnstiel, T., & Wilner, D. J. 2017, Sci. Rep., 7, 3056 [CrossRef] [Google Scholar]
- van der Marel, N., & Mulders, G. D. 2021, AJ, 162, 28 [NASA ADS] [CrossRef] [Google Scholar]
- van der Marel, N., van Dishoeck, E. F., Bruderer, S., et al. 2013, Science, 340, 1199 [Google Scholar]
- van der Marel, N., Williams, J. P., Picogna, G., et al. 2022, Phys. Rev. Res., 4, 023056 [NASA ADS] [CrossRef] [Google Scholar]
- Veronesi, B., Paneque-Carreño, T., Lodato, G., et al. 2021, ApJ, 914, L27 [NASA ADS] [CrossRef] [Google Scholar]
- Whipple, F. L. 1972, in From Plasma to Planet, ed. A. Elvius (Saltsjöbaden: Wiley Interscience Division), 211 [Google Scholar]
- Wölfer, L., Facchini, S., Van Der Marel, N., et al. 2023, A&A, 670, A154 [NASA ADS] [CrossRef] [EDP Sciences] [Google Scholar]
- Xu, Z., & Bai, X.-N. 2022, ApJ, 937, L4 [NASA ADS] [CrossRef] [Google Scholar]
- Yamaguchi, M., Tsukagoshi, T., Muto, T., et al. 2021, ApJ, 923, 121 [NASA ADS] [CrossRef] [Google Scholar]
- Yang, Y., Liu, H. B., Muto, T., et al. 2023, Che, Eng. J., 464, 142527 [CrossRef] [Google Scholar]
- Zahn, J. P. 1977, A&A, 57, 383 [Google Scholar]
- Zahn, J. P., & Bouchet, L. 1989, A&A, 223, 112 [NASA ADS] [Google Scholar]
- Zhang, K., Blake, G. A., & Bergin, E. A. 2015, ApJ, 806, L7 [Google Scholar]
- Zhu, Z., & Baruteau, C. 2016, MNRAS, 458, 3918 [Google Scholar]
- Zhu, Z., Nelson, R. P., Dong, R., Espaillat, C., & Hartmann, L. 2012, ApJ, 755, 6 [Google Scholar]
- Zurlo, A., Cieza, L. A., Ansdell, M., et al. 2021, MNRAS, 501, 2305 [NASA ADS] [CrossRef] [Google Scholar]
All Tables
All Figures
|
Fig. 1 ALMA continuum emission around Sz 65 (right) and Sz 66 (left) (colour map) both shown in the same field. The colour stretch is on a log scale. The contour denotes the gas disc within 5σCO. |
| In the text | |
|
Fig. 2 ALMA continuum images of Sz 65 and Sz 66. Contours are shown at (5,10,20,30,40) ×σcont. The synthesised beam is shown in the lower left corner by the white ellipse. |
| In the text | |
|
Fig. 3 Moment 1 map of 12CO in Sz 65 (top) and Sz 66 (bottom). Contours show the surface brightness in the moment 0 map at (3, 15, 30) × σCO, where σCO =1.3 mJybeam−1 km s−1. Both maps were created using emission in the cube above a threshold of 3σ. The Sz 66 field is visibly noisier because it is found towards the edge of the primary beam in the observations that were centred on Sz 65. |
| In the text | |
|
Fig. 4 Azimuthally averaged deprojected radial intensity profiles of the dust continuum (red) and CO emission (blue) for Sz 65 (solid line) and Sz 66 (dashed line). The standard deviation in each of the radial bins used for averaging is shown as the shaded area. The beam size for the continuum data corresponds to ~4 au, and the CO data have ~15 au. |
| In the text | |
|
Fig. 5 Azimuthally averaged brightness profile from reconstructed images of Sz 65 and Sz 66 using robust = 0 and robust = 2. We also plot the brightness profile found by the non-parametric visibility fitting. We show three different model fits with a varying fit parameter α. Additionally, we show the FRANK profile convolved with the synthesised beam of the observations, and a profile derived from an image using robust = −2. |
| In the text | |
|
Fig. 6 Model fit to the real component of the deprojected visibilities of Sz 65 as a function of the baseline. |
| In the text | |
|
Fig. 7 Residual emission for Sz 65 following the subtraction of an axisymmetric model fitted to the visibilities from the original data. The solid white lines show residuals in steps of σ, positive contours begin at 3σ, and dashed lines show negative contours that begin at −3σ. The solid black line shows the 3σ emission contour of the continuum image prior to the model subtraction. |
| In the text | |
|
Fig. 8 Model fit to the real component of the deprojected visibilities of Sz 66 as a function of the baseline. |
| In the text | |
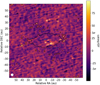 |
Fig. 9 Same as Fig. 7, but for Sz 66. |
| In the text | |
|
Fig. 10 Residual map following the subtraction of a Keplerian disc model with elevated emission constructed from the velocity information in 12CO observations towards Sz 65. The colour scale is set to match the full range of the data before subtraction. |
| In the text | |
|
Fig. 11 Same as in Fig. 10, but for Sz 66. The 12CO detection in this disc is much weaker and affects the model fit. |
| In the text | |
|
Fig. 12 Probability distribution P(Rt) for the disc radii expected in Sz 65 and Sz 66 assuming tidal truncation of the disc by its binary partner. The calculations were run for each binary partner for two different uniform eccentricity priors, one with emax = 0.7, and one allowing for high-inclination solutions with emax = 0.9. The vertical lines show the measured R90 for each disc by this work. |
| In the text | |
|
Fig. 13 Brightness temperature as a function of radius calculated from the 1.3mm continuum images of Sz 65 (red) and Sz 66 (blue) compared with the results of the DSHARP survey (grey). In addition, we plot the radial profile of the well-resolved compact disc CX Tau (Facchini et al. 2017). All DSHARP discs are plotted in the top panel. Only discs classified as compact are plotted in the lower panel and are listed on the right side. Discs with a derived disc size >50 au are plotted with dashed lines. |
| In the text | |
|
Fig. A1 Channel maps of 12CO(2-1) in Sz 65 at the native resolution with a synthesising beam |
| In the text | |
|
Fig. A2 Channel maps of 12CO(2-1) in Sz 65 after the application of |
| In the text | |
|
Fig. A3 Corner plot showing the MCMC results for the rotational model fit to the 12CO observations, achieved by fixing the inclination to the continuum value of 63.76°, using a stellar mass of 0.76 M⊙ (Alcalá et al. 2017) and a distance derived from Gaia EDR3 153.1 pc. |
| In the text | |
|
Fig. A4 Corner plot showing the MCMC results for the rotational model fit to the 12CO observations, achieved by fixing the stellar mass of 0.31 M⊙ (Alcalá et al. 2014) and a distance derived from Gaìa EDR3 156.0 pc. |
| In the text | |
Current usage metrics show cumulative count of Article Views (full-text article views including HTML views, PDF and ePub downloads, according to the available data) and Abstracts Views on Vision4Press platform.
Data correspond to usage on the plateform after 2015. The current usage metrics is available 48-96 hours after online publication and is updated daily on week days.
Initial download of the metrics may take a while.