Fig. 13

Download original image
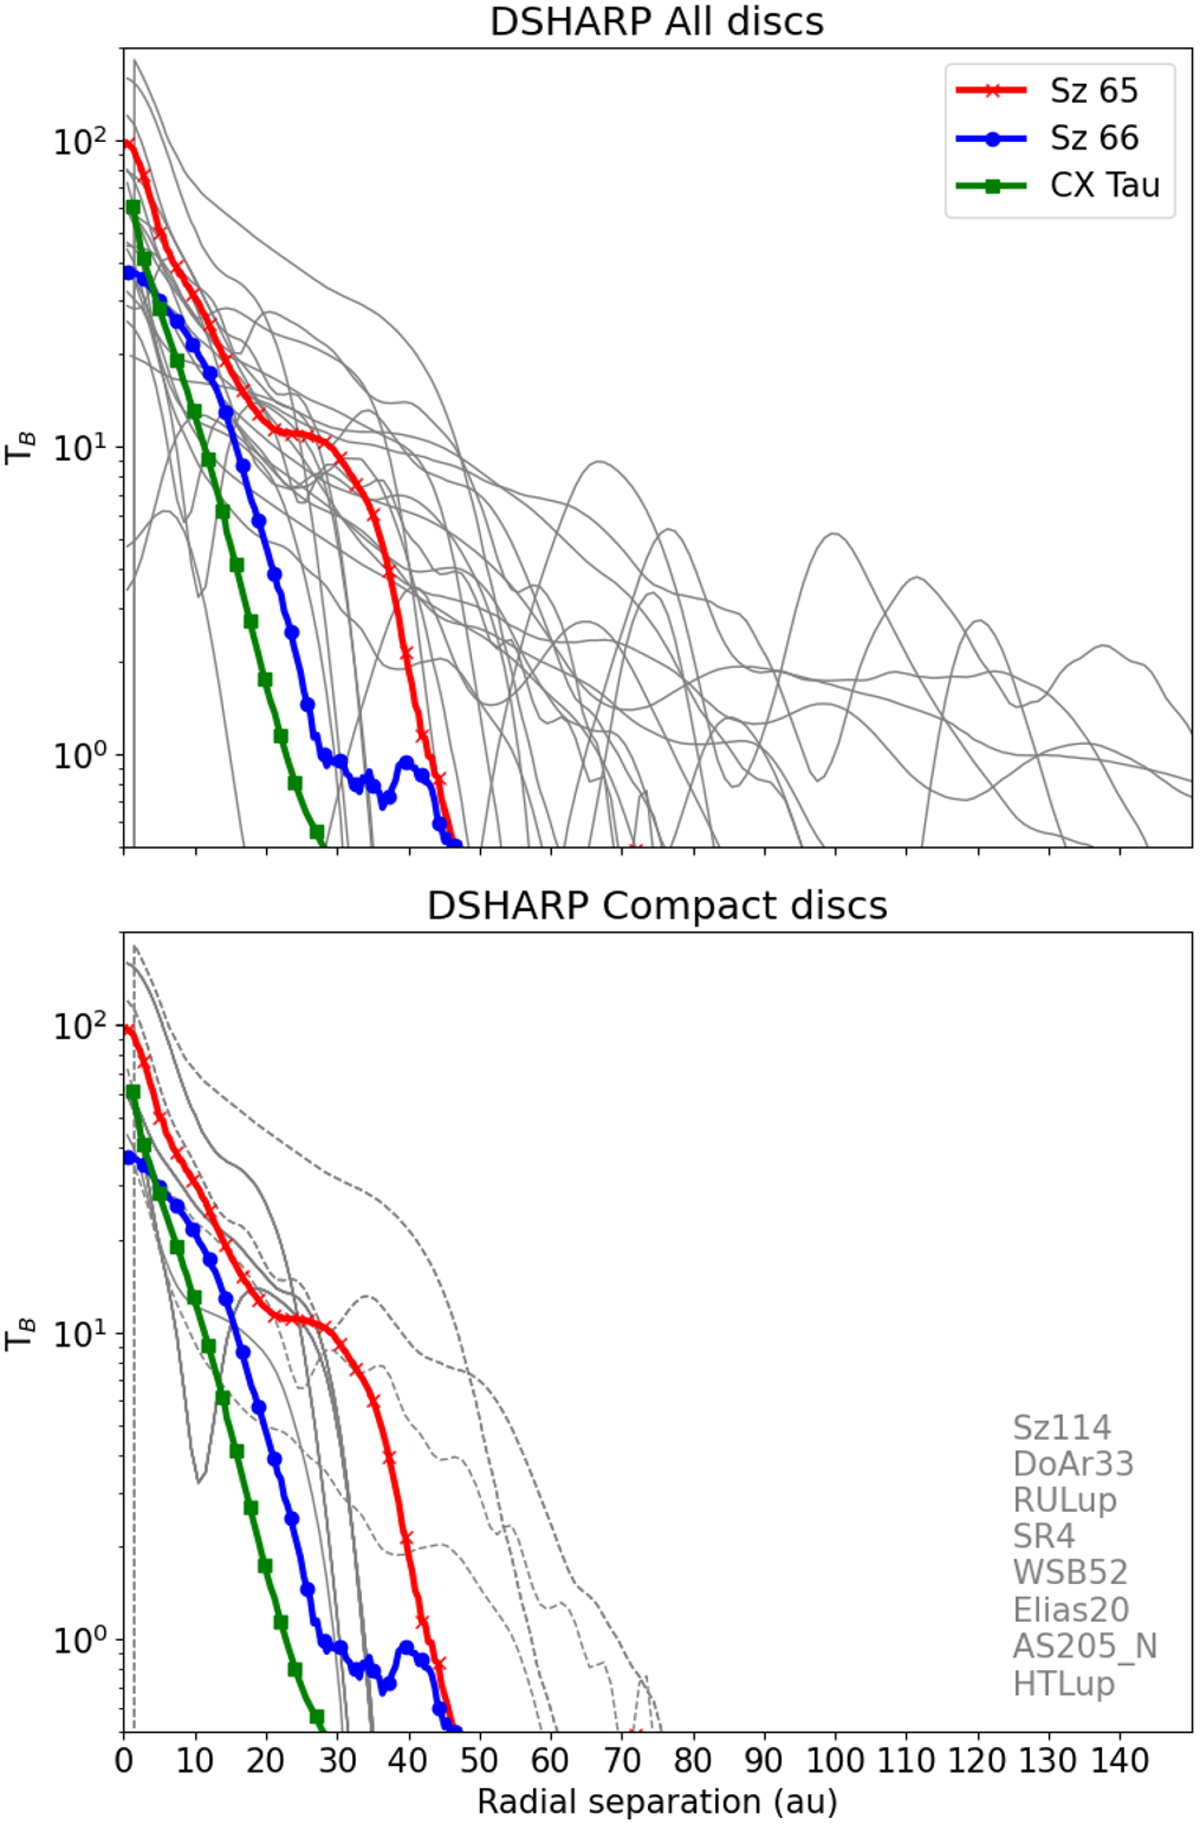
Brightness temperature as a function of radius calculated from the 1.3mm continuum images of Sz 65 (red) and Sz 66 (blue) compared with the results of the DSHARP survey (grey). In addition, we plot the radial profile of the well-resolved compact disc CX Tau (Facchini et al. 2017). All DSHARP discs are plotted in the top panel. Only discs classified as compact are plotted in the lower panel and are listed on the right side. Discs with a derived disc size >50 au are plotted with dashed lines.
Current usage metrics show cumulative count of Article Views (full-text article views including HTML views, PDF and ePub downloads, according to the available data) and Abstracts Views on Vision4Press platform.
Data correspond to usage on the plateform after 2015. The current usage metrics is available 48-96 hours after online publication and is updated daily on week days.
Initial download of the metrics may take a while.


