Fig. 7
Download original image
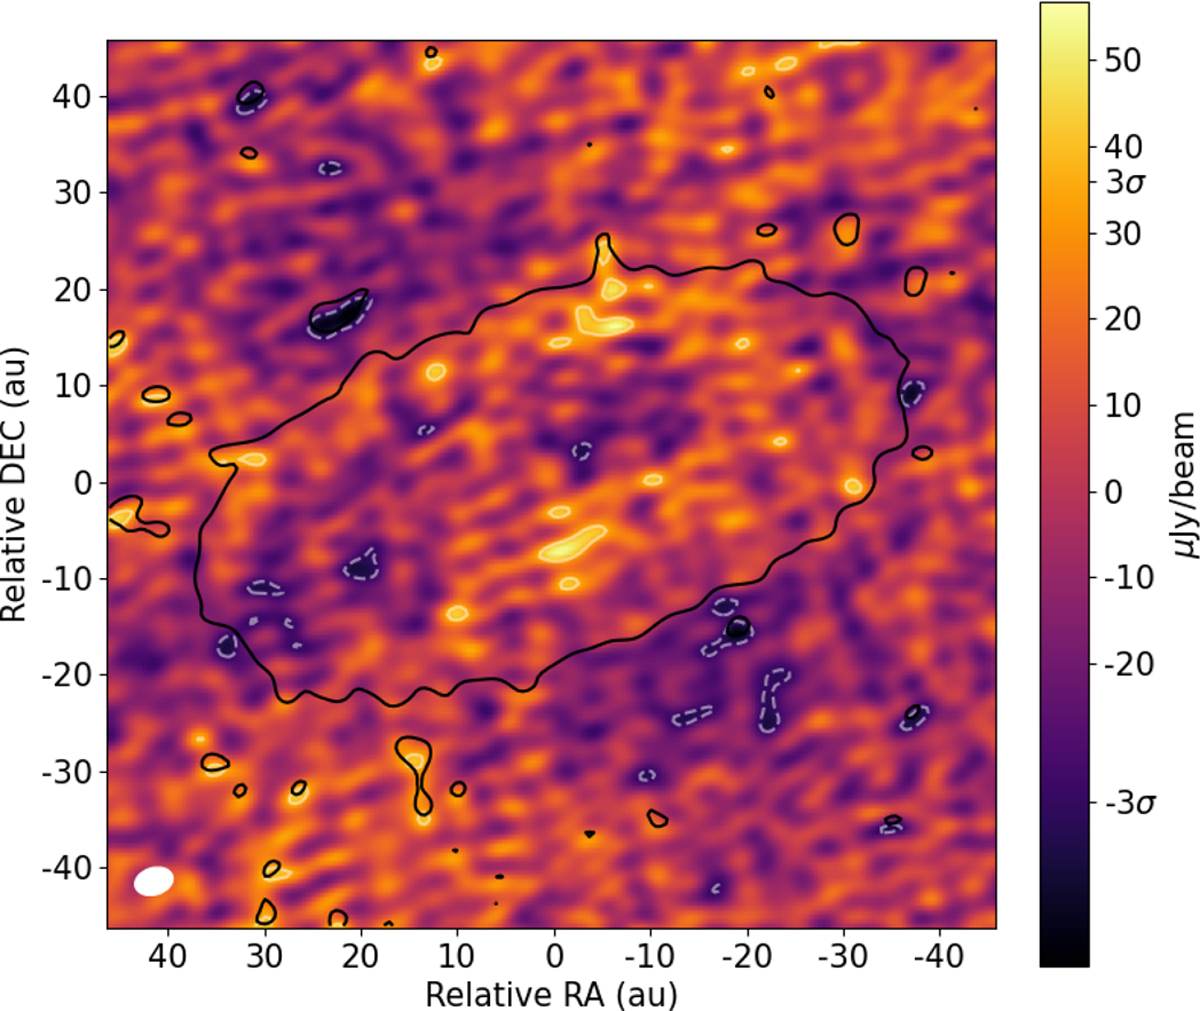
Residual emission for Sz 65 following the subtraction of an axisymmetric model fitted to the visibilities from the original data. The solid white lines show residuals in steps of σ, positive contours begin at 3σ, and dashed lines show negative contours that begin at −3σ. The solid black line shows the 3σ emission contour of the continuum image prior to the model subtraction.
Current usage metrics show cumulative count of Article Views (full-text article views including HTML views, PDF and ePub downloads, according to the available data) and Abstracts Views on Vision4Press platform.
Data correspond to usage on the plateform after 2015. The current usage metrics is available 48-96 hours after online publication and is updated daily on week days.
Initial download of the metrics may take a while.