Fig. 3
Download original image
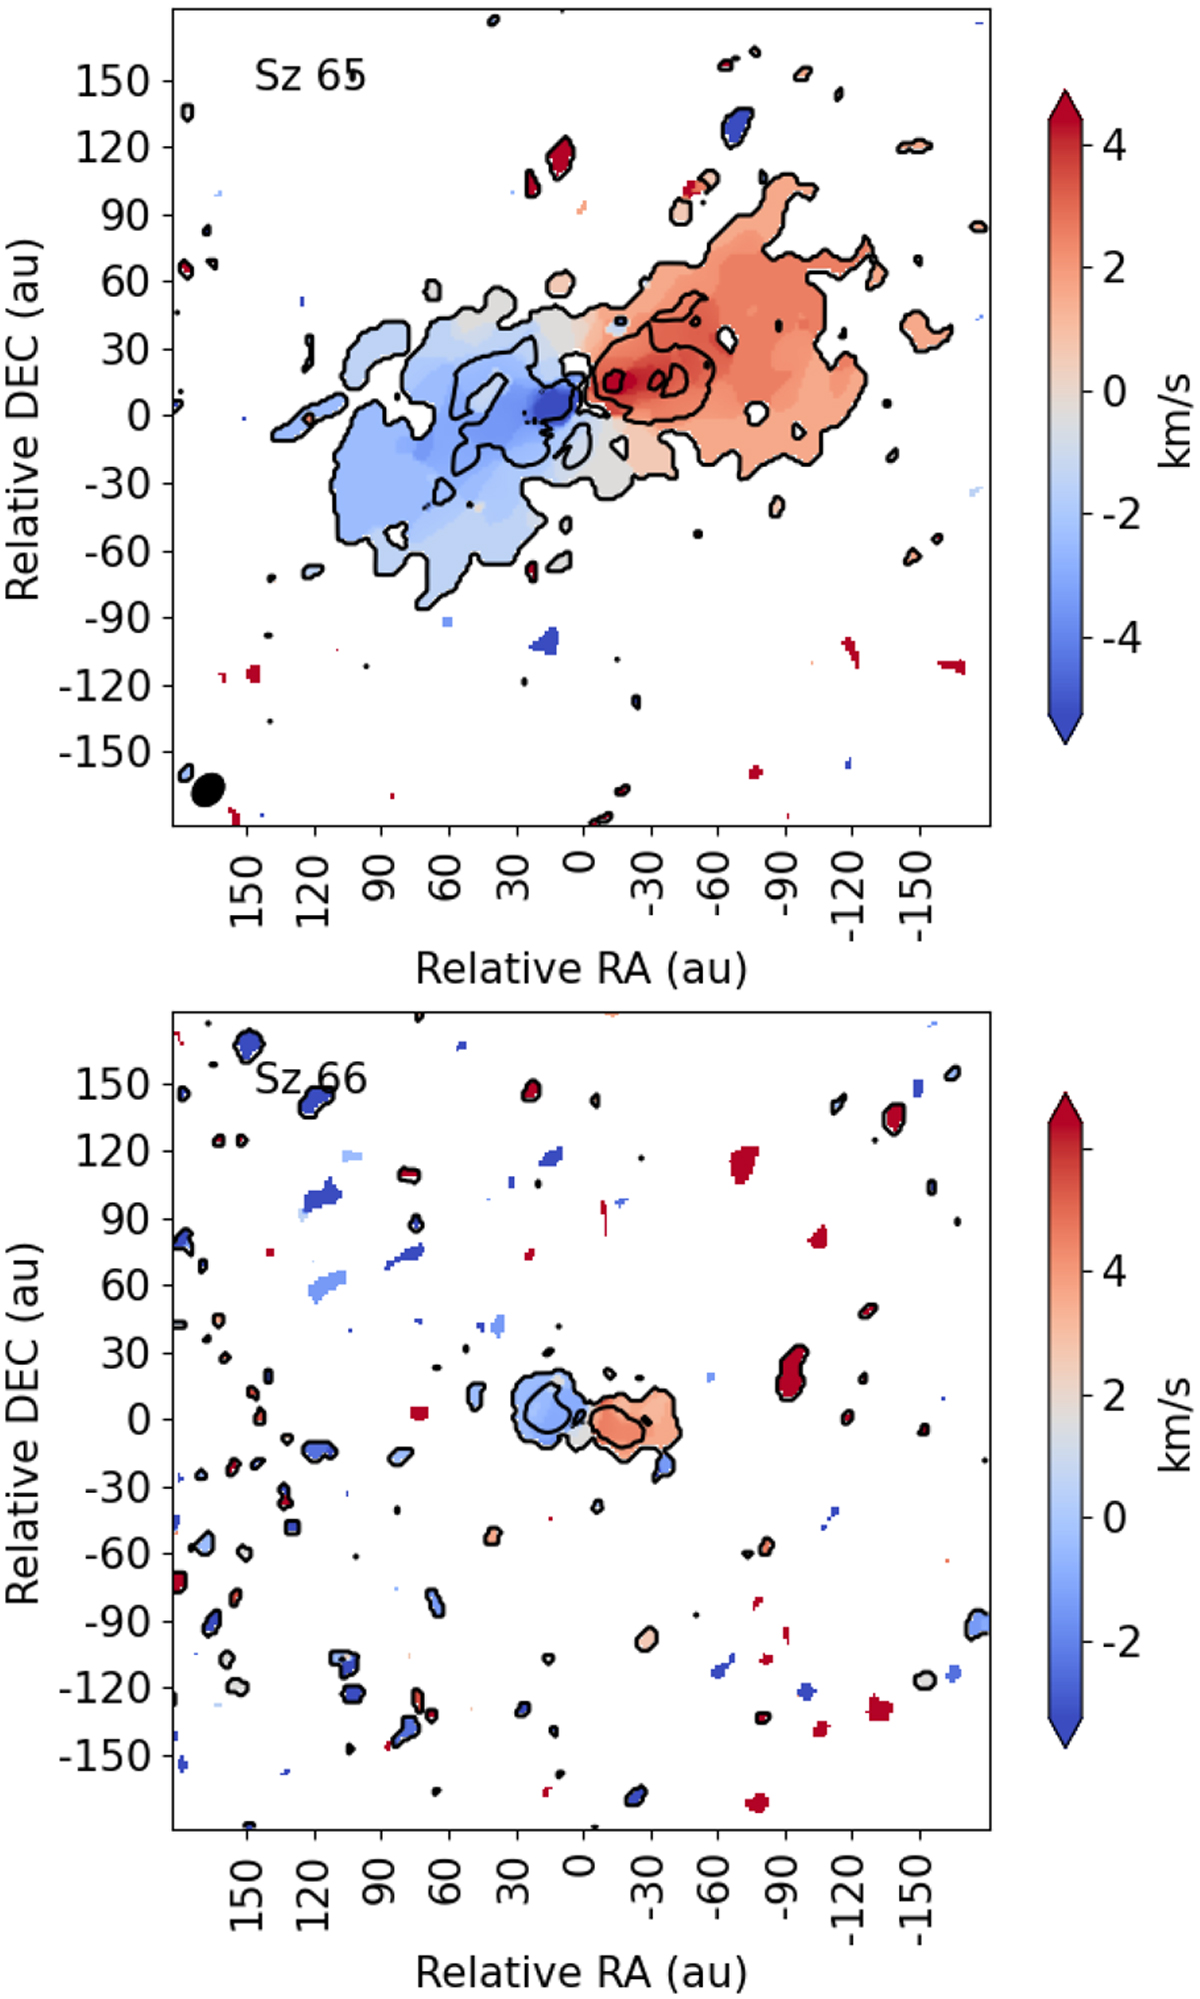
Moment 1 map of 12CO in Sz 65 (top) and Sz 66 (bottom). Contours show the surface brightness in the moment 0 map at (3, 15, 30) × σCO, where σCO =1.3 mJybeam−1 km s−1. Both maps were created using emission in the cube above a threshold of 3σ. The Sz 66 field is visibly noisier because it is found towards the edge of the primary beam in the observations that were centred on Sz 65.
Current usage metrics show cumulative count of Article Views (full-text article views including HTML views, PDF and ePub downloads, according to the available data) and Abstracts Views on Vision4Press platform.
Data correspond to usage on the plateform after 2015. The current usage metrics is available 48-96 hours after online publication and is updated daily on week days.
Initial download of the metrics may take a while.